Estimated zip code population in 2022: 5,763 Zip code population in 2010: 6,073 Zip code population in 2000: 6,087
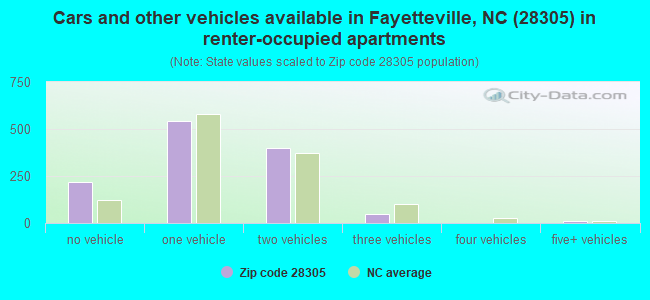
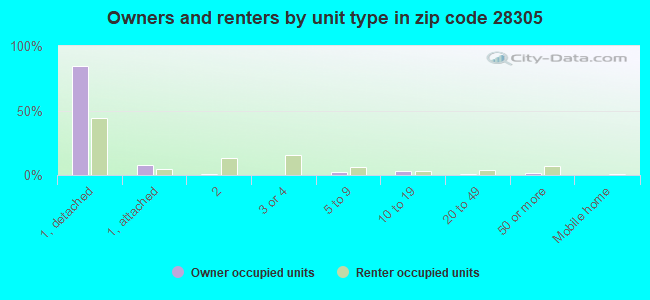
Houses and condos: 3,447 Renter-occupied apartments: 1,225
% of renters here:
41%
State:
33%
March 2022 cost of living index in zip code 28305: 89.5 (less than average, U.S. average is 100)
Land area: 2.6 sq. mi. Water area: 0.1 sq. mi.
Population density: 2,216 people per square mile
(low).
OSM Map
General Map
Google Map
MSN Map
OSM Map
General Map
Google Map
MSN Map
OSM Map
General Map
Google Map
MSN Map
OSM Map
General Map
Google Map
MSN Map
Please wait while loading the map...
Real estate property taxes paid for housing units in 2022:
This zip code:
1.1% ($3,102)
North Carolina:
0.6% ($1,769)
Median real estate property taxes paid for housing units with mortgages in 2022: $3,187 (1.2%) Median real estate property taxes paid for housing units with no mortgage in 2022: $2,794 (1.0%)
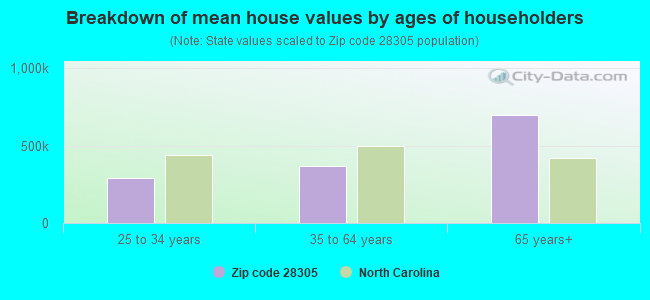
Estimated median house/condo value in 2022: $270,805
28305:
$270,805
North Carolina:
$280,600
According to our research of North Carolina and other state lists, there were 2 registered sex offenders living in 28305 zip code as of April 27, 2024. The ratio of all residents to sex offenders in zip code 28305 is 2,964 to 1. The ratio of registered sex offenders to all residents in this zip code is much lower than the state average.
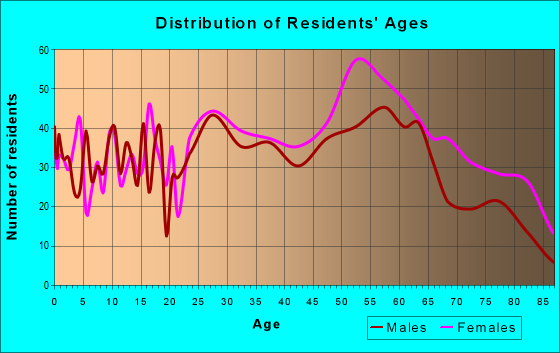
Median resident age:
This zip code:
42.4 years
North Carolina median age:
39.2 years
Average household size:
This zip code:
1.9 people
North Carolina:
2.4 people
Averages for the 2020 tax year for zip code 28305, filed in 2021:
Average Adjusted Gross Income (AGI) in 2020: $99,689 (Individual Income Tax Returns)
Here:
$99,689
State:
$70,020
Salary/wage: $64,075 (reported on 75.9% of returns)
Here:
$64,075
State:
$58,387
(% of AGI for various income ranges: 1147.7% for AGIs below $25k, 3533.3% for AGIs $25k-50k, 6517.1% for AGIs $50k-75k, 10350.0% for AGIs $75k-100k, 21279.3% for AGIs $100k-200k, 90813.3% for AGIs over 200k)
Taxable interest for individuals: $2,993 (reported on 35.2% of returns)
This zip code:
$2,993
North Carolina:
$1,479
(% of AGI for various income ranges: 16.8% for AGIs below $25k, 26.7% for AGIs $25k-50k, 35.8% for AGIs $50k-75k, 39.2% for AGIs $75k-100k, 404.7% for AGIs $100k-200k, 3431.7% for AGIs over 200k)
Ordinary dividends: $11,205 (reported on 26.6% of returns)
Here:
$11,205
State:
$7,888
(% of AGI for various income ranges: 35.5% for AGIs below $25k, 84.5% for AGIs $25k-50k, 193.3% for AGIs $50k-75k, 460.8% for AGIs $75k-100k, 1252.0% for AGIs $100k-200k, 8368.3% for AGIs over 200k)
Net capital gain/loss in AGI: +$43,745 (reported on 25.2% of returns)
Here:
+$43,745
State:
+$23,652
(% of AGI for various income ranges: 16.6% for AGIs below $25k, 40.4% for AGIs $25k-50k, 190.4% for AGIs $50k-75k, 572.3% for AGIs $75k-100k, 1718.0% for AGIs $100k-200k, 46400.0% for AGIs over 200k)
Profit/loss from business: +$18,758 (reported on 18.3% of returns)
Here:
+$18,758
State:
+$11,710
(% of AGI for various income ranges: 113.7% for AGIs below $25k, 111.6% for AGIs $25k-50k, 167.5% for AGIs $50k-75k, 350.0% for AGIs $75k-100k, 1312.7% for AGIs $100k-200k, 9603.3% for AGIs over 200k)
Taxable individual retirement arrangement distribution: $20,317 (reported on 10.0% of returns)
28305:
$20,317
North Carolina:
$20,247
(% of AGI for various income ranges: 36.5% for AGIs below $25k, 95.9% for AGIs $25k-50k, 219.6% for AGIs $50k-75k, 448.5% for AGIs $75k-100k, 1058.0% for AGIs $100k-200k, 4110.0% for AGIs over 200k)
Self-employed (Keogh) retirement plans: $18,533 (reported on 1.0% of returns)
28305:
$18,533
North Carolina:
$26,749
(% of AGI for various income ranges: 370.7% for AGIs $100k-200k)
Total itemized deductions: $38,402 (reported on 13.8% of returns)
Here:
$38,402
State:
$34,549
(% of AGI for various income ranges: 78.7% for AGIs below $25k, 121.4% for AGIs $25k-50k, 431.2% for AGIs $50k-75k, 929.2% for AGIs $75k-100k, 2396.0% for AGIs $100k-200k, 13950.0% for AGIs over 200k)
Charity contributions: $18,876 (reported on 11.4% of returns)
Here:
$18,876
State:
$13,360
(% of AGI for various income ranges: 46.7% for AGIs $25k-50k, 113.3% for AGIs $50k-75k, 188.5% for AGIs $75k-100k, 918.0% for AGIs $100k-200k, 6843.3% for AGIs over 200k)
Taxes paid: $7,869 (reported on 13.4% of returns)
28305:
$7,869
State:
$7,586
(% of AGI for various income ranges: 13.0% for AGIs below $25k, 24.3% for AGIs $25k-50k, 94.6% for AGIs $50k-75k, 240.8% for AGIs $75k-100k, 559.3% for AGIs $100k-200k, 2465.0% for AGIs over 200k)
Earned income credit: $2,229 (reported on 17.6% of returns)
Here:
$2,229
State:
$2,337
(% of AGI for various income ranges: 116.1% for AGIs below $25k, 63.9% for AGIs $25k-50k)
Percentage of individuals using paid preparers for their 2020 taxes: 93.1%
Here:
93%
State:
93%
(% for various income ranges: 90.9% for AGIs below $25k, 95.4% for AGIs $25k-50k, 91.9% for AGIs $50k-75k, 95.7% for AGIs $75k-100k, 92.3% for AGIs $100k-200k, 96.3% for AGIs over 200k)
Averages for the 2012 tax year for zip code 28305, filed in 2013:
Average Adjusted Gross Income (AGI) in 2012: $81,060 (Individual Income Tax Returns)
Here:
$81,060
State:
$54,937
Salary/wage: $54,410 (reported on 76.9% of returns)
Here:
$54,410
State:
$46,336
(% of AGI for various income ranges: 70.4% for AGIs below $25k, 75.9% for AGIs $25k-50k, 67.6% for AGIs $50k-75k, 65.8% for AGIs $75k-100k, 58.8% for AGIs $100k-200k, 35.9% for AGIs over 200k)
Taxable interest for individuals: $3,043 (reported on 40.3% of returns)
This zip code:
$3,043
North Carolina:
$1,298
(% of AGI for various income ranges: 1.3% for AGIs below $25k, 0.8% for AGIs $25k-50k, 1.0% for AGIs $50k-75k, 0.9% for AGIs $75k-100k, 1.1% for AGIs $100k-200k, 2.0% for AGIs over 200k)
Ordinary dividends: $10,049 (reported on 27.9% of returns)
Here:
$10,049
State:
$6,213
(% of AGI for various income ranges: 3.1% for AGIs below $25k, 1.9% for AGIs $25k-50k, 2.8% for AGIs $50k-75k, 2.9% for AGIs $75k-100k, 3.6% for AGIs $100k-200k, 4.0% for AGIs over 200k)
Net capital gain/loss in AGI: +$37,490 (reported on 22.4% of returns)
Here:
+$37,490
State:
+$12,740
(% of AGI for various income ranges: 0.5% for AGIs $50k-75k, 0.8% for AGIs $75k-100k, 4.7% for AGIs $100k-200k, 19.6% for AGIs over 200k)
Profit/loss from business: +$21,920 (reported on 16.2% of returns)
Here:
+$21,920
State:
+$10,311
(% of AGI for various income ranges: 8.0% for AGIs below $25k, 3.5% for AGIs $25k-50k, 2.4% for AGIs $50k-75k, 2.2% for AGIs $75k-100k, 5.9% for AGIs $100k-200k, 4.2% for AGIs over 200k)
Taxable individual retirement arrangement distribution: $17,611 (reported on 12.0% of returns)
28305:
$17,611
North Carolina:
$15,575
(% of AGI for various income ranges: 2.9% for AGIs below $25k, 1.3% for AGIs $25k-50k, 2.6% for AGIs $50k-75k, 3.6% for AGIs $75k-100k, 4.5% for AGIs $100k-200k, 1.9% for AGIs over 200k)
Self-employment retirement plans: $21,900 (reported on 1.3% of returns)
28305:
$21,900
North Carolina:
$21,078
Total itemized deductions: $35,527 (22% of AGI, reported on 39.9% of returns)
Here:
$35,527
State:
$23,438
Here:
22.0% of AGI
State:
21.5% of AGI
(% of AGI for various income ranges: 15.4% for AGIs below $25k, 15.1% for AGIs $25k-50k, 14.9% for AGIs $50k-75k, 18.7% for AGIs $75k-100k, 19.1% for AGIs $100k-200k, 17.9% for AGIs over 200k)
Charity contributions: $8,627 (reported on 34.4% of returns)
Here:
$8,627
State:
$4,687
(% of AGI for various income ranges: 1.7% for AGIs below $25k, 2.4% for AGIs $25k-50k, 2.8% for AGIs $50k-75k, 3.3% for AGIs $75k-100k, 4.0% for AGIs $100k-200k, 4.2% for AGIs over 200k)
Taxes paid: $14,085 (reported on 39.9% of returns)
28305:
$14,085
State:
$8,823
(% of AGI for various income ranges: 2.1% for AGIs below $25k, 3.8% for AGIs $25k-50k, 4.7% for AGIs $50k-75k, 6.2% for AGIs $75k-100k, 7.7% for AGIs $100k-200k, 8.4% for AGIs over 200k)
Earned income credit: $2,129 (reported on 19.2% of returns)
Here:
$2,129
State:
$2,376
(% of AGI for various income ranges: 7.0% for AGIs below $25k, 0.7% for AGIs $25k-50k)
Percentage of individuals using paid preparers for their 2012 taxes: 60.1%
Here:
60%
State:
53%
(% for various income ranges: 53.3% for AGIs below $25k, 54.3% for AGIs $25k-50k, 59.5% for AGIs $50k-75k, 70.0% for AGIs $75k-100k, 73.0% for AGIs $100k-200k, 86.4% for AGIs over 200k)
Averages for the 2004 tax year for zip code 28305, filed in 2005:
Average Adjusted Gross Income (AGI) in 2004: $71,840 (Individual Income Tax Returns)
Here:
$71,840
State:
$45,376
Salary/wage: $46,299 (reported on 76.6% of returns)
Here:
$46,299
State:
$39,442
(% of AGI for various income ranges: 102.4% for AGIs below $10k, 74.7% for AGIs $10k-25k, 76.0% for AGIs $25k-50k, 69.4% for AGIs $50k-75k, 62.7% for AGIs $75k-100k, 36.8% for AGIs over 100k)
Taxable interest for individuals: $3,766 (reported on 47.4% of returns)
This zip code:
$3,766
North Carolina:
$1,515
(% of AGI for various income ranges: 9.2% for AGIs below $10k, 2.4% for AGIs $10k-25k, 1.9% for AGIs $25k-50k, 1.9% for AGIs $50k-75k, 1.7% for AGIs $75k-100k, 2.7% for AGIs over 100k)
Taxable dividends: $8,355 (reported on 34.0% of returns)
Here:
$8,355
State:
$4,016
(% of AGI for various income ranges: 8.6% for AGIs below $10k, 1.8% for AGIs $10k-25k, 2.6% for AGIs $25k-50k, 3.0% for AGIs $50k-75k, 2.7% for AGIs $75k-100k, 4.6% for AGIs over 100k)
Net capital gain/loss: +$20,776 (reported on 28.6% of returns)
Here:
+$20,776
State:
+$11,152
(% of AGI for various income ranges: -5.8% for AGIs below $10k, -0.4% for AGIs $10k-25k, 0.6% for AGIs $25k-50k, 2.8% for AGIs $50k-75k, 3.1% for AGIs $75k-100k, 12.1% for AGIs over 100k)
Profit/loss from business: +$31,819 (reported on 15.4% of returns)
Here:
+$31,819
State:
+$9,490
(% of AGI for various income ranges: 15.7% for AGIs below $10k, 4.5% for AGIs $10k-25k, 2.2% for AGIs $25k-50k, 4.3% for AGIs $50k-75k, 5.0% for AGIs $75k-100k, 8.3% for AGIs over 100k)
IRA payment deduction: $3,402 (reported on 2.9% of returns)
28305:
$3,402
North Carolina:
$2,967
(% of AGI for various income ranges: 0.2% for AGIs $10k-25k, 0.2% for AGIs $25k-50k, 0.2% for AGIs $50k-75k, 0.3% for AGIs $75k-100k, 0.1% for AGIs over 100k)
Self-employed pension: $17,093 (reported on 1.3% of returns)
Here:
$17,093
North Carolina:
$14,754
Total itemized deductions: $29,780 (20% of AGI, reported on 39.0% of returns)
Here:
$29,780
State:
$19,464
Here:
19.9% of AGI
State:
22.7% of AGI
(% of AGI for various income ranges: 18.5% for AGIs below $10k, 10.2% for AGIs $10k-25k, 13.9% for AGIs $25k-50k, 17.8% for AGIs $50k-75k, 19.0% for AGIs $75k-100k, 16.6% for AGIs over 100k)
Charity contributions deductions: $7,741 (5% of AGI, reported on 35.9% of returns)
Here:
$7,741
State:
$4,035
Here:
4.9% of AGI
State:
4.5% of AGI
(% of AGI for various income ranges: 2.0% for AGIs below $10k, 1.7% for AGIs $10k-25k, 2.7% for AGIs $25k-50k, 3.1% for AGIs $50k-75k, 3.6% for AGIs $75k-100k, 4.5% for AGIs over 100k)
Total tax: $15,753 (reported on 74.9% of returns)
28305:
$15,753
State:
$7,257
(% of AGI for various income ranges: 4.3% for AGIs below $10k, 4.0% for AGIs $10k-25k, 7.3% for AGIs $25k-50k, 10.1% for AGIs $50k-75k, 11.4% for AGIs $75k-100k, 20.9% for AGIs over 100k)
Earned income credit: $1,811 (reported on 17.8% of returns)
Here:
$1,811
State:
$1,851
Percentage of individuals using paid preparers for their 2004 taxes: 70.5%
Here:
70%
State:
62%
(% for various income ranges: 70.3% for AGIs below $10k, 68.9% for AGIs $10k-25k, 65.0% for AGIs $25k-50k, 69.6% for AGIs $50k-75k, 68.7% for AGIs $75k-100k, 84.5% for AGIs over 100k)
Likely homosexual households (counted as self-reported same-sex unmarried-partner households)
Lesbian couples: 0.5% of all households
Gay men: 0.4% of all households
Household received Food Stamps/SNAP in the past 12 months: 314 Household did not receive Food Stamps/SNAP in the past 12 months: 2,642
Women who had a birth in the past 12 months: 34 (35 now married, 0 unmarried) Women who did not have a birth in the past 12 months: 1,143 (636 now married, 510 unmarried)
Housing units in zip code 28305 with a mortgage: 1,086 (102 second mortgage, 77 both second mortgage and home equity loan) Houses without a mortgage: 38
Median monthly owner costs for units with a mortgage: $1,581 Median monthly owner costs for units without a mortgage: $615
Residents with income below the poverty level in 2022:
This zip code:
15.0%
Whole state:
12.8%
Residents with income below 50% of the poverty level in 2022:
This zip code:
6.2%
Whole state:
6.8%
Median number of rooms in houses and condos:
Here:
6.4
State:
6.4
Median number of rooms in apartments:
Here:
4.7
State:
4.4
Notable locations in this zip code not listed on our city pages
In group quarters: 28 (-1 institutionalized population)
Size of family households: 929 2-persons, 270 3-persons, 333 4-persons, 63 5-persons, 10 6-persons
Size of nonfamily households: 1,248 1-person, 97 2-persons, 5 3-persons
743 married couples with children.
320 single-parent households (43 men, 277 women).
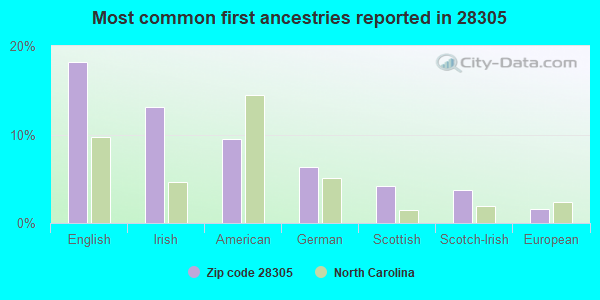
89.2% of residents of 28305 zip code speak English at home.
7.4% of residents speak Spanish at home (74% very well, 14% well, 10% not well, 2% not at all).
1.3% of residents speak other Indo-European language at home (70% very well, 30% well).
1.7% of residents speak Asian or Pacific Island language at home (100% very well).
0.4% of residents speak other language at home (100% very well).
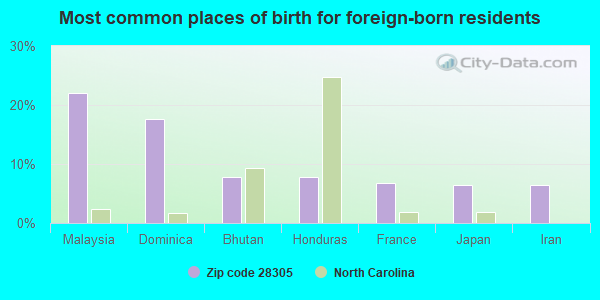
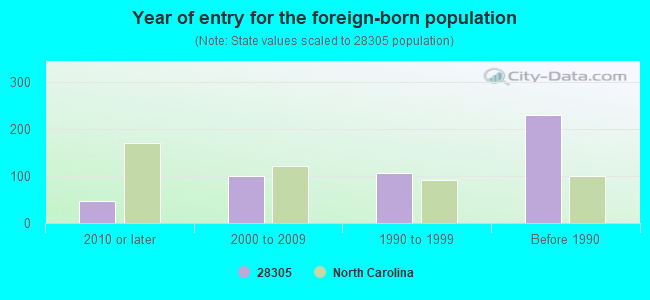
Foreign born population: 303 (5.3%) (85.2% of them are naturalized citizens)
AIR SYNTHETIC MINOR (AIRS/AFS) STATE MASTER (North Carolina facility info) - AIR PROGRAM, UNDERGROUND STORAGE TANK PROGRAM CRITERIA AND HAZARDOUS AIR POLLUTANT INVENTORY (Inventory of air pollution sources) Business SIC classification: ASPHALT PAVING MIXTURES AND BLOCKS; NONCLASSIFIABLE ESTABLISHMENTS Business NAICS classification: ASPHALT PAVING MIXTURE AND BLOCK MANUFACTURING.; ASPHALT PAVING MIXTURE AND BLOCK MANUFACTURING. Alternative names: BARNHILL CONTRACTING COMPANY - SHAW PLA, CROWELL CONSTRUCTORS - SHAW PLANT
ALPHA ACADEMY (907 HAY STREET in FAYETTEVILLE, NC)
(National Center for Education Statistics) - STATE ID-0
APAC FAYETTEVILLE ASPHALT PLANT (6030 MURCHISON RD. in FAYETTEVILLE, NC)
National Pollutant Discharge Elimination System NON-MAJOR (Tracking pollutant discharge elimination systems) - permit TRI REPORTER (Tracking of toxic chemicals releasing facilities) Business SIC classification: HIGHWAY AND STREET CONSTRUCTION, EXCEPT ELEVATED HIGHWAYS; ASPHALT PAVING MIXTURES AND BLOCKS Alternative names: APAC ATLANTIC INC COASTAL CAR, APAC CAROLINA INC - CROWELL, APAC - CAROLINA CROWELL BRANCH, APAC-CAROLINA INC., APAC CROWELL SHAW PLANT, BARNHILL CONTRACTING CO SHAW P
Housing units lacking complete plumbing facilities: 4.5% Housing units lacking complete kitchen facilities: 2.5%
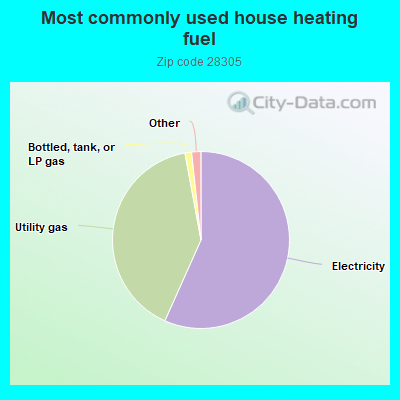
56.7%Electricity
40.4%Utility gas
1.2%Bottled, tank, or LP gas
0.8%Other fuel
0.6%Fuel oil, kerosene, etc.
Population in 1990: 6,670.
Place of birth for U.S.-born residents:
This state: 2,522
Northeast: 493
Midwest: 359
South: 1,465
West: 442
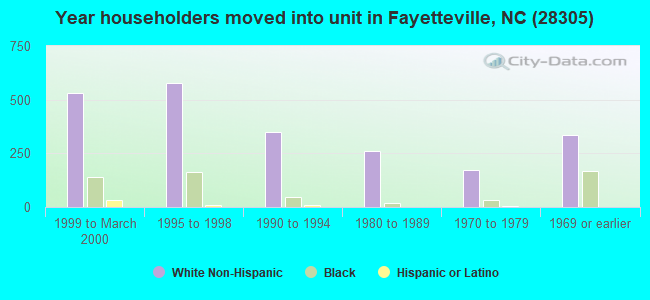
54% of the 28305 zip code residents lived in the same house 5 years ago. Out of people who lived in different houses, 64% lived in this county. Out of people who lived in different counties, 50% lived in North Carolina.
88% of the 28305 zip code residents lived in the same house 1 year ago. Out of people who lived in different houses, 47% moved from this county. Out of people who lived in different houses, 17% moved from different county within same state. Out of people who lived in different houses, 34% moved from different state.
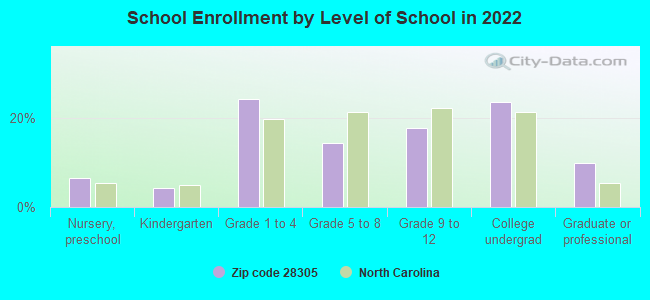
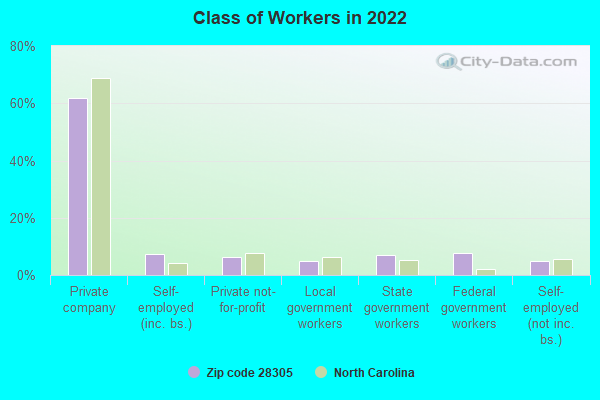
Private vs. public school enrollment:
Students in private schools in grades 1 to 8 (elementary and middle school): 180
Here:
36.5%
North Carolina:
13.8%
Students in private schools in grades 9 to 12 (high school): 13
Here:
6.1%
North Carolina:
11.9%
Students in private undergraduate colleges: 24
Here:
8.4%
North Carolina:
19.3%
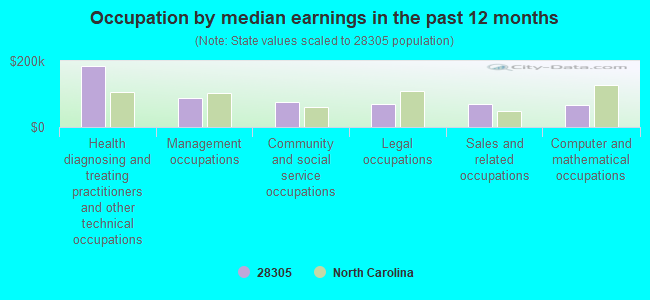
Occupation by median earnings in the past 12 months ($)
184,942Health diagnosing and treating practitioners and other technical occupations
87,504Management occupations
76,636Community and social service occupations
70,987Legal occupations
69,657Sales and related occupations
66,666Computer and mathematical occupations
Companies with biggest federal contracts located in this zip code (FAYETTEVILLE, NC):
NATIONAL GAS DISTRIBUTORS, LLC (1314 D RAEFORD RD) : $26,243,456 in 33 contractsfrom 2004 to 2005
Contracts for Gases: Compressed and Liquefied, Gas Services by Defense Logistics Agency, Army Signed by year:2000: $0; 2001: $0; 2002: $0; 2003: $0; 2004: $2,373,395; 2005: $23,870,061; 2006: $0.
Biggest contracts:
$16,125,826 with Defense Logistics Agency for Gases: Compressed and Liquefied. Signed on 2005-06-21. Completion date: 2008-09-30.
$3,448,593 with Army for Gases: Compressed and Liquefied. Signed on 2005-10-24. Completion date: 2005-10-31.
$2,319,317, same as above.Signed on 2004-10-05. Completion date: 2005-09-30.
$647,500, same as above.Signed on 2005-11-18. Completion date: 2005-11-30.
APAC-CAROLINA-CROWELL CONSTRUC (1100 ROBESON ST) : $5,389,322 in 97 contractsfrom 1999 to 2005
Contracts for Maintenance, Repair or Alteration of Real Property -- Airport Runways, Maintenance, Repair or Alteration of Real Property -- Highways, Roads, Streets, Bridges, and Railways (includes resurfacing), Construction of Structures and Facilities -- Miscellaneous Buildings, Maintenance, Repair or Alteration of Real Property -- Office Buildings, and moreby Navy, Air Force, Army Signed by year:2000: $951,185; 2001: $1,346,728; 2002: $1,949,407; 2003: $1,090,084; 2004: $33,386; 2005: $10,948; 2006: $0.
Biggest contracts:
$817,000 with Navy for Maintenance, Repair or Alteration of Real Property -- Airport Runways. Signed on 2003-09-22. Completion date: 2003-09-22.
$721,512 with Air Force for Maintenance, Repair or Alteration of Real Property -- Highways, Roads, Streets, Bridges, and Railways (includes resurfacing). Signed on 2002-09-24. Completion date: 2003-03-24.
$419,457, same as above.Signed on 2002-09-24. Completion date: 2003-03-24.
$320,187, same as above.Signed on 2002-09-24. Completion date: 2002-11-29.
MORGAN RADIOLOGY, PA, (INC) (212 WESTMONT DRIVE; small business) : $893,262 in 5 contractsfrom 2004 to 2006
Contracts for General Health Care Services by Army Signed by year:2000: $0; 2001: $0; 2002: $0; 2003: $0; 2004: $520,000; 2005: $387,237; 2006: -$13,975.
Biggest contracts:
$390,000 with Army for General Health Care Services. Signed on 2005-11-04. Completion date: 2004-09-30.
$390,000, same as above.Signed on 2004-10-21. Completion date: 2004-09-30.
$130,000, same as above.Signed on 2004-06-03. Completion date: 2004-09-30.
-$2,763, same as above.Signed on 2005-08-15. Completion date: 2004-09-30.
MINC (1015 ROBESON ST STE 103; small business) : $193,338 in 3 contractsin 2005
$193,338 with Air Force for Office Furniture. Signed on 2005-09-29. Completion date: 2005-11-10.
$76,213, same as above.Signed on 2005-09-12. Completion date: 2005-10-15.
-$76,213, same as above.Signed on 2005-09-28. Completion date: 2005-10-15.
JAMES R NANCE JR / GEORGE B HERNDON (P.O. BOX 53688; small business) : $114,444 in 18 contractsfrom 2004 to 2006
Contracts for Lease or Rental of Facilities -- Office Buildings by Public Buildings Service Signed by year:2000: $0; 2001: $0; 2002: $0; 2003: $0; 2004: $12,716; 2005: $57,222; 2006: $44,506.
Biggest contracts:
$6,358 with Public Buildings Service for Lease or Rental of Facilities -- Office Buildings. Signed on 2006-04-01. Completion date: 2006-09-30.
$6,358, same as above.Signed on 2006-04-01. Completion date: 2006-09-30.
$6,358, same as above.Signed on 2006-07-01. Completion date: 2006-09-30.
$6,358, same as above.Signed on 2006-04-01. Completion date: 2006-09-30.
A A A GLASS COMPANY INC (930 ROBESON ST; small business) : $61,725 in 8 contractsfrom 2000 to 2006
Contracts for Maintenance, Repair or Alteration of Real Property -- Other Administrative Facilities and Service Buildings, Hardware, Commercial, Maintenance, Repair or Alteration of Real Property -- Other Conservation and Development Facilities, Maintenance, Repair or Alteration of Real Property -- Ammunition Facilities, and moreby Army, Air Force Signed by year:2000: $24,151; 2001: $0; 2002: $0; 2003: $0; 2004: $14,765; 2005: $15,251; 2006: $7,558.
Biggest contracts:
$16,230 with Army for Maintenance, Repair or Alteration of Real Property -- Other Administrative Facilities and Service Buildings. Signed on 2000-01-20. Completion date: 2000-03-01.
$9,950 with Army for Hardware, Commercial. Signed on 2005-04-15. Completion date: 2005-05-05.
$7,921 with Army for Maintenance, Repair or Alteration of Real Property -- Other Conservation and Development Facilities. Signed on 2000-05-12. Completion date: 2000-06-19.
$7,775 with Air Force for Maintenance, Repair or Alteration of Real Property -- Ammunition Facilities. Signed on 2004-11-29. Completion date: 2005-01-14.
MOORMAN, KIZER & REITZEL, INC (115 BROADFOOT AVENUE; small business) : $42,367 in 10 contractsfrom 2002 to 2005
Contracts for Architect - Engineer Services (including landscaping, interior layout, and designing), Other Architect and Engineering Services by Army Signed by year:2000: $0; 2001: $0; 2002: $0; 2003: $11,886; 2004: $8,992; 2005: $21,489; 2006: $0.
Biggest contracts:
$21,489 with Army for Architect - Engineer Services (including landscaping, interior layout, and designing). Signed on 2005-04-14. Completion date: 2005-05-11.
$7,783 with Army for Other Architect and Engineering Services. Signed on 2003-09-13. Completion date: 2003-11-15.
$3,186, same as above.Signed on 2004-07-16. Completion date: 2004-08-04.
$2,500, same as above.Signed on 2004-09-09. Completion date: 2004-09-29.
HILLTOP HOUSE RESTAURANT (1240 FORT BRAGG RD; small business)
$34,400 with Department of Defense for Food Services. Signed on 2003-02-04. Completion date: 2003-02-12.
THOMPSON & LITTLE INC (933 ROBESON ST; small business) : $23,595 in 2 contractsfrom 2004 to 2005
$15,696 with Army for Food Cooking, Baking, and Serving Equipment. Signed on 2004-09-08. Completion date: 2004-09-23.
$7,899 with Army for Food Products Machinery and Equipment. Signed on 2005-07-24. Completion date: 2005-08-19.
TREC ENTERPRISES, INC (1327 ROBESON ST; small business) : $8,889 in 2 contractsfrom 2004 to 2005
$4,664 with Army for Printing, Duplicating, and Bookbinding Equipment. Signed on 2005-09-29. Completion date: 2005-10-28.
$4,225 with Army for Miscellaneous Printed Matter. Signed on 2004-07-09. Completion date: 2004-07-28.
Top industries in this zip code by the number of employees in 2005:
Administrative and Support and Waste Management and Remediation Services: Temporary Help Services (500-999 employees: 1 establishment, 1-4 employees: 1 establishment)
Educational Services: Other Technical and Trade Schools (500-999: 1)
Other Services (except Public Administration): Religious Organizations (100-249: 1, 50-99: 1, 20-49: 1, 5-9: 3, 1-4: 1)
Health Care and Social Assistance: Home Health Care Services (100-249: 1, 10-19: 1)
Administrative and Support and Waste Management and Remediation Services: Security Guards and Patrol Services (100-249: 1, 5-9: 1)
Administrative and Support and Waste Management and Remediation Services: Employment Placement Agencies (100-249: 1, 1-4: 2)
Health Care and Social Assistance: Offices of Dentists (10-19: 6, 5-9: 3)
Health Care and Social Assistance: Offices of Physicians (except Mental Health Specialists) (20-49: 1, 10-19: 3, 5-9: 4, 1-4: 2)
Health Care and Social Assistance: Services for the Elderly and Persons with Disabilities (50-99: 1, 20-49: 1, 1-4: 1)
People in group quarters in 2010:
11 people in emergency and transitional shelters (with sleeping facilities) for people experiencing homelessness
6 people in group homes intended for adults
4 people in residential treatment centers for adults
People in group quarters in 2000:
7 people in homes for the mentally ill
6 people in other noninstitutional group quarters
5 people in other nonhousehold living situations
Fatal accident statistics in 2014:
Fatal accident count: 2
Vehicles involved in fatal accidents: 3
Fatal accidents caused by drunken drivers: 1
Fatalities: 2
Persons involved in fatal accidents: 4
Pedestrians involved in fatal accidents: 0
Fatal accident statistics in 2012:
Fatal accident count: 1
Vehicles involved in fatal accidents: 1
Fatal accidents caused by drunken drivers: 0
Fatalities: 1
Persons involved in fatal accidents: 1
Pedestrians involved in fatal accidents: 0
Home Mortgage Disclosure Act Aggregated Statistics For Year 2009 (Based on 6 partial tracts)
A) FHA, FSA/RHS & VA Home Purchase Loans
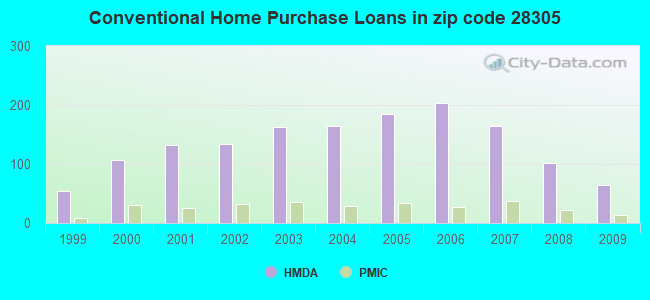
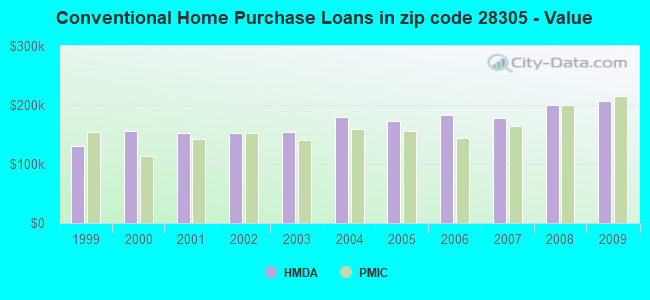
B) Conventional Home Purchase Loans
C) Refinancings
D) Home Improvement Loans
E) Loans on Dwellings For 5+ Families
F) Non-occupant Loans on < 5 Family Dwellings (A B C & D)
Number
Average Value
Number
Average Value
Number
Average Value
Number
Average Value
Number
Average Value
Number
Average Value
LOANS ORIGINATED
46
$216,929
64
$206,701
282
$217,652
13
$89,713
0
$0
26
$112,120
APPLICATIONS APPROVED, NOT ACCEPTED
2
$182,610
4
$271,462
19
$219,899
2
$156,340
0
$0
2
$29,300
APPLICATIONS DENIED
3
$118,350
9
$155,589
52
$200,314
9
$101,013
1
$111,900
6
$87,352
APPLICATIONS WITHDRAWN
8
$188,640
7
$221,339
48
$234,845
1
$114,930
0
$0
4
$178,110
FILES CLOSED FOR INCOMPLETENESS
1
$34,740
2
$247,300
23
$246,234
0
$0
0
$0
1
$97,400
Aggregated Statistics For Year 2008 (Based on 6 partial tracts)
A) FHA, FSA/RHS & VA Home Purchase Loans
B) Conventional Home Purchase Loans
C) Refinancings
D) Home Improvement Loans
E) Loans on Dwellings For 5+ Families
F) Non-occupant Loans on < 5 Family Dwellings (A B C & D)
Number
Average Value
Number
Average Value
Number
Average Value
Number
Average Value
Number
Average Value
Number
Average Value
LOANS ORIGINATED
57
$213,866
102
$199,463
122
$201,539
23
$107,099
2
$1,805,450
50
$150,578
APPLICATIONS APPROVED, NOT ACCEPTED
4
$178,790
8
$220,109
14
$152,446
2
$151,065
0
$0
3
$89,960
APPLICATIONS DENIED
3
$205,447
11
$141,725
42
$197,552
11
$83,208
1
$623,360
9
$63,573
APPLICATIONS WITHDRAWN
9
$207,916
13
$210,205
31
$180,448
1
$8,770
0
$0
6
$110,447
FILES CLOSED FOR INCOMPLETENESS
1
$428,950
1
$409,550
9
$225,369
0
$0
0
$0
0
$0
Aggregated Statistics For Year 2007 (Based on 6 partial tracts)
A) FHA, FSA/RHS & VA Home Purchase Loans
B) Conventional Home Purchase Loans
C) Refinancings
D) Home Improvement Loans
E) Loans on Dwellings For 5+ Families
F) Non-occupant Loans on < 5 Family Dwellings (A B C & D)
G) Loans On Manufactured Home Dwelling (A B C & D)
Number
Average Value
Number
Average Value
Number
Average Value
Number
Average Value
Number
Average Value
Number
Average Value
Number
Average Value
LOANS ORIGINATED
50
$193,939
165
$178,303
132
$175,972
24
$91,792
1
$319,790
51
$109,167
0
$0
APPLICATIONS APPROVED, NOT ACCEPTED
4
$167,195
18
$112,221
35
$206,585
2
$121,970
1
$133,290
15
$85,973
0
$0
APPLICATIONS DENIED
7
$245,881
14
$197,284
77
$199,645
15
$59,337
0
$0
10
$109,862
0
$0
APPLICATIONS WITHDRAWN
4
$176,602
15
$222,923
32
$145,852
1
$26,860
0
$0
4
$115,935
1
$79,080
FILES CLOSED FOR INCOMPLETENESS
0
$0
4
$249,050
10
$145,249
1
$267,850
0
$0
2
$161,545
0
$0
Aggregated Statistics For Year 2006 (Based on 6 partial tracts)
A) FHA, FSA/RHS & VA Home Purchase Loans
B) Conventional Home Purchase Loans
C) Refinancings
D) Home Improvement Loans
E) Loans on Dwellings For 5+ Families
F) Non-occupant Loans on < 5 Family Dwellings (A B C & D)
G) Loans On Manufactured Home Dwelling (A B C & D)
Number
Average Value
Number
Average Value
Number
Average Value
Number
Average Value
Number
Average Value
Number
Average Value
Number
Average Value
LOANS ORIGINATED
50
$197,048
203
$183,728
121
$161,721
24
$84,105
1
$490,900
48
$85,225
0
$0
APPLICATIONS APPROVED, NOT ACCEPTED
2
$184,535
10
$272,702
29
$134,317
3
$67,390
0
$0
4
$210,842
0
$0
APPLICATIONS DENIED
1
$273,780
21
$147,798
52
$151,023
10
$42,149
0
$0
9
$71,678
1
$18,650
APPLICATIONS WITHDRAWN
7
$223,304
22
$199,200
24
$190,177
2
$49,980
0
$0
5
$111,934
0
$0
FILES CLOSED FOR INCOMPLETENESS
1
$47,740
4
$263,072
11
$194,338
1
$361,060
0
$0
0
$0
0
$0
Aggregated Statistics For Year 2005 (Based on 6 partial tracts)
A) FHA, FSA/RHS & VA Home Purchase Loans
B) Conventional Home Purchase Loans
C) Refinancings
D) Home Improvement Loans
E) Loans on Dwellings For 5+ Families
F) Non-occupant Loans on < 5 Family Dwellings (A B C & D)
G) Loans On Manufactured Home Dwelling (A B C & D)
Number
Average Value
Number
Average Value
Number
Average Value
Number
Average Value
Number
Average Value
Number
Average Value
Number
Average Value
LOANS ORIGINATED
31
$184,012
185
$172,664
175
$161,381
19
$90,179
2
$222,070
47
$116,973
1
$20,560
APPLICATIONS APPROVED, NOT ACCEPTED
2
$212,975
18
$138,346
17
$177,743
1
$29,840
0
$0
2
$40,445
0
$0
APPLICATIONS DENIED
0
$0
27
$152,994
62
$143,707
17
$59,755
0
$0
8
$144,459
3
$69,627
APPLICATIONS WITHDRAWN
2
$217,525
21
$214,302
32
$170,160
1
$159,010
1
$423,690
5
$138,928
0
$0
FILES CLOSED FOR INCOMPLETENESS
0
$0
2
$158,785
17
$209,809
0
$0
0
$0
1
$68,630
0
$0
Aggregated Statistics For Year 2004 (Based on 6 partial tracts)
A) FHA, FSA/RHS & VA Home Purchase Loans
B) Conventional Home Purchase Loans
C) Refinancings
D) Home Improvement Loans
E) Loans on Dwellings For 5+ Families
F) Non-occupant Loans on < 5 Family Dwellings (A B C & D)
G) Loans On Manufactured Home Dwelling (A B C & D)
Number
Average Value
Number
Average Value
Number
Average Value
Number
Average Value
Number
Average Value
Number
Average Value
Number
Average Value
LOANS ORIGINATED
37
$145,624
164
$179,635
198
$176,678
16
$80,810
4
$864,020
47
$93,225
1
$26,150
APPLICATIONS APPROVED, NOT ACCEPTED
2
$178,515
17
$203,956
26
$151,299
4
$38,770
0
$0
1
$41,220
1
$15,580
APPLICATIONS DENIED
1
$47,740
22
$174,611
73
$115,110
13
$35,723
0
$0
14
$70,401
3
$83,230
APPLICATIONS WITHDRAWN
4
$148,708
25
$198,452
41
$115,383
2
$28,720
0
$0
9
$75,924
0
$0
FILES CLOSED FOR INCOMPLETENESS
1
$89,330
6
$162,525
12
$196,090
1
$111,900
0
$0
1
$130,550
0
$0
Aggregated Statistics For Year 2003 (Based on 6 partial tracts)
A) FHA, FSA/RHS & VA Home Purchase Loans
B) Conventional Home Purchase Loans
C) Refinancings
D) Home Improvement Loans
E) Loans on Dwellings For 5+ Families
F) Non-occupant Loans on < 5 Family Dwellings (A B C & D)
Number
Average Value
Number
Average Value
Number
Average Value
Number
Average Value
Number
Average Value
Number
Average Value
LOANS ORIGINATED
37
$139,959
162
$153,655
475
$159,309
12
$29,559
1
$131,490
63
$100,930
APPLICATIONS APPROVED, NOT ACCEPTED
1
$202,910
14
$128,931
38
$160,258
3
$35,873
0
$0
6
$82,538
APPLICATIONS DENIED
3
$74,367
39
$120,250
82
$117,379
5
$123,938
0
$0
8
$78,739
APPLICATIONS WITHDRAWN
2
$101,975
18
$155,062
44
$156,625
0
$0
0
$0
5
$69,706
FILES CLOSED FOR INCOMPLETENESS
1
$133,530
5
$286,614
14
$228,651
0
$0
0
$0
6
$96,860
Aggregated Statistics For Year 2002 (Based on 6 partial tracts)
A) FHA, FSA/RHS & VA Home Purchase Loans
B) Conventional Home Purchase Loans
C) Refinancings
D) Home Improvement Loans
F) Non-occupant Loans on < 5 Family Dwellings (A B C & D)
Number
Average Value
Number
Average Value
Number
Average Value
Number
Average Value
Number
Average Value
LOANS ORIGINATED
31
$129,330
134
$152,141
317
$157,269
10
$56,013
47
$100,072
APPLICATIONS APPROVED, NOT ACCEPTED
1
$96,430
20
$113,995
20
$135,801
3
$21,137
1
$25,360
APPLICATIONS DENIED
5
$102,908
47
$61,699
63
$118,443
5
$13,096
7
$59,154
APPLICATIONS WITHDRAWN
5
$132,828
10
$239,539
39
$159,202
1
$32,140
6
$112,985
FILES CLOSED FOR INCOMPLETENESS
2
$105,680
3
$354,720
15
$143,315
1
$149,200
1
$48,920
Aggregated Statistics For Year 2001 (Based on 6 partial tracts)
A) FHA, FSA/RHS & VA Home Purchase Loans
B) Conventional Home Purchase Loans
C) Refinancings
D) Home Improvement Loans
F) Non-occupant Loans on < 5 Family Dwellings (A B C & D)
Number
Average Value
Number
Average Value
Number
Average Value
Number
Average Value
Number
Average Value
LOANS ORIGINATED
41
$119,118
133
$151,894
265
$148,660
15
$25,571
48
$89,668
APPLICATIONS APPROVED, NOT ACCEPTED
0
$0
15
$78,239
18
$90,943
4
$8,765
3
$109,277
APPLICATIONS DENIED
4
$127,008
48
$44,802
47
$91,203
9
$15,093
6
$58,130
APPLICATIONS WITHDRAWN
3
$142,387
17
$110,450
38
$132,890
4
$51,948
4
$133,015
FILES CLOSED FOR INCOMPLETENESS
2
$96,360
5
$152,290
12
$170,714
1
$14,610
4
$69,122
Aggregated Statistics For Year 2000 (Based on 6 partial tracts)
A) FHA, FSA/RHS & VA Home Purchase Loans
B) Conventional Home Purchase Loans
C) Refinancings
D) Home Improvement Loans
E) Loans on Dwellings For 5+ Families
F) Non-occupant Loans on < 5 Family Dwellings (A B C & D)
Number
Average Value
Number
Average Value
Number
Average Value
Number
Average Value
Number
Average Value
Number
Average Value
LOANS ORIGINATED
30
$117,012
107
$156,607
84
$102,076
9
$28,264
1
$2,756,470
20
$78,316
APPLICATIONS APPROVED, NOT ACCEPTED
4
$52,450
10
$72,467
18
$111,499
3
$21,633
0
$0
2
$34,275
APPLICATIONS DENIED
9
$52,756
42
$69,691
50
$77,070
7
$18,971
0
$0
9
$78,740
APPLICATIONS WITHDRAWN
4
$108,858
12
$134,458
21
$123,863
3
$23,623
0
$0
2
$61,910
FILES CLOSED FOR INCOMPLETENESS
1
$71,620
3
$254,133
6
$72,080
1
$15,670
0
$0
2
$84,660
Aggregated Statistics For Year 1999 (Based on 3 partial tracts)
A) FHA, FSA/RHS & VA Home Purchase Loans
B) Conventional Home Purchase Loans
C) Refinancings
D) Home Improvement Loans
E) Loans on Dwellings For 5+ Families
F) Non-occupant Loans on < 5 Family Dwellings (A B C & D)
2002 - 2018 National Fire Incident Reporting System (NFIRS) incidents
Based on the data from the years 2002 - 2018 the average number of fires per year is 33. The highest number of fires - 104 took place in 2006, and the least - 1 in 2008. The data has a decreasing trend.
When looking into fire subcategories, the most reports belonged to: Structure Fires (41.2%), and Outside Fires (36.9%).
Fire incident types reported to NFIRS in Zip Code 28305


 Nearest zip codes: 28301, 28303, 28304, 28306, 28307, 28311.
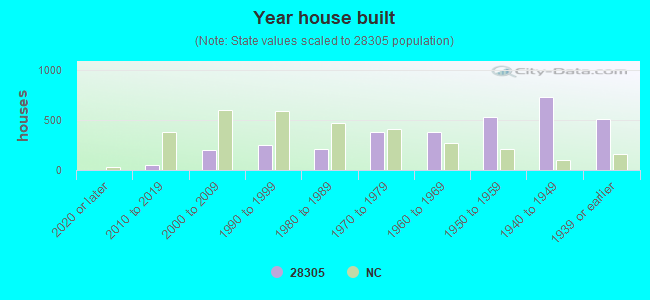


 Based on the data from the years 2002 - 2018 the average number of fires per year is 33. The highest number of fires - 104 took place in 2006, and the least - 1 in 2008. The data has a decreasing trend.
 When looking into fire subcategories, the most reports belonged to: Structure Fires (41.2%), and Outside Fires (36.9%).