Estimated zip code population in 2022: 37,081 Zip code population in 2010: 37,147 Zip code population in 2000: 36,056
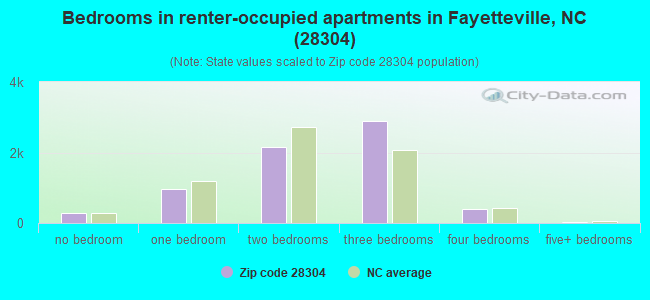
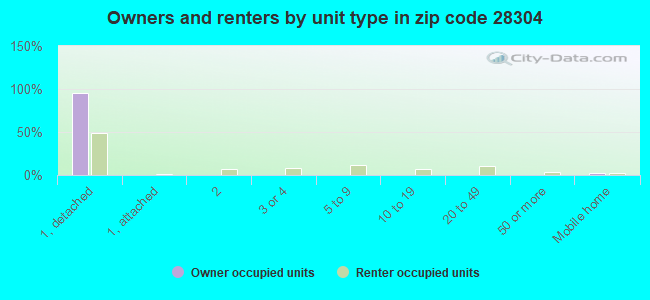
Houses and condos: 16,872 Renter-occupied apartments: 6,746
% of renters here:
44%
State:
33%
March 2022 cost of living index in zip code 28304: 89.1 (less than average, U.S. average is 100)
Land area: 16.5 sq. mi. Water area: 0.2 sq. mi.
Population density: 2,248 people per square mile
(low).
OSM Map
General Map
Google Map
MSN Map
OSM Map
General Map
Google Map
MSN Map
OSM Map
General Map
Google Map
MSN Map
OSM Map
General Map
Google Map
MSN Map
Please wait while loading the map...
Real estate property taxes paid for housing units in 2022:
This zip code:
1.0% ($1,734)
North Carolina:
0.6% ($1,769)
Median real estate property taxes paid for housing units with mortgages in 2022: $1,797 (1.0%) Median real estate property taxes paid for housing units with no mortgage in 2022: $1,597 (1.1%)
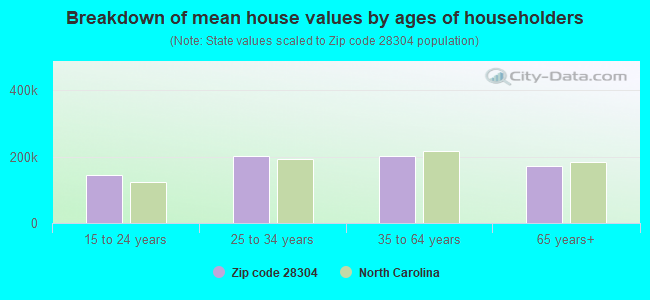
Estimated median house/condo value in 2022: $166,640
28304:
$166,640
North Carolina:
$280,600
According to our research of North Carolina and other state lists, there were 86 registered sex offenders living in 28304 zip code as of April 27, 2024. The ratio of all residents to sex offenders in zip code 28304 is 439 to 1. The ratio of registered sex offenders to all residents in this zip code is near the state average.
Median resident age:
This zip code:
36.0 years
North Carolina median age:
39.2 years
Average household size:
This zip code:
2.4 people
North Carolina:
2.4 people
Averages for the 2020 tax year for zip code 28304, filed in 2021:
Average Adjusted Gross Income (AGI) in 2020: $42,774 (Individual Income Tax Returns)
Here:
$42,774
State:
$70,020
Salary/wage: $36,931 (reported on 82.7% of returns)
Here:
$36,931
State:
$58,387
(% of AGI for various income ranges: 1184.5% for AGIs below $25k, 3575.8% for AGIs $25k-50k, 6465.6% for AGIs $50k-75k, 9725.3% for AGIs $75k-100k, 17553.4% for AGIs $100k-200k, 51766.0% for AGIs over 200k)
Taxable interest for individuals: $935 (reported on 17.6% of returns)
This zip code:
$935
North Carolina:
$1,479
(% of AGI for various income ranges: 6.9% for AGIs below $25k, 7.8% for AGIs $25k-50k, 24.1% for AGIs $50k-75k, 40.6% for AGIs $75k-100k, 112.9% for AGIs $100k-200k, 1558.0% for AGIs over 200k)
Ordinary dividends: $3,021 (reported on 8.8% of returns)
Here:
$3,021
State:
$7,888
(% of AGI for various income ranges: 5.5% for AGIs below $25k, 11.5% for AGIs $25k-50k, 34.0% for AGIs $50k-75k, 69.3% for AGIs $75k-100k, 250.9% for AGIs $100k-200k, 2678.0% for AGIs over 200k)
Net capital gain/loss in AGI: +$12,242 (reported on 7.9% of returns)
Here:
+$12,242
State:
+$23,652
(% of AGI for various income ranges: 4.5% for AGIs below $25k, 8.1% for AGIs $25k-50k, 32.3% for AGIs $50k-75k, 136.6% for AGIs $75k-100k, 640.7% for AGIs $100k-200k, 22550.0% for AGIs over 200k)
Profit/loss from business: +$6,289 (reported on 14.6% of returns)
Here:
+$6,289
State:
+$11,710
(% of AGI for various income ranges: 88.5% for AGIs below $25k, 54.5% for AGIs $25k-50k, 127.4% for AGIs $50k-75k, 219.9% for AGIs $75k-100k, 479.1% for AGIs $100k-200k, 3874.0% for AGIs over 200k)
Taxable individual retirement arrangement distribution: $13,887 (reported on 4.9% of returns)
28304:
$13,887
North Carolina:
$20,247
(% of AGI for various income ranges: 17.8% for AGIs below $25k, 34.8% for AGIs $25k-50k, 103.6% for AGIs $50k-75k, 244.4% for AGIs $75k-100k, 657.2% for AGIs $100k-200k, 4002.0% for AGIs over 200k)
Total itemized deductions: $29,267 (reported on 4.0% of returns)
Here:
$29,267
State:
$34,549
(% of AGI for various income ranges: 16.0% for AGIs below $25k, 59.9% for AGIs $25k-50k, 250.3% for AGIs $50k-75k, 399.3% for AGIs $75k-100k, 1093.3% for AGIs $100k-200k, 6766.0% for AGIs over 200k)
Charity contributions: $12,639 (reported on 3.3% of returns)
Here:
$12,639
State:
$13,360
(% of AGI for various income ranges: 2.3% for AGIs below $25k, 14.6% for AGIs $25k-50k, 78.9% for AGIs $50k-75k, 144.0% for AGIs $75k-100k, 465.0% for AGIs $100k-200k, 3202.0% for AGIs over 200k)
Taxes paid: $6,246 (reported on 3.9% of returns)
28304:
$6,246
State:
$7,586
(% of AGI for various income ranges: 2.2% for AGIs below $25k, 10.5% for AGIs $25k-50k, 48.8% for AGIs $50k-75k, 94.3% for AGIs $75k-100k, 286.7% for AGIs $100k-200k, 1086.0% for AGIs over 200k)
Earned income credit: $2,514 (reported on 27.9% of returns)
Here:
$2,514
State:
$2,337
(% of AGI for various income ranges: 134.9% for AGIs below $25k, 93.9% for AGIs $25k-50k, 1.2% for AGIs $50k-75k)
Percentage of individuals using paid preparers for their 2020 taxes: 93.4%
Here:
93%
State:
93%
(% for various income ranges: 93.4% for AGIs below $25k, 94.0% for AGIs $25k-50k, 93.3% for AGIs $50k-75k, 92.9% for AGIs $75k-100k, 91.7% for AGIs $100k-200k, 88.9% for AGIs over 200k)
Averages for the 2012 tax year for zip code 28304, filed in 2013:
Average Adjusted Gross Income (AGI) in 2012: $39,695 (Individual Income Tax Returns)
Here:
$39,695
State:
$54,937
Salary/wage: $35,181 (reported on 84.2% of returns)
Here:
$35,181
State:
$46,336
(% of AGI for various income ranges: 80.0% for AGIs below $25k, 82.4% for AGIs $25k-50k, 74.6% for AGIs $50k-75k, 71.6% for AGIs $75k-100k, 71.4% for AGIs $100k-200k, 45.8% for AGIs over 200k)
Taxable interest for individuals: $1,016 (reported on 23.4% of returns)
This zip code:
$1,016
North Carolina:
$1,298
(% of AGI for various income ranges: 0.6% for AGIs below $25k, 0.4% for AGIs $25k-50k, 0.5% for AGIs $50k-75k, 0.6% for AGIs $75k-100k, 0.6% for AGIs $100k-200k, 1.6% for AGIs over 200k)
Ordinary dividends: $2,578 (reported on 10.8% of returns)
Here:
$2,578
State:
$6,213
(% of AGI for various income ranges: 0.8% for AGIs below $25k, 0.3% for AGIs $25k-50k, 0.4% for AGIs $50k-75k, 0.7% for AGIs $75k-100k, 1.3% for AGIs $100k-200k, 0.8% for AGIs over 200k)
Net capital gain/loss in AGI: +$2,978 (reported on 7.2% of returns)
Here:
+$2,978
State:
+$12,740
(% of AGI for various income ranges: 0.1% for AGIs $25k-50k, 0.1% for AGIs $50k-75k, 0.3% for AGIs $75k-100k, 1.3% for AGIs $100k-200k, 3.1% for AGIs over 200k)
Profit/loss from business: +$8,090 (reported on 12.6% of returns)
Here:
+$8,090
State:
+$10,311
(% of AGI for various income ranges: 6.4% for AGIs below $25k, 1.4% for AGIs $25k-50k, 1.3% for AGIs $50k-75k, 1.8% for AGIs $75k-100k, 1.3% for AGIs $100k-200k, 7.8% for AGIs over 200k)
Taxable individual retirement arrangement distribution: $9,887 (reported on 6.2% of returns)
28304:
$9,887
North Carolina:
$15,575
(% of AGI for various income ranges: 1.2% for AGIs below $25k, 1.1% for AGIs $25k-50k, 1.4% for AGIs $50k-75k, 2.0% for AGIs $75k-100k, 2.6% for AGIs $100k-200k)
Self-employment retirement plans: $10,733 (reported on 0.2% of returns)
28304:
$10,733
North Carolina:
$21,078
Total itemized deductions: $18,076 (24% of AGI, reported on 25.7% of returns)
Here:
$18,076
State:
$23,438
Here:
24.4% of AGI
State:
21.5% of AGI
(% of AGI for various income ranges: 6.7% for AGIs below $25k, 9.9% for AGIs $25k-50k, 12.3% for AGIs $50k-75k, 13.1% for AGIs $75k-100k, 15.4% for AGIs $100k-200k, 14.0% for AGIs over 200k)
Charity contributions: $4,625 (reported on 20.9% of returns)
Here:
$4,625
State:
$4,687
(% of AGI for various income ranges: 0.9% for AGIs below $25k, 1.9% for AGIs $25k-50k, 2.6% for AGIs $50k-75k, 2.9% for AGIs $75k-100k, 3.7% for AGIs $100k-200k, 2.9% for AGIs over 200k)
Taxes paid: $6,058 (reported on 25.6% of returns)
28304:
$6,058
State:
$8,823
(% of AGI for various income ranges: 1.3% for AGIs below $25k, 2.5% for AGIs $25k-50k, 3.6% for AGIs $50k-75k, 4.6% for AGIs $75k-100k, 6.2% for AGIs $100k-200k, 8.1% for AGIs over 200k)
Earned income credit: $2,485 (reported on 29.3% of returns)
Here:
$2,485
State:
$2,376
(% of AGI for various income ranges: 9.7% for AGIs below $25k, 1.5% for AGIs $25k-50k)
Percentage of individuals using paid preparers for their 2012 taxes: 47.4%
Here:
47%
State:
53%
(% for various income ranges: 44.2% for AGIs below $25k, 46.5% for AGIs $25k-50k, 51.0% for AGIs $50k-75k, 54.0% for AGIs $75k-100k, 58.6% for AGIs $100k-200k, 72.7% for AGIs over 200k)
Averages for the 2004 tax year for zip code 28304, filed in 2005:
Average Adjusted Gross Income (AGI) in 2004: $35,698 (Individual Income Tax Returns)
Here:
$35,698
State:
$45,376
Salary/wage: $32,091 (reported on 87.5% of returns)
Here:
$32,091
State:
$39,442
(% of AGI for various income ranges: 99.6% for AGIs below $10k, 83.4% for AGIs $10k-25k, 82.8% for AGIs $25k-50k, 79.3% for AGIs $50k-75k, 79.6% for AGIs $75k-100k, 66.0% for AGIs over 100k)
Taxable interest for individuals: $936 (reported on 31.8% of returns)
This zip code:
$936
North Carolina:
$1,515
(% of AGI for various income ranges: 2.0% for AGIs below $10k, 0.9% for AGIs $10k-25k, 0.8% for AGIs $25k-50k, 0.7% for AGIs $50k-75k, 0.6% for AGIs $75k-100k, 0.9% for AGIs over 100k)
Taxable dividends: $1,709 (reported on 14.3% of returns)
Here:
$1,709
State:
$4,016
(% of AGI for various income ranges: 1.3% for AGIs below $10k, 0.4% for AGIs $10k-25k, 0.5% for AGIs $25k-50k, 0.6% for AGIs $50k-75k, 0.6% for AGIs $75k-100k, 1.2% for AGIs over 100k)
Net capital gain/loss: +$5,279 (reported on 10.5% of returns)
Here:
+$5,279
State:
+$11,152
(% of AGI for various income ranges: -0.3% for AGIs below $10k, 0.1% for AGIs $10k-25k, 0.1% for AGIs $25k-50k, 0.6% for AGIs $50k-75k, 0.8% for AGIs $75k-100k, 6.2% for AGIs over 100k)
Profit/loss from business: +$7,133 (reported on 11.8% of returns)
Here:
+$7,133
State:
+$9,490
(% of AGI for various income ranges: 0.5% for AGIs below $10k, 2.5% for AGIs $10k-25k, 1.3% for AGIs $25k-50k, 1.8% for AGIs $50k-75k, 2.0% for AGIs $75k-100k, 4.7% for AGIs over 100k)
IRA payment deduction: $2,502 (reported on 2.1% of returns)
28304:
$2,502
North Carolina:
$2,967
(% of AGI for various income ranges: 0.1% for AGIs below $10k, 0.1% for AGIs $10k-25k, 0.2% for AGIs $25k-50k, 0.2% for AGIs $50k-75k, 0.1% for AGIs $75k-100k, 0.1% for AGIs over 100k)
Self-employed pension: $12,333 (reported on 0.3% of returns)
Here:
$12,333
North Carolina:
$14,754
Total itemized deductions: $15,920 (24% of AGI, reported on 29.6% of returns)
Here:
$15,920
State:
$19,464
Here:
24.2% of AGI
State:
22.7% of AGI
(% of AGI for various income ranges: 9.0% for AGIs below $10k, 7.2% for AGIs $10k-25k, 11.8% for AGIs $25k-50k, 15.5% for AGIs $50k-75k, 16.7% for AGIs $75k-100k, 15.2% for AGIs over 100k)
Charity contributions deductions: $3,667 (5% of AGI, reported on 26.7% of returns)
Here:
$3,667
State:
$4,035
Here:
5.4% of AGI
State:
4.5% of AGI
(% of AGI for various income ranges: 0.9% for AGIs below $10k, 1.1% for AGIs $10k-25k, 2.4% for AGIs $25k-50k, 3.2% for AGIs $50k-75k, 3.4% for AGIs $75k-100k, 3.7% for AGIs over 100k)
Total tax: $4,652 (reported on 66.8% of returns)
28304:
$4,652
State:
$7,257
(% of AGI for various income ranges: 2.0% for AGIs below $10k, 2.9% for AGIs $10k-25k, 5.7% for AGIs $25k-50k, 8.3% for AGIs $50k-75k, 10.2% for AGIs $75k-100k, 17.1% for AGIs over 100k)
Earned income credit: $1,936 (reported on 26.1% of returns)
Here:
$1,936
State:
$1,851
Percentage of individuals using paid preparers for their 2004 taxes: 62.3%
Here:
62%
State:
62%
(% for various income ranges: 57.4% for AGIs below $10k, 65.6% for AGIs $10k-25k, 62.3% for AGIs $25k-50k, 61.5% for AGIs $50k-75k, 59.0% for AGIs $75k-100k, 67.8% for AGIs over 100k)
Likely homosexual households (counted as self-reported same-sex unmarried-partner households)
Lesbian couples: 0.2% of all households
Gay men: 0.1% of all households
Household received Food Stamps/SNAP in the past 12 months: 3,325 Household did not receive Food Stamps/SNAP in the past 12 months: 12,022
Women who had a birth in the past 12 months: 394 (284 now married, 111 unmarried) Women who did not have a birth in the past 12 months: 8,404 (3,162 now married, 5,232 unmarried)
Housing units in zip code 28304 with a mortgage: 5,392 (531 second mortgage, 26 home equity loan, 386 both second mortgage and home equity loan) Houses without a mortgage: 84
Median monthly owner costs for units with a mortgage: $1,198 Median monthly owner costs for units without a mortgage: $494
Residents with income below the poverty level in 2022:
This zip code:
16.9%
Whole state:
12.8%
Residents with income below 50% of the poverty level in 2022:
This zip code:
9.3%
Whole state:
6.8%
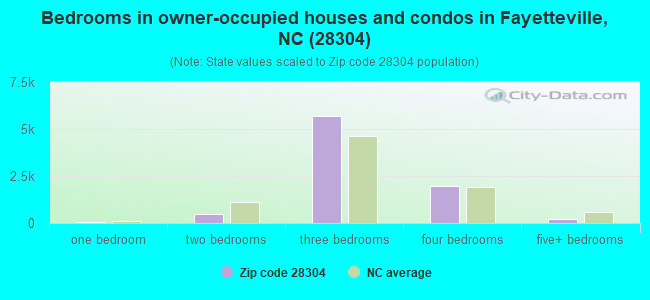
Median number of rooms in houses and condos:
Here:
6.4
State:
6.4
Median number of rooms in apartments:
Here:
4.8
State:
4.4
Notable locations in this zip code not listed on our city pages
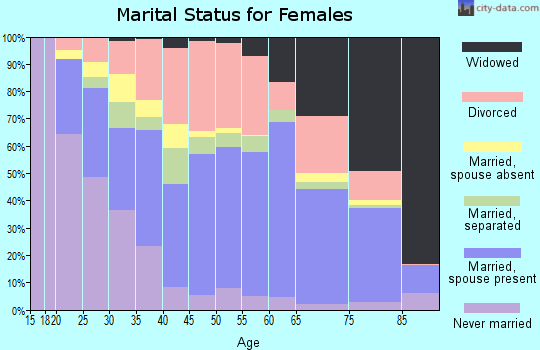
4,115 married couples with children.
2,985 single-parent households (475 men, 2,510 women).
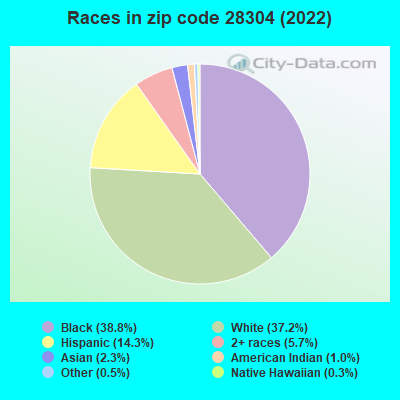
85.0% of residents of 28304 zip code speak English at home.
10.6% of residents speak Spanish at home (71% very well, 16% well, 11% not well, 2% not at all).
1.8% of residents speak other Indo-European language at home (65% very well, 34% well, 1% not at all).
1.9% of residents speak Asian or Pacific Island language at home (64% very well, 31% well, 5% not well).
0.9% of residents speak other language at home (83% very well, 17% well).
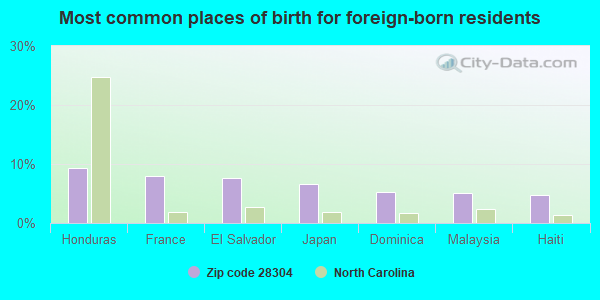
Foreign born population: 3,105 (8.4%) (48.9% of them are naturalized citizens)
Facilities with environmental interests located in this zip code:
CAPE FEAR VALLEY MEDICAL CENTER (1638 OWEN DRIVE in FAYETTEVILLE, NC)
AIR SYNTHETIC MINOR (AIRS/AFS) STATE MASTER (North Carolina facility info) - UNDERGROUND STORAGE TANK PROGRAM STATE MASTER (North Carolina facility info) - AIR PROGRAM COMPLIANCE ACTIVITY (Tracking inspections of insecticide, fungicide, and rodenticide, and toxic substances) CRITERIA AND HAZARDOUS AIR POLLUTANT INVENTORY (Inventory of air pollution sources) Small Quantity Generators, between 100 kg and 1000 kg of hazardous waste/month (Resource Conservation and Recovery Act (tracking hazardous waste)) - notification Business SIC classification: GENERAL MEDICAL AND SURGICAL HOSPITALS; NONCLASSIFIABLE ESTABLISHMENTS Organizations: CUMBERLAND CO HOSP SYS INC (CONTACT/OWNER)
Alternative names: CAPE FEAR VALLEY MED CENTER
BRYAN PONTIAC CADILLAC HONDA (4104 RAEFORD RD in FAYETTEVILLE, NC)
STATE MASTER (North Carolina facility info) - UNDERGROUND STORAGE TANK PROGRAM Small Quantity Generators, between 100 kg and 1000 kg of hazardous waste/month (Resource Conservation and Recovery Act (tracking hazardous waste)) - notification Business SIC classification: NONCLASSIFIABLE ESTABLISHMENTS Organizations: N.E. & D.C. BRYAN (CONTACT/OWNER)
BRENTWOOD ELEMENTARY (1115 BINGHAM DRIVE in FAYETTEVILLE, NC)
STATE MASTER (North Carolina facility info) - UNDERGROUND STORAGE TANK PROGRAM (National Center for Education Statistics) - STATE ID-320 Business SIC classification: NONCLASSIFIABLE ESTABLISHMENTS Organizations: CUMBERLAND COUNTY SCHOOLS (SCHOOL DISTRICT)
CLIFFDALE CLEANERS (5791 CLIFFDALE ROAD in FAYETTEVILLE, NC)
AIR MINOR (AIRS/AFS) STATE MASTER (North Carolina facility info) - AIR PROGRAM Conditionally Exempt Small Quantity Generators, less than 100 kg/month of hazardous waste (Resource Conservation and Recovery Act (tracking hazardous waste)) - notification Business SIC classification: DRYCLEANING PLANTS, EXCEPT RUG CLEANING Organizations: ABLE DRYCLEANING CORP (CONTACT/OWNER)
DOUGLAS BYRD JUNIOR HIGH SCHOOL (1616 IRELAND DRIVE in FAYETTEVILLE, NC)
(Geographic Names Information System) (National Center for Education Statistics) - STATE ID-321 Organizations: CUMBERLAND COUNTY SCHOOLS (SCHOOL DISTRICT)
Alternative names: DOUGLAS BYRD MIDDLE
DOUGLAS BYRD SENIOR HIGH SCHOOL (1624 IRELAND DRIVE in FAYETTEVILLE, NC)
(Geographic Names Information System) (National Center for Education Statistics) - STATE ID-322 Organizations: CUMBERLAND COUNTY SCHOOLS (SCHOOL DISTRICT)
Alternative names: DOUGLAS BYRD HIGH
ASHLEY ELEMENTARY (810 TRAINER DRIVE in FAYETTEVILLE, NC)
(National Center for Education Statistics) - STATE ID-308 Organizations: CUMBERLAND COUNTY SCHOOLS (SCHOOL DISTRICT)
AAC CONTRACTING INC DIPPING STA (6371 APPLECROSS DR in FAYETTEVILLE, NC)
HAZARDOUS WASTE BIENNIAL REPORTER (Resource Conservation and Recovery Act (tracking hazardous waste)) (Resource Conservation and Recovery Act (tracking hazardous waste)) Alternative names: AAC CONTRACTING INCORPORATED
Housing units lacking complete plumbing facilities: 1.3% Housing units lacking complete kitchen facilities: 0.8%
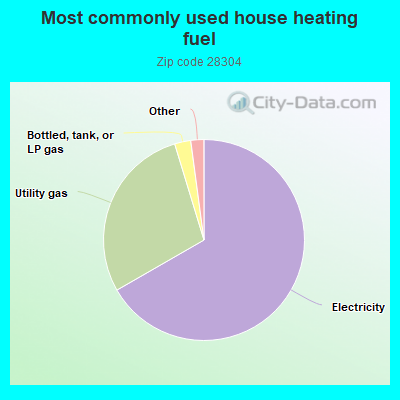
66.7%Electricity
28.6%Utility gas
2.6%Bottled, tank, or LP gas
0.9%Fuel oil, kerosene, etc.
0.6%No fuel used
Population in 1990: 33,868. Population change in the 1990s: +2,188 (+6.5%).
Place of birth for U.S.-born residents:
This state: 15,906
Northeast: 4,331
Midwest: 2,287
South: 6,695
West: 2,601
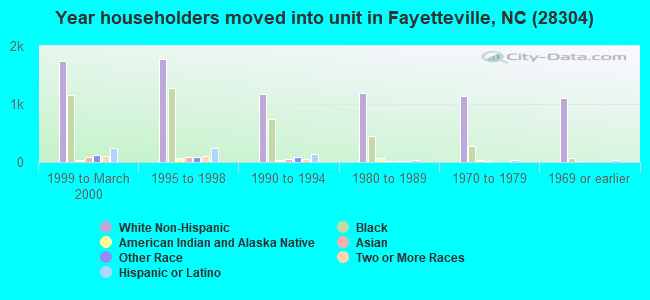
52% of the 28304 zip code residents lived in the same house 5 years ago. Out of people who lived in different houses, 46% lived in this county. Out of people who lived in different counties, 50% lived in North Carolina.
84% of the 28304 zip code residents lived in the same house 1 year ago. Out of people who lived in different houses, 42% moved from this county. Out of people who lived in different houses, 15% moved from different county within same state. Out of people who lived in different houses, 31% moved from different state. Out of people who lived in different houses, 9% moved from abroad.
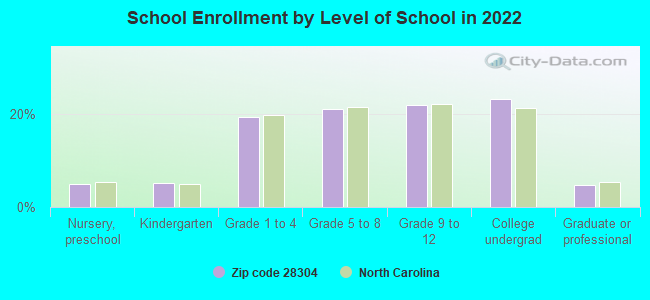
Private vs. public school enrollment:
Students in private schools in grades 1 to 8 (elementary and middle school): 389
Here:
10.8%
North Carolina:
13.8%
Students in private schools in grades 9 to 12 (high school): 194
Here:
9.8%
North Carolina:
11.9%
Students in private undergraduate colleges: 356
Here:
17.0%
North Carolina:
19.3%
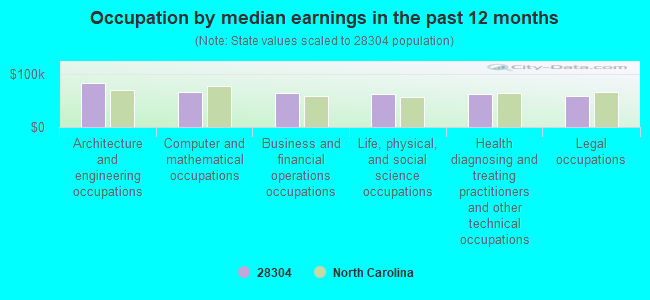
Occupation by median earnings in the past 12 months ($)
82,546Architecture and engineering occupations
64,898Computer and mathematical occupations
64,164Business and financial operations occupations
61,655Life, physical, and social science occupations
61,275Health diagnosing and treating practitioners and other technical occupations
57,270Legal occupations
Companies with biggest federal contracts located in this zip code (FAYETTEVILLE, NC):
STOUT PROPERTIES INC (1707 OWEN DRIVE) : $10,396,711 in 84 contractsfrom 2001 to 2006
Contracts for Lodging - Hotel/Motel, Lease or Rental of Facilities -- Conference Space and Facilities by Army Signed by year:2000: $0; 2001: $1,683,738; 2002: $1,490,449; 2003: $4,288,894; 2004: $1,603,588; 2005: $1,202,730; 2006: $127,312.
Biggest contracts:
$1,354,627 with Army for Lodging - Hotel/Motel. Signed on 2003-08-01. Completion date: 2003-11-30.
$1,135,462, same as above.Signed on 2004-11-15. Completion date: 2004-10-01.
$1,010,419, same as above.Signed on 2003-12-10. Completion date: 2004-02-29.
$1,010,419, same as above.Signed on 2004-03-04. Completion date: 2004-05-31.
TRIANGLE COMMUNICATIONS (1211 IRELAND DRIVE; small business) 50 employees, $0 revenue. : $341,262 in 29 contractsfrom 2000 to 2006
Contracts for Maintenance, Repair and Rebuilding of Equipment -- Communication, Detection, and Coherent Radiation Equipment, Radio and Television Communication Equipment, Except Airborne, Communications Security Equipment and Components, Maintenance, Repair and Rebuilding of Equipment -- Miscellaneous, and moreby Army, Navy, National Oceanic and Atmospheric Administration/Under Secretary for Oceans and Atmosphere Signed by year:2000: $30,240; 2001: $0; 2002: $119,693; 2003: $98,107; 2004: $74,082; 2005: $4,800; 2006: $14,340.
Biggest contracts:
$49,560 with Army for Maintenance, Repair and Rebuilding of Equipment -- Communication, Detection, and Coherent Radiation Equipment. Signed on 2003-10-14. Completion date: 2004-09-30.
$49,560 with Army for Maintenance, Repair and Rebuilding of Equipment -- Communication, Detection, and Coherent Radiation Equipment. Taking place in SC. Signed on 2004-01-08. Completion date: 2004-09-30.
$35,554 with Navy for Radio and Television Communication Equipment, Except Airborne. Taking place in MD. Signed on 2002-06-26. Completion date: 2002-07-18.
$30,240 with Army for Maintenance, Repair and Rebuilding of Equipment -- Communication, Detection, and Coherent Radiation Equipment. Taking place in SC. Signed on 2002-01-23. Completion date: 2002-09-30.
CASTEN ENTERPRISES, INC (6216 MCDOUGAL DRIVE; small business) : $292,575 in 9 contractsfrom 1999 to 2001
Contracts for Construction of Structures and Facilities -- Conference Space and Facilities, Maintenance, Repair or Alteration of Real Property -- Office Buildings, Maintenance, Repair or Alteration of Real Property -- Other Residential Buildings, Maintenance, Repair or Alteration of Real Property -- Other Administrative Facilities and Service Buildings, and moreby Army Signed by year:2000: $91,255; 2001: $97,656; 2002: $0; 2003: $0; 2004: $0; 2005: $0; 2006: $0.
Biggest contracts:
$95,737 with Army for Construction of Structures and Facilities -- Conference Space and Facilities. Signed on 1999-11-17. Completion date: 2000-02-16.
$89,400 with Army for Maintenance, Repair or Alteration of Real Property -- Office Buildings. Signed on 2001-04-03. Completion date: 2001-07-31.
$69,850 with Army for Maintenance, Repair or Alteration of Real Property -- Other Residential Buildings. Signed on 2000-02-07. Completion date: 2000-02-29.
$12,165 with Army for Maintenance, Repair or Alteration of Real Property -- Other Administrative Facilities and Service Buildings. Signed on 2000-01-12. Completion date: 2000-04-03.
CARPET ONE COMMERCIAL DIVISION (4101 RAEFORD ROAD, SUITE 2; small business) : $194,993 in 15 contractsfrom 2003 to 2006
Contracts for Maintenance, Repair or Alteration of Real Property -- Miscellaneous Buildings, Maintenance, Repair or Alteration of Real Property -- Office Buildings, Carpet Laying and Cleaning, Floor Coverings, and moreby Army, Air Force, Bureau of Prisoners/Federal Prison System, Department of Veterans Affairs, and others Signed by year:2000: $0; 2001: $0; 2002: $0; 2003: $53,962; 2004: $16,106; 2005: $114,020; 2006: $10,905.
Biggest contracts:
$86,393 with Army for Maintenance, Repair or Alteration of Real Property -- Miscellaneous Buildings. Signed on 2005-09-22. Completion date: 2005-08-22.
$17,800 with Air Force for Maintenance, Repair or Alteration of Real Property -- Office Buildings. Signed on 2003-12-19. Completion date: 2004-01-30.
$13,997 with Army for Carpet Laying and Cleaning. Signed on 2005-06-03. Completion date: 2005-06-24.
$13,630 with Bureau of Prisoners/Federal Prison System for Floor Coverings. Taking place in IN. Signed on 2005-02-02. Completion date: 2005-02-28.
ACE PLUMBING OF FAYETTEVILLE (5686 BEAR CREEK CIRCLE; small business) : $186,673 in 21 contractsfrom 2000 to 2005
Contracts for Maintenance, Repair or Alteration of Real Property -- Miscellaneous Buildings, Plumbing Fixtures and Accessories, Maintenance, Repair or Alteration of Real Property -- Sewage and Waste Facilities, Maintenance, Repair or Alteration of Real Property -- Office Buildings, and moreby Army Signed by year:2000: $6,430; 2001: $4,820; 2002: $72,685; 2003: $16,553; 2004: $53,880; 2005: $32,305; 2006: $0.
Biggest contracts:
$45,000 with Army for Maintenance, Repair or Alteration of Real Property -- Miscellaneous Buildings. Signed on 2002-09-28. Completion date: 2002-10-31.
$12,748, same as above.Signed on 2004-03-31. Completion date: 2004-03-31.
$12,435 with Army for Plumbing Fixtures and Accessories. Signed on 2004-03-25. Completion date: 2004-04-02.
$11,400 with Army for Maintenance, Repair or Alteration of Real Property -- Miscellaneous Buildings. Signed on 2005-08-09. Completion date: 2005-08-18.
SANCO CONSTRUCTION COMPANY, IN (1803 STOCKTON DRIVE; small business) : $133,567 in 10 contractsfrom 2000 to 2003
Contracts for Facilities Operations Support Services, Maintenance, Repair or Alteration of Real Property -- Other Non-Building Facilities, Maintenance, Repair or Alteration of Real Property -- Parking Facilities Conservation, Mineral Construction Materials, Bulk, and moreby Department of Defense, Army Signed by year:2000: $44,848; 2001: $60,340; 2002: $13,080; 2003: $15,299; 2004: $0; 2005: $0; 2006: $0.
Biggest contracts:
$48,840 with Department of Defense for Facilities Operations Support Services. Signed on 2001-10-22. Completion date: 2001-11-21.
$35,548 with Army for Maintenance, Repair or Alteration of Real Property -- Other Non-Building Facilities. Signed on 2000-01-07. Completion date: 2000-02-22.
$11,500 with Army for Maintenance, Repair or Alteration of Real Property -- Parking Facilities Conservation. Signed on 2001-09-25. Completion date: 2001-10-28.
$8,800, same as above.Signed on 2003-08-29. Completion date: 2003-09-03.
STERLING GROUP LLC (2118 CLINCHFIELD DR; small business) : $110,864 in 3 contractsfrom 2004 to 2005
$94,004 with Army for Video Recording and Reproducing Equipment. Signed on 2005-09-29. Completion date: 2005-10-31.
$8,880 with Air Force for Other Professional Services. Taking place in CO. Signed on 2004-09-15. Completion date: 2004-10-15.
$7,980 with Department of Defense for General Photographic Services - Still. Signed on 2005-01-07. Completion date: 2005-01-18.
AYALAS CONSTRUCTION (2019 BLACKFRIARS RD; small business) : $91,183 in 10 contractsfrom 2000 to 2004
Contracts for Maintenance, Repair or Alteration of Real Property -- Office Buildings, Maintenance, Repair or Alteration of Real Property -- Other Residential Buildings, Maintenance, Repair or Alteration of Real Property -- Miscellaneous Buildings, Maintenance, Repair or Alteration of Real Property -- Other Administrative Facilities and Service Buildings by Air Force Signed by year:2000: $17,725; 2001: $44,408; 2002: $22,550; 2003: $0; 2004: $6,500; 2005: $0; 2006: $0.
Biggest contracts:
$13,800 with Air Force for Maintenance, Repair or Alteration of Real Property -- Office Buildings. Signed on 2002-02-12. Completion date: 2002-03-20.
$13,750 with Air Force for Maintenance, Repair or Alteration of Real Property -- Other Residential Buildings. Signed on 2000-09-28. Completion date: 2000-11-03.
$12,570 with Air Force for Maintenance, Repair or Alteration of Real Property -- Miscellaneous Buildings. Signed on 2001-09-26. Completion date: 2001-11-05.
$11,288 with Air Force for Maintenance, Repair or Alteration of Real Property -- Other Administrative Facilities and Service Buildings. Signed on 2001-07-05. Completion date: 2001-07-17.
M & W MAINTENANCE SERVICES (5111 PONDEROSA DRIVE; small business) : $66,516 in 5 contractsfrom 2002 to 2005
Contracts for Operation of Government-Owned Facilities -- Other Administrative Facilities and Service Buildings, Paper Shredding Services by Army Signed by year:2000: $0; 2001: $0; 2002: $23,832; 2003: -$256; 2004: $0; 2005: $42,940; 2006: $0.
Biggest contracts:
$42,790 with Army for Operation of Government-Owned Facilities -- Other Administrative Facilities and Service Buildings. Signed on 2005-11-07. Completion date: 2004-09-30.
$23,832 with Army for Paper Shredding Services. Signed on 2002-12-12. Completion date: 2003-09-30.
$150 with Army for Operation of Government-Owned Facilities -- Other Administrative Facilities and Service Buildings. Signed on 2005-09-13. Completion date: 2004-09-30.
$0, same as above.Signed on 2005-11-07. Completion date: 2004-09-30.
NETWORK NAVIGATION (1511 DARVEL AVE; small business) : $66,353 in 3 contractsfrom 2003 to 2005
$36,903 with Air Force for Maintenance, Repair or Alteration of Real Property -- Electronic and Communications Facilities. Signed on 2005-07-19. Completion date: 2005-07-30.
$24,900 with Army for Maintenance, Repair or Alteration of Real Property -- Sewage and Waste Facilities. Signed on 2003-09-27. Completion date: 2003-10-20.
$4,550, same as above.Signed on 2003-11-13. Completion date: 2003-10-20.
Top industries in this zip code by the number of employees in 2005:
Health Care and Social Assistance: Offices of Physicians (except Mental Health Specialists) (50-99 employees: 3 establishments, 20-49 employees: 17 establishments, 10-19 employees: 16 establishments, 5-9 employees: 34 establishments, 1-4 employees: 35 establishments)
2002 - 2018 National Fire Incident Reporting System (NFIRS) incidents
According to the data from the years 2002 - 2018 the average number of fires per year is 175. The highest number of reported fires - 385 took place in 2005, and the least - 26 in 2008. The data has a decreasing trend.
When looking into fire subcategories, the most incidents belonged to: Structure Fires (50.8%), and Outside Fires (34.8%).
Fire incident types reported to NFIRS in Zip Code 28304

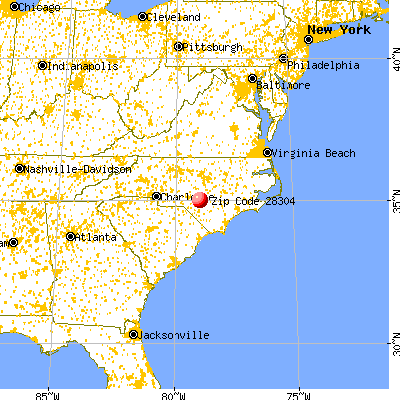


 Nearest zip codes: 28314, 28303, 28305, 28307, 28306, 28301.
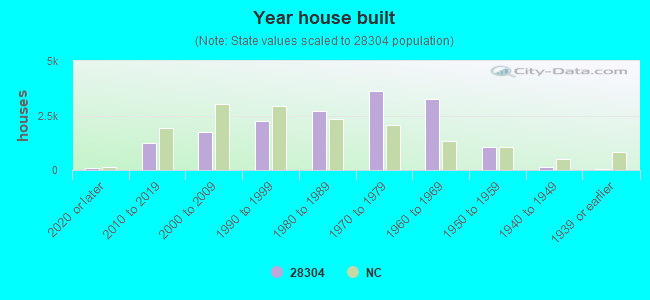


 According to the data from the years 2002 - 2018 the average number of fires per year is 175. The highest number of reported fires - 385 took place in 2005, and the least - 26 in 2008. The data has a decreasing trend.
 When looking into fire subcategories, the most incidents belonged to: Structure Fires (50.8%), and Outside Fires (34.8%).