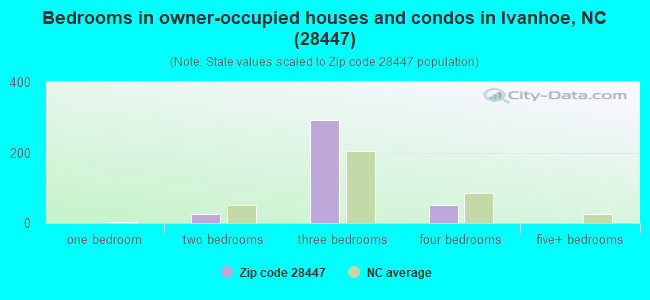
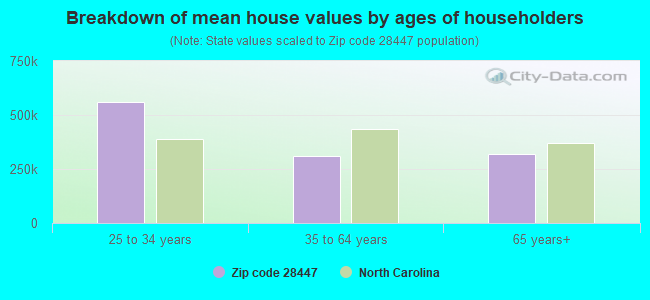
Estimated median house/condo value in 2022: $180,855
28447:
$180,855
North Carolina:
$280,600
According to our research of North Carolina and other state lists, there were 3 registered sex offenders living in 28447 zip code as of April 25, 2024. The ratio of all residents to sex offenders in zip code 28447 is 557 to 1. The ratio of registered sex offenders to all residents in this zip code is near the state average.
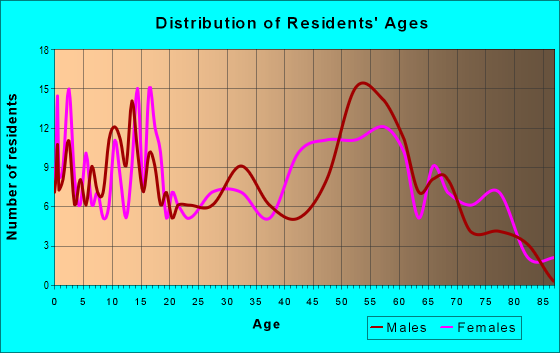
Median resident age:
This zip code:
52.8 years
North Carolina median age:
39.2 years
Average household size:
This zip code:
3.3 people
North Carolina:
2.4 people
Averages for the 2020 tax year for zip code 28447, filed in 2021:
Average Adjusted Gross Income (AGI) in 2020: $44,038 (Individual Income Tax Returns)
Here:
$44,038
State:
$70,020
Salary/wage: $32,358 (reported on 86.2% of returns)
Here:
$32,358
State:
$58,387
(% of AGI for various income ranges: 1753.6% for AGIs below $25k, 4503.6% for AGIs $25k-50k, 7530.0% for AGIs $50k-75k, 6713.3% for AGIs $75k-100k)
Taxable interest for individuals: $989 (reported on 15.5% of returns)
This zip code:
$989
North Carolina:
$1,479
(% of AGI for various income ranges: 10.0% for AGIs $25k-50k, 42.5% for AGIs $50k-75k)
Ordinary dividends: $6,750 (reported on 6.9% of returns)
Here:
$6,750
State:
$7,888
(% of AGI for various income ranges: 675.0% for AGIs $50k-75k)
Net capital gain/loss in AGI: +$11,567 (reported on 5.2% of returns)
Here:
+$11,567
State:
+$23,652
(% of AGI for various income ranges: 867.5% for AGIs $50k-75k)
Profit/loss from business: +$1,675 (reported on 13.8% of returns)
Here:
+$1,675
State:
+$11,710
(% of AGI for various income ranges: 190.0% for AGIs below $25k)
Taxable individual retirement arrangement distribution: $6,900 (reported on 3.4% of returns)
28447:
$6,900
North Carolina:
$20,247
(% of AGI for various income ranges: 98.6% for AGIs below $25k)
Earned income credit: $1,853 (reported on 25.9% of returns)
Here:
$1,853
State:
$2,337
(% of AGI for various income ranges: 134.3% for AGIs below $25k, 81.8% for AGIs $25k-50k)
Percentage of individuals using paid preparers for their 2020 taxes: 89.7%
Here:
90%
State:
93%
(% for various income ranges: 89.3% for AGIs below $25k, 87.5% for AGIs $25k-50k, 85.7% for AGIs $50k-75k, 100.0% for AGIs $75k-100k, 100.0% for AGIs $100k-200k)
Averages for the 2012 tax year for zip code 28447, filed in 2013:
Average Adjusted Gross Income (AGI) in 2012: $45,466 (Individual Income Tax Returns)
Here:
$45,466
State:
$54,937
Salary/wage: $29,648 (reported on 93.5% of returns)
Here:
$29,648
State:
$46,336
(% of AGI for various income ranges: 85.5% for AGIs below $25k, 90.8% for AGIs $25k-50k, 74.7% for AGIs $50k-75k, 67.3% for AGIs $75k-100k, 23.7% for AGIs $100k-200k)
Taxable interest for individuals: $591 (reported on 17.7% of returns)
This zip code:
$591
North Carolina:
$1,298
(% of AGI for various income ranges: 0.1% for AGIs $25k-50k, 0.7% for AGIs $75k-100k, 0.3% for AGIs $100k-200k)
Ordinary dividends: $4,533 (reported on 4.8% of returns)
Here:
$4,533
State:
$6,213
Net capital gain/loss in AGI: +$1,267 (reported on 4.8% of returns)
Here:
+$1,267
State:
+$12,740
Profit/loss from business: +$4,133 (reported on 9.7% of returns)
Here:
+$4,133
State:
+$10,311
Taxable individual retirement arrangement distribution: $5,133 (reported on 4.8% of returns)
28447:
$5,133
North Carolina:
$15,575
Total itemized deductions: $25,831 (22% of AGI, reported on 21.0% of returns)
Here:
$25,831
State:
$23,438
Here:
22.1% of AGI
State:
21.5% of AGI
(% of AGI for various income ranges: 5.3% for AGIs below $25k, 7.0% for AGIs $25k-50k, 15.0% for AGIs $50k-75k, 15.7% for AGIs $75k-100k, 16.3% for AGIs $100k-200k)
Charity contributions: $6,718 (reported on 17.7% of returns)
Here:
$6,718
State:
$4,687
(% of AGI for various income ranges: 1.8% for AGIs $25k-50k, 2.5% for AGIs $50k-75k, 4.5% for AGIs $75k-100k, 3.8% for AGIs $100k-200k)
Taxes paid: $9,723 (reported on 21.0% of returns)
28447:
$9,723
State:
$8,823
(% of AGI for various income ranges: 1.3% for AGIs below $25k, 1.2% for AGIs $25k-50k, 3.8% for AGIs $50k-75k, 5.6% for AGIs $75k-100k, 8.1% for AGIs $100k-200k)
Earned income credit: $2,229 (reported on 22.6% of returns)
Here:
$2,229
State:
$2,376
(% of AGI for various income ranges: 5.5% for AGIs below $25k, 0.9% for AGIs $25k-50k)
Percentage of individuals using paid preparers for their 2012 taxes: 54.8%
Here:
55%
State:
53%
(% for various income ranges: 50.0% for AGIs below $25k, 52.2% for AGIs $25k-50k, 100.0% for AGIs $50k-75k, 100.0% for AGIs $100k-200k)
Averages for the 2004 tax year for zip code 28447, filed in 2005:
Average Adjusted Gross Income (AGI) in 2004: $29,262 (Individual Income Tax Returns)
Here:
$29,262
State:
$45,376
Salary/wage: $27,000 (reported on 90.0% of returns)
Here:
$27,000
State:
$39,442
(% of AGI for various income ranges: 107.3% for AGIs below $10k, 91.7% for AGIs $10k-25k, 88.0% for AGIs $25k-50k, 87.5% for AGIs $50k-75k, 85.2% for AGIs $75k-100k, 39.0% for AGIs over 100k)
Taxable interest for individuals: $1,460 (reported on 21.6% of returns)
This zip code:
$1,460
North Carolina:
$1,515
(% of AGI for various income ranges: 0.7% for AGIs below $10k, 0.4% for AGIs $10k-25k, 1.0% for AGIs $25k-50k, 0.2% for AGIs $50k-75k, 0.1% for AGIs $75k-100k, 5.2% for AGIs over 100k)
Taxable dividends: $296 (reported on 5.8% of returns)
Here:
$296
State:
$4,016
Net capital gain/loss: +$2,150 (reported on 4.3% of returns)
Here:
+$2,150
State:
+$11,152
Profit/loss from business: +$4,696 (reported on 10.0% of returns)
Here:
+$4,696
State:
+$9,490
Total itemized deductions: $15,991 (31% of AGI, reported on 24.0% of returns)
Here:
$15,991
State:
$19,464
Here:
30.9% of AGI
State:
22.7% of AGI
(% of AGI for various income ranges: 9.8% for AGIs $10k-25k, 12.6% for AGIs $25k-50k, 15.9% for AGIs $50k-75k, 12.9% for AGIs $75k-100k, 20.4% for AGIs over 100k)
Charity contributions deductions: $3,299 (6% of AGI, reported on 21.0% of returns)
Here:
$3,299
State:
$4,035
Here:
6.1% of AGI
State:
4.5% of AGI
(% of AGI for various income ranges: 1.5% for AGIs $10k-25k, 1.8% for AGIs $25k-50k, 3.5% for AGIs $50k-75k, 6.5% for AGIs $75k-100k)
Total tax: $3,383 (reported on 58.2% of returns)
28447:
$3,383
State:
$7,257
(% of AGI for various income ranges: 2.3% for AGIs below $10k, 2.1% for AGIs $10k-25k, 5.6% for AGIs $25k-50k, 7.9% for AGIs $50k-75k, 9.8% for AGIs $75k-100k, 14.6% for AGIs over 100k)
Earned income credit: $2,194 (reported on 33.5% of returns)
Here:
$2,194
State:
$1,851
Percentage of individuals using paid preparers for their 2004 taxes: 66.9%
Here:
67%
State:
62%
(% for various income ranges: 57.1% for AGIs below $10k, 68.4% for AGIs $10k-25k, 67.0% for AGIs $25k-50k, 64.3% for AGIs $50k-75k, 85.0% for AGIs $75k-100k, 92.3% for AGIs over 100k)
Notable locations in zip code 28447: Henry Landing (A), Jackie Landing (B), Sikes Landing (C), Lake Creek Community House (D), Still Landing (E), Strawhorn Landing (F), Sandy Bluff Landing (G), Tar Landing (H), Memorial Monument (I), Bakers Landing (J), Delta Landing (K). Display/hide their locations on the map
Churches in zip code 28447 include: Haw Bluff Church (A), Black River Presbyterian Church (B), Moore Swamp Church (C), New Royal Chapel (D), Royal Chapel (E), Snow Hill Church (F). Display/hide their locations on the map
Cemeteries: Bannerman Cemetery (1), Barnhill Cemetery (2), Beatty Cemetery (3), Dyson Cemetery (4), Marshburn Cemetery (5), Hale Cemetery (6), McMillian Cemetery (7). Display/hide their locations on the map
Lakes, reservoirs, and swamps: Wheeler Lake (A), Cypress Lake (B), Kings Bay (C), Johns Swamp (D), Devils Nest (E), Murphy Bay (F), Moore Swamp (G), Sloans Bay (H). Display/hide their locations on the map
Streams, rivers, and creeks: Crab Branch (A), Tuckahoe Branch (B), Big Rattlesnake Creek (C), Dry Branch (D), Enoch Mill Creek (E), Johns Swamp Branch (F), Keith Branch (G), Lake Creek (H), Rowan Creek (I). Display/hide their locations on the map
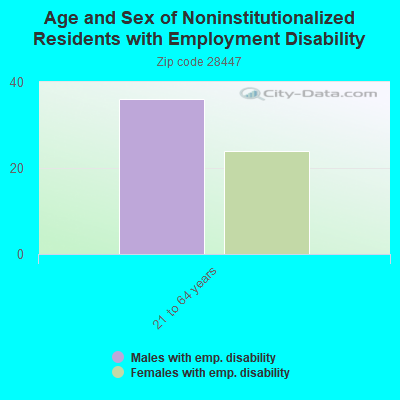
In group quarters: 123 (-1 institutionalized population)
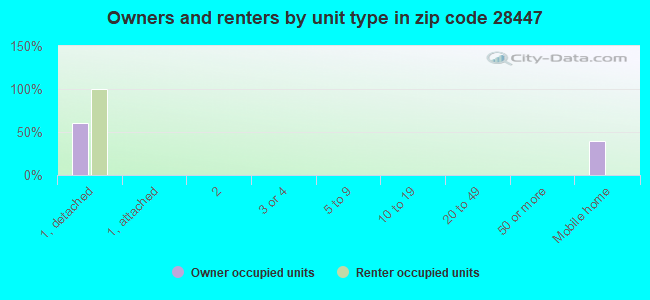
Size of family households: 167 2-persons, 54 3-persons, 52 5-persons
Size of nonfamily households: 89 1-person, 26 2-persons
98.1% of residents of 28447 zip code speak English at home.
1.5% of residents speak Spanish at home (100% very well).
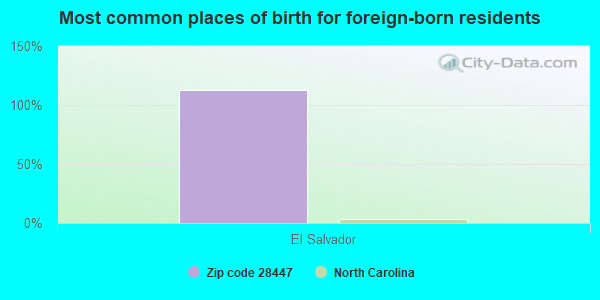
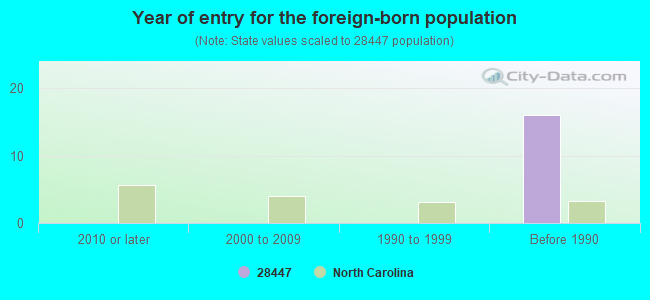
Foreign born population: 17 (1.3%) (100.0% of them are naturalized citizens)
This zip code:
1.3%
Whole state:
8.6%
112%El Salvador
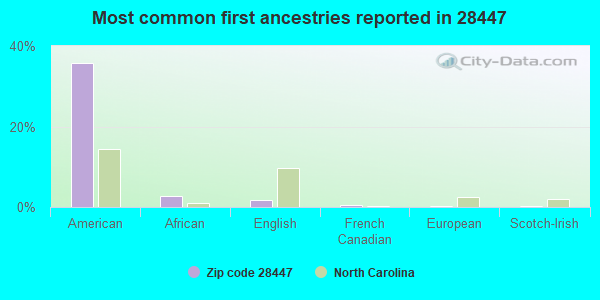
36%American
3%African
2%English
1%French Canadian
0%European
0%Scotch-Irish
Year of entry for the foreign-born population
02010 or later
02000 to 2009
01990 to 1999
16Before 1990
Housing units lacking complete plumbing facilities: 7.6% Housing units lacking complete kitchen facilities: 7.3%
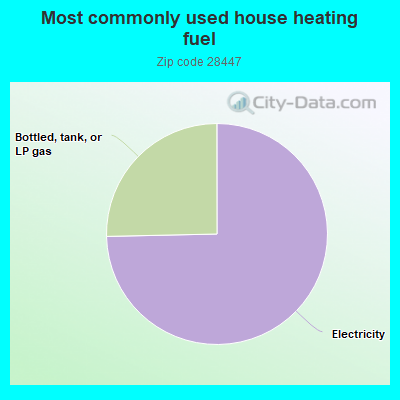
74.8%Electricity
25.4%Bottled, tank, or LP gas
Population in 1990: 352. Population change in the 1990s: +810 (+230.1%).
Place of birth for U.S.-born residents:
This state: 745
Northeast: 149
Midwest: 64
South: 410
West: 19
76% of the 28447 zip code residents lived in the same house 5 years ago. Out of people who lived in different houses, 64% lived in this county. Out of people who lived in different counties, 50% lived in North Carolina.
94% of the 28447 zip code residents lived in the same house 1 year ago. Out of people who lived in different houses, 26% moved from different county within same state. Out of people who lived in different houses, 90% moved from different state.
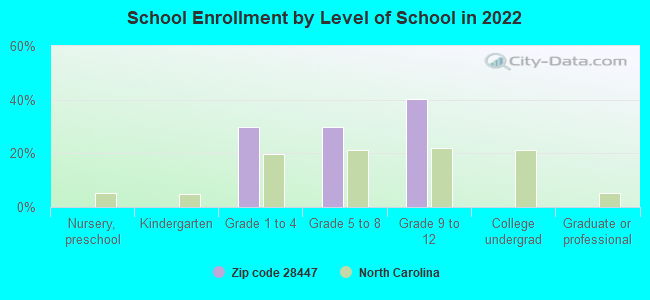
Private vs. public school enrollment:
Students in private schools in grades 1 to 8 (elementary and middle school):
Here:
0.0%
North Carolina:
13.8%
Students in private schools in grades 9 to 12 (high school):
Here:
0.0%
North Carolina:
11.9%
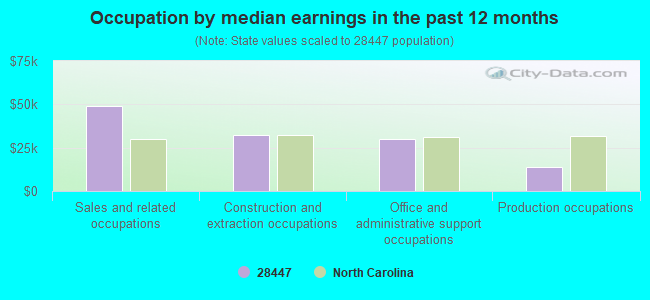
Occupation by median earnings in the past 12 months ($)
48,881Sales and related occupations
32,093Construction and extraction occupations
29,914Office and administrative support occupations
14,096Production occupations
Top industries in this zip code by the number of employees in 2005:
Health Care and Social Assistance: Residential Mental Retardation Facilities (10-19 employees: 1 establishment)
Mining: Construction Sand and Gravel Mining (5-9: 1)
Other Services (except Public Administration): Religious Organizations (1-4: 2)
Utilities: Water Supply and Irrigation Systems (1-4: 1)
Construction: Site Preparation Contractors (1-4: 1)
Construction: Plumbing, Heating, and Air-Conditioning Contractors (1-4: 1)
Construction: Water and Sewer Line and Related Structures Construction (1-4: 1)
People in group quarters in 2010:
12 people in workers' group living quarters and job corps centers
People in group quarters in 2000:
40 people in other group homes
16 people in nursing homes
Fatal accident statistics in 2014:
Fatal accident count: 1
Vehicles involved in fatal accidents: 1
Fatal accidents caused by drunken drivers: 1
Fatalities: 1
Persons involved in fatal accidents: 1
Pedestrians involved in fatal accidents: 0
Fatal accident statistics in 2012:
Fatal accident count: 1
Vehicles involved in fatal accidents: 1
Fatal accidents caused by drunken drivers: 0
Fatalities: 1
Persons involved in fatal accidents: 2
Pedestrians involved in fatal accidents: 1
Home Mortgage Disclosure Act Aggregated Statistics For Year 2009 (Based on 2 partial tracts)
A) FHA, FSA/RHS & VA Home Purchase Loans
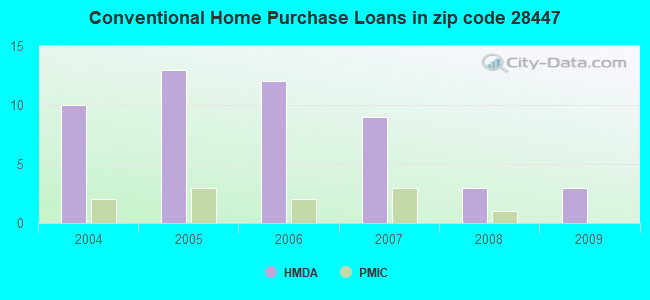
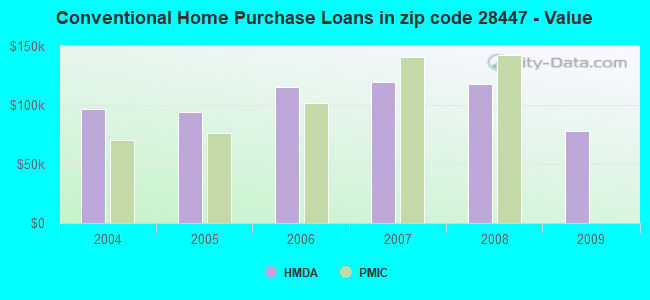
B) Conventional Home Purchase Loans
C) Refinancings
D) Home Improvement Loans
F) Non-occupant Loans on < 5 Family Dwellings (A B C & D)
G) Loans On Manufactured Home Dwelling (A B C & D)
Number
Average Value
Number
Average Value
Number
Average Value
Number
Average Value
Number
Average Value
Number
Average Value
LOANS ORIGINATED
1
$161,330
3
$78,330
12
$132,690
1
$31,260
1
$68,640
3
$79,423
APPLICATIONS APPROVED, NOT ACCEPTED
0
$0
0
$0
2
$148,650
0
$0
0
$0
1
$31,480
APPLICATIONS DENIED
0
$0
1
$128,760
10
$94,238
4
$40,168
0
$0
5
$64,400
APPLICATIONS WITHDRAWN
0
$0
1
$159,580
5
$111,880
1
$93,780
0
$0
3
$65,360
FILES CLOSED FOR INCOMPLETENESS
0
$0
0
$0
2
$171,275
0
$0
0
$0
1
$73,670
Aggregated Statistics For Year 2008 (Based on 2 partial tracts)
A) FHA, FSA/RHS & VA Home Purchase Loans
B) Conventional Home Purchase Loans
C) Refinancings
D) Home Improvement Loans
F) Non-occupant Loans on < 5 Family Dwellings (A B C & D)
G) Loans On Manufactured Home Dwelling (A B C & D)
Number
Average Value
Number
Average Value
Number
Average Value
Number
Average Value
Number
Average Value
Number
Average Value
LOANS ORIGINATED
3
$99,610
3
$117,827
16
$121,254
2
$55,635
2
$93,235
5
$95,048
APPLICATIONS APPROVED, NOT ACCEPTED
0
$0
0
$0
3
$154,987
0
$0
0
$0
1
$43,940
APPLICATIONS DENIED
1
$161,760
3
$95,893
12
$103,416
10
$33,140
0
$0
7
$68,640
APPLICATIONS WITHDRAWN
2
$66,565
0
$0
5
$111,180
1
$34,540
0
$0
3
$72,577
FILES CLOSED FOR INCOMPLETENESS
0
$0
0
$0
2
$168,650
1
$25,580
0
$0
0
$0
Aggregated Statistics For Year 2007 (Based on 2 partial tracts)
A) FHA, FSA/RHS & VA Home Purchase Loans
B) Conventional Home Purchase Loans
C) Refinancings
D) Home Improvement Loans
F) Non-occupant Loans on < 5 Family Dwellings (A B C & D)
G) Loans On Manufactured Home Dwelling (A B C & D)
Number
Average Value
Number
Average Value
Number
Average Value
Number
Average Value
Number
Average Value
Number
Average Value
LOANS ORIGINATED
2
$82,740
9
$119,356
16
$110,461
4
$44,702
2
$153,240
7
$74,824
APPLICATIONS APPROVED, NOT ACCEPTED
0
$0
2
$52,025
3
$93,780
1
$20,990
0
$0
2
$62,520
APPLICATIONS DENIED
1
$57,930
7
$90,906
11
$91,673
6
$38,437
2
$47,985
11
$70,747
APPLICATIONS WITHDRAWN
1
$48,530
2
$92,360
4
$111,268
1
$66,240
1
$52,460
0
$0
FILES CLOSED FOR INCOMPLETENESS
0
$0
1
$161,330
0
$0
0
$0
0
$0
0
$0
Aggregated Statistics For Year 2006 (Based on 2 partial tracts)
A) FHA, FSA/RHS & VA Home Purchase Loans
B) Conventional Home Purchase Loans
C) Refinancings
D) Home Improvement Loans
F) Non-occupant Loans on < 5 Family Dwellings (A B C & D)
G) Loans On Manufactured Home Dwelling (A B C & D)
Number
Average Value
Number
Average Value
Number
Average Value
Number
Average Value
Number
Average Value
Number
Average Value
LOANS ORIGINATED
2
$108,755
12
$115,621
15
$99,667
4
$68,968
3
$86,710
10
$74,674
APPLICATIONS APPROVED, NOT ACCEPTED
1
$74,760
5
$82,238
3
$109,373
1
$36,720
1
$90,500
4
$68,422
APPLICATIONS DENIED
1
$107,330
12
$86,547
11
$92,607
5
$76,072
2
$110,500
12
$66,855
APPLICATIONS WITHDRAWN
0
$0
2
$117,605
4
$112,962
0
$0
0
$0
1
$57,930
FILES CLOSED FOR INCOMPLETENESS
0
$0
0
$0
2
$137,280
0
$0
0
$0
0
$0
Aggregated Statistics For Year 2005 (Based on 2 partial tracts)
A) FHA, FSA/RHS & VA Home Purchase Loans
B) Conventional Home Purchase Loans
C) Refinancings
D) Home Improvement Loans
F) Non-occupant Loans on < 5 Family Dwellings (A B C & D)
G) Loans On Manufactured Home Dwelling (A B C & D)
Number
Average Value
Number
Average Value
Number
Average Value
Number
Average Value
Number
Average Value
Number
Average Value
LOANS ORIGINATED
1
$85,690
13
$93,695
13
$96,688
2
$17,270
2
$35,740
7
$65,267
APPLICATIONS APPROVED, NOT ACCEPTED
0
$0
3
$55,307
5
$73,056
1
$24,920
0
$0
3
$40,513
APPLICATIONS DENIED
1
$52,460
12
$54,650
15
$74,382
5
$37,556
2
$39,785
14
$59,054
APPLICATIONS WITHDRAWN
0
$0
2
$94,655
8
$99,271
0
$0
0
$0
3
$59,460
FILES CLOSED FOR INCOMPLETENESS
0
$0
1
$125,690
2
$86,785
0
$0
0
$0
1
$83,940
Aggregated Statistics For Year 2004 (Based on 2 partial tracts)
A) FHA, FSA/RHS & VA Home Purchase Loans
B) Conventional Home Purchase Loans
C) Refinancings
D) Home Improvement Loans
F) Non-occupant Loans on < 5 Family Dwellings (A B C & D)
G) Loans On Manufactured Home Dwelling (A B C & D)
Detailed PMIC statistics for the following Tracts:9805.00
2005 - 2018 National Fire Incident Reporting System (NFIRS) incidents
Based on the data from the years 2005 - 2018 the average number of fire incidents per year is 8. The highest number of fires - 15 took place in 2011, and the least - 3 in 2017. The data has a decreasing trend.
When looking into fire subcategories, the most incidents belonged to: Outside Fires (44.8%), and Structure Fires (41.4%).
Fire incident types reported to NFIRS in Zip Code 28447
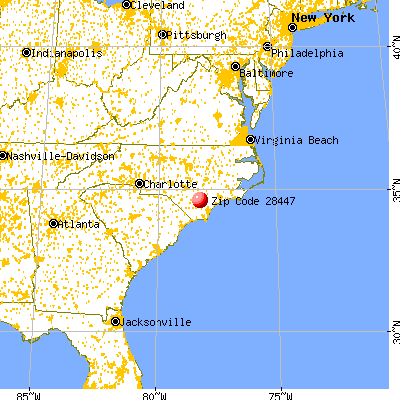


 Nearest zip codes: 28444, 28448, 28421, 28478, 28434, 28441.


 Based on the data from the years 2005 - 2018 the average number of fire incidents per year is 8. The highest number of fires - 15 took place in 2011, and the least - 3 in 2017. The data has a decreasing trend.
 When looking into fire subcategories, the most incidents belonged to: Outside Fires (44.8%), and Structure Fires (41.4%).