Estimated zip code population in 2022: 28,933 Zip code population in 2010: 22,027 Zip code population in 2000: 18,101
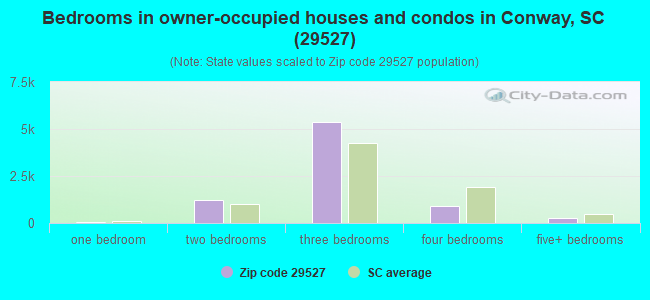
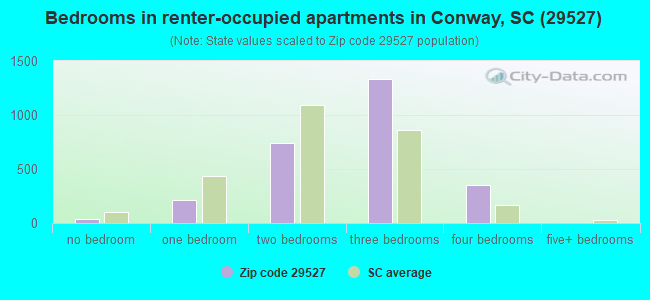
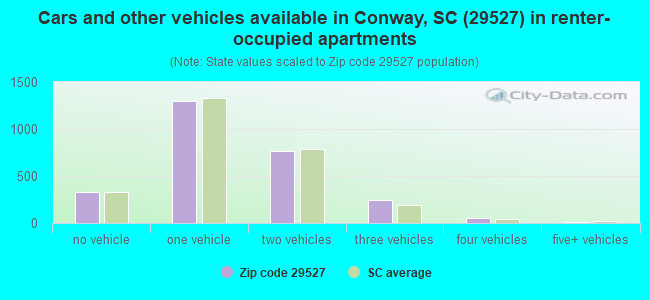
Houses and condos: 11,658 Renter-occupied apartments: 2,703
% of renters here:
26%
State:
28%
March 2022 cost of living index in zip code 29527: 81.9 (low, U.S. average is 100)
Land area: 154.9 sq. mi. Water area: 3.2 sq. mi.
Population density: 187 people per square mile
(very low).
OSM Map
General Map
Google Map
MSN Map
OSM Map
General Map
Google Map
MSN Map
OSM Map
General Map
Google Map
MSN Map
OSM Map
General Map
Google Map
MSN Map
Please wait while loading the map...
Real estate property taxes paid for housing units in 2022:
This zip code:
0.3% ($716)
South Carolina:
0.5% ($1,185)
Median real estate property taxes paid for housing units with mortgages in 2022: $837 (0.4%) Median real estate property taxes paid for housing units with no mortgage in 2022: $577 (0.3%)
Business Search- 14 Million verified businesses
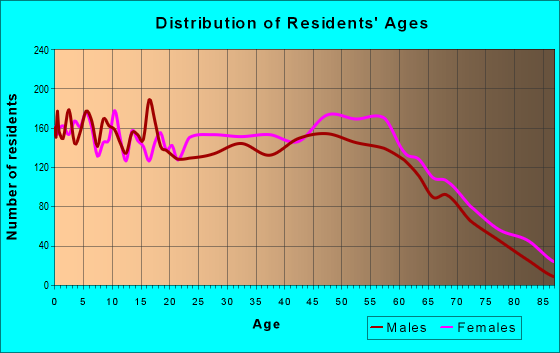
Males: 13,189
(45.6%)
Females: 15,749
(54.4%)
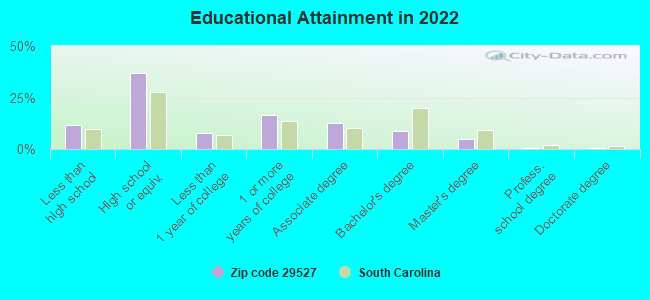
For population 25 years and over in 29527:
High school or higher: 86.7%
Bachelor's degree or higher: 13.9%
Graduate or professional degree: 5.4%
Unemployed: 3.4%
Mean travel time to work (commute): 26.3 minutes
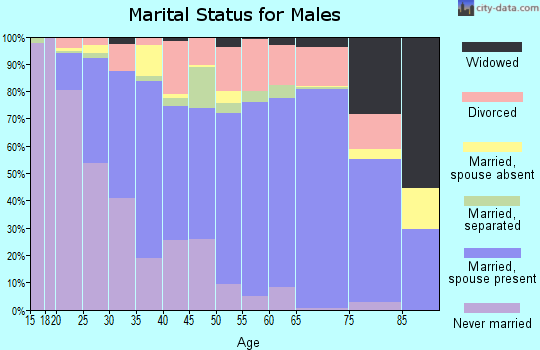
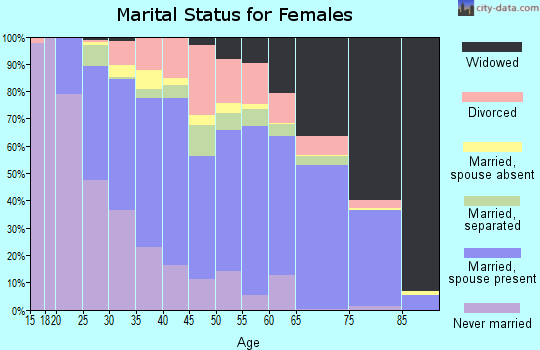
For population 15 years and over in 29527:
Never married: 32.9%
Now married: 44.4%
Separated: 2.8%
Widowed: 7.3%
Divorced: 12.6%
Zip code 29527 compared to state average:
Foreign-born population percentage below state average.
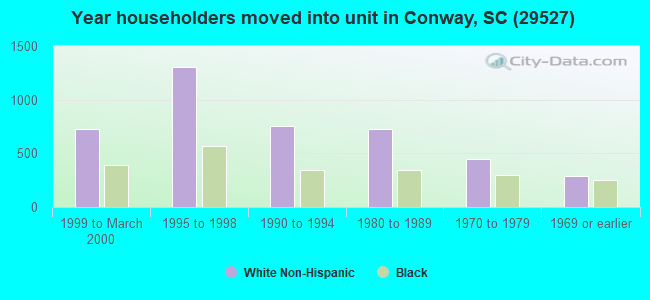
Length of stay since moving in significantly above state average.
Percentage of population with a bachelor's degree or higher significantly below state average.
Averages for the 2020 tax year for zip code 29527, filed in 2021:
Average Adjusted Gross Income (AGI) in 2020: $41,063 (Individual Income Tax Returns)
Here:
$41,063
State:
$65,754
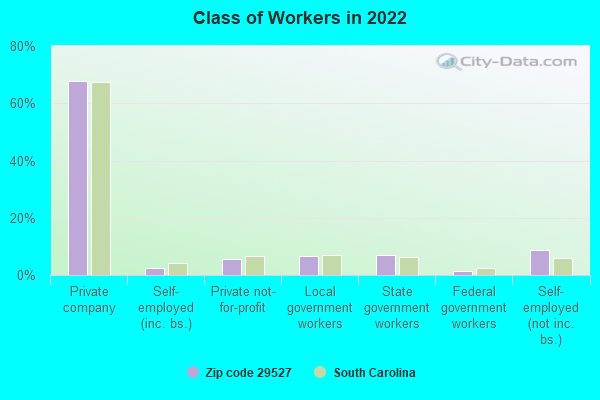
Salary/wage: $35,653 (reported on 81.9% of returns)
Here:
$35,653
State:
$52,566
(% of AGI for various income ranges: 1136.1% for AGIs below $25k, 3477.8% for AGIs $25k-50k, 6367.0% for AGIs $50k-75k, 9137.9% for AGIs $75k-100k, 16102.1% for AGIs $100k-200k, 46426.7% for AGIs over 200k)
Taxable interest for individuals: $796 (reported on 16.1% of returns)
This zip code:
$796
South Carolina:
$1,749
(% of AGI for various income ranges: 8.6% for AGIs below $25k, 10.3% for AGIs $25k-50k, 25.3% for AGIs $50k-75k, 22.2% for AGIs $75k-100k, 83.5% for AGIs $100k-200k, 456.7% for AGIs over 200k)
Ordinary dividends: $2,302 (reported on 8.5% of returns)
Here:
$2,302
State:
$8,783
(% of AGI for various income ranges: 7.7% for AGIs below $25k, 12.8% for AGIs $25k-50k, 28.2% for AGIs $50k-75k, 58.1% for AGIs $75k-100k, 180.2% for AGIs $100k-200k, 866.7% for AGIs over 200k)
Net capital gain/loss in AGI: +$7,370 (reported on 7.2% of returns)
Here:
+$7,370
State:
+$24,194
(% of AGI for various income ranges: 2.9% for AGIs below $25k, 12.4% for AGIs $25k-50k, 54.8% for AGIs $50k-75k, 108.1% for AGIs $75k-100k, 453.0% for AGIs $100k-200k, 9173.3% for AGIs over 200k)
Profit/loss from business: +$8,585 (reported on 13.8% of returns)
Here:
+$8,585
State:
+$11,253
(% of AGI for various income ranges: 111.0% for AGIs below $25k, 106.0% for AGIs $25k-50k, 159.1% for AGIs $50k-75k, 232.1% for AGIs $75k-100k, 854.7% for AGIs $100k-200k)
Taxable individual retirement arrangement distribution: $14,756 (reported on 6.9% of returns)
29527:
$14,756
South Carolina:
$21,604
(% of AGI for various income ranges: 35.7% for AGIs below $25k, 72.7% for AGIs $25k-50k, 204.2% for AGIs $50k-75k, 334.0% for AGIs $75k-100k, 1073.3% for AGIs $100k-200k)
Total itemized deductions: $26,144 (reported on 3.5% of returns)
Here:
$26,144
State:
$35,199
(% of AGI for various income ranges: 10.9% for AGIs below $25k, 97.5% for AGIs $25k-50k, 221.4% for AGIs $50k-75k, 266.9% for AGIs $75k-100k, 626.5% for AGIs $100k-200k, 4226.7% for AGIs over 200k)
Charity contributions: $8,324 (reported on 2.7% of returns)
Here:
$8,324
State:
$14,319
(% of AGI for various income ranges: 19.1% for AGIs $25k-50k, 49.2% for AGIs $50k-75k, 59.3% for AGIs $75k-100k, 192.6% for AGIs $100k-200k, 1583.3% for AGIs over 200k)
Taxes paid: $5,967 (reported on 3.5% of returns)
29527:
$5,967
State:
$7,486
(% of AGI for various income ranges: 1.8% for AGIs below $25k, 16.3% for AGIs $25k-50k, 47.9% for AGIs $50k-75k, 70.0% for AGIs $75k-100k, 186.3% for AGIs $100k-200k, 730.0% for AGIs over 200k)
Earned income credit: $2,457 (reported on 26.6% of returns)
Here:
$2,457
State:
$2,397
(% of AGI for various income ranges: 130.5% for AGIs below $25k, 88.2% for AGIs $25k-50k, 1.4% for AGIs $50k-75k)
Percentage of individuals using paid preparers for their 2020 taxes: 93.7%
Here:
94%
State:
93%
(% for various income ranges: 92.9% for AGIs below $25k, 94.7% for AGIs $25k-50k, 93.1% for AGIs $50k-75k, 94.3% for AGIs $75k-100k, 96.2% for AGIs $100k-200k, 88.9% for AGIs over 200k)
Averages for the 2012 tax year for zip code 29527, filed in 2013:
Average Adjusted Gross Income (AGI) in 2012: $32,205 (Individual Income Tax Returns)
Here:
$32,205
State:
$51,133
Salary/wage: $28,322 (reported on 86.0% of returns)
Here:
$28,322
State:
$42,173
(% of AGI for various income ranges: 78.1% for AGIs below $25k, 80.9% for AGIs $25k-50k, 75.4% for AGIs $50k-75k, 74.4% for AGIs $75k-100k, 69.9% for AGIs $100k-200k, 44.0% for AGIs over 200k)
Taxable interest for individuals: $840 (reported on 17.4% of returns)
This zip code:
$840
South Carolina:
$1,468
(% of AGI for various income ranges: 0.6% for AGIs below $25k, 0.4% for AGIs $25k-50k, 0.3% for AGIs $50k-75k, 0.3% for AGIs $75k-100k, 0.6% for AGIs $100k-200k, 0.4% for AGIs over 200k)
Ordinary dividends: $1,768 (reported on 8.9% of returns)
Here:
$1,768
State:
$6,511
(% of AGI for various income ranges: 0.3% for AGIs below $25k, 0.4% for AGIs $25k-50k, 0.5% for AGIs $50k-75k, 0.4% for AGIs $75k-100k, 1.1% for AGIs $100k-200k)
Net capital gain/loss in AGI: +$1,634 (reported on 6.7% of returns)
Here:
+$1,634
State:
+$13,061
(% of AGI for various income ranges: 0.1% for AGIs below $25k, 0.2% for AGIs $25k-50k, 0.1% for AGIs $50k-75k, 0.8% for AGIs $75k-100k, 0.9% for AGIs $100k-200k)
Profit/loss from business: +$7,317 (reported on 14.0% of returns)
Here:
+$7,317
State:
+$10,167
(% of AGI for various income ranges: 8.1% for AGIs below $25k, 2.4% for AGIs $25k-50k, 1.5% for AGIs $50k-75k, 1.6% for AGIs $75k-100k, 1.9% for AGIs $100k-200k)
Taxable individual retirement arrangement distribution: $13,540 (reported on 5.8% of returns)
29527:
$13,540
South Carolina:
$17,019
(% of AGI for various income ranges: 1.0% for AGIs below $25k, 1.7% for AGIs $25k-50k, 2.4% for AGIs $50k-75k, 2.6% for AGIs $75k-100k, 6.9% for AGIs $100k-200k)
Total itemized deductions: $17,525 (27% of AGI, reported on 20.0% of returns)
Here:
$17,525
State:
$22,890
Here:
26.8% of AGI
State:
21.4% of AGI
(% of AGI for various income ranges: 4.8% for AGIs below $25k, 10.0% for AGIs $25k-50k, 12.8% for AGIs $50k-75k, 14.2% for AGIs $75k-100k, 15.6% for AGIs $100k-200k, 14.0% for AGIs over 200k)
Charity contributions: $3,761 (reported on 16.1% of returns)
Here:
$3,761
State:
$5,169
(% of AGI for various income ranges: 0.6% for AGIs below $25k, 1.5% for AGIs $25k-50k, 2.1% for AGIs $50k-75k, 2.5% for AGIs $75k-100k, 3.2% for AGIs $100k-200k, 4.3% for AGIs over 200k)
Taxes paid: $4,642 (reported on 20.0% of returns)
29527:
$4,642
State:
$7,644
(% of AGI for various income ranges: 0.7% for AGIs below $25k, 1.9% for AGIs $25k-50k, 3.0% for AGIs $50k-75k, 4.5% for AGIs $75k-100k, 5.9% for AGIs $100k-200k, 6.1% for AGIs over 200k)
Earned income credit: $2,490 (reported on 34.4% of returns)
Here:
$2,490
State:
$2,418
(% of AGI for various income ranges: 10.3% for AGIs below $25k, 1.6% for AGIs $25k-50k)
Percentage of individuals using paid preparers for their 2012 taxes: 53.9%
Here:
54%
State:
57%
(% for various income ranges: 50.1% for AGIs below $25k, 54.1% for AGIs $25k-50k, 61.2% for AGIs $50k-75k, 64.0% for AGIs $75k-100k, 70.0% for AGIs $100k-200k, 100.0% for AGIs over 200k)
Averages for the 2004 tax year for zip code 29527, filed in 2005:
Average Adjusted Gross Income (AGI) in 2004: $28,563 (Individual Income Tax Returns)
Here:
$28,563
State:
$41,965
Salary/wage: $26,070 (reported on 89.6% of returns)
Here:
$26,070
State:
$35,695
(% of AGI for various income ranges: 103.2% for AGIs below $10k, 86.1% for AGIs $10k-25k, 84.7% for AGIs $25k-50k, 82.2% for AGIs $50k-75k, 82.4% for AGIs $75k-100k, 60.5% for AGIs over 100k)
Taxable interest for individuals: $1,190 (reported on 24.7% of returns)
This zip code:
$1,190
South Carolina:
$1,623
(% of AGI for various income ranges: 3.5% for AGIs below $10k, 0.8% for AGIs $10k-25k, 0.8% for AGIs $25k-50k, 1.0% for AGIs $50k-75k, 0.5% for AGIs $75k-100k, 1.8% for AGIs over 100k)
Taxable dividends: $1,353 (reported on 9.3% of returns)
Here:
$1,353
State:
$3,999
(% of AGI for various income ranges: 1.1% for AGIs below $10k, 0.2% for AGIs $10k-25k, 0.4% for AGIs $25k-50k, 0.3% for AGIs $50k-75k, 0.2% for AGIs $75k-100k, 1.3% for AGIs over 100k)
Net capital gain/loss: +$8,871 (reported on 7.3% of returns)
Here:
+$8,871
State:
+$13,100
(% of AGI for various income ranges: -0.5% for AGIs below $10k, 0.1% for AGIs $10k-25k, 1.0% for AGIs $25k-50k, 1.5% for AGIs $50k-75k, 1.1% for AGIs $75k-100k, 12.2% for AGIs over 100k)
Profit/loss from business: +$6,194 (reported on 13.1% of returns)
Here:
+$6,194
State:
+$9,144
(% of AGI for various income ranges: 5.1% for AGIs below $10k, 3.6% for AGIs $10k-25k, 2.7% for AGIs $25k-50k, 2.2% for AGIs $50k-75k, 0.7% for AGIs $75k-100k, 4.2% for AGIs over 100k)
IRA payment deduction: $2,840 (reported on 1.2% of returns)
29527:
$2,840
South Carolina:
$2,972
(% of AGI for various income ranges: 0.1% for AGIs $10k-25k, 0.1% for AGIs $25k-50k, 0.2% for AGIs $50k-75k, 0.2% for AGIs $75k-100k, 0.1% for AGIs over 100k)
Total itemized deductions: $16,504 (28% of AGI, reported on 22.0% of returns)
Here:
$16,504
State:
$19,039
Here:
28.2% of AGI
State:
22.8% of AGI
(% of AGI for various income ranges: 6.2% for AGIs below $10k, 5.9% for AGIs $10k-25k, 14.8% for AGIs $25k-50k, 14.3% for AGIs $50k-75k, 15.7% for AGIs $75k-100k, 15.7% for AGIs over 100k)
Charity contributions deductions: $3,587 (6% of AGI, reported on 18.8% of returns)
Here:
$3,587
State:
$4,305
Here:
5.8% of AGI
State:
5.0% of AGI
(% of AGI for various income ranges: 0.5% for AGIs below $10k, 0.9% for AGIs $10k-25k, 1.8% for AGIs $25k-50k, 2.4% for AGIs $50k-75k, 3.3% for AGIs $75k-100k, 5.6% for AGIs over 100k)
Total tax: $3,445 (reported on 62.1% of returns)
29527:
$3,445
State:
$6,497
(% of AGI for various income ranges: 2.8% for AGIs below $10k, 3.2% for AGIs $10k-25k, 6.0% for AGIs $25k-50k, 8.2% for AGIs $50k-75k, 10.2% for AGIs $75k-100k, 15.8% for AGIs over 100k)
Earned income credit: $1,965 (reported on 32.7% of returns)
Here:
$1,965
State:
$1,882
Percentage of individuals using paid preparers for their 2004 taxes: 66.6%
Here:
67%
State:
66%
(% for various income ranges: 59.1% for AGIs below $10k, 68.8% for AGIs $10k-25k, 67.9% for AGIs $25k-50k, 70.2% for AGIs $50k-75k, 70.4% for AGIs $75k-100k, 74.4% for AGIs over 100k)
Household received Food Stamps/SNAP in the past 12 months: 1,704 Household did not receive Food Stamps/SNAP in the past 12 months: 8,869
Women who had a birth in the past 12 months: 399 (168 now married, 218 unmarried) Women who did not have a birth in the past 12 months: 6,605 (2,263 now married, 4,322 unmarried)
Housing units in zip code 29527 with a mortgage: 4,417 (220 second mortgage, 191 both second mortgage and home equity loan) Houses without a mortgage: 104
Median monthly owner costs for units with a mortgage: $1,099 Median monthly owner costs for units without a mortgage: $346
Residents with income below the poverty level in 2022:
This zip code:
18.5%
Whole state:
14.0%
Residents with income below 50% of the poverty level in 2022:
This zip code:
11.1%
Whole state:
7.3%
Median number of rooms in houses and condos:
Here:
5.7
State:
6.4
Median number of rooms in apartments:
Here:
4.7
State:
4.5
Notable locations in this zip code not listed on our city pages
Notable locations in zip code 29527: Parker Landing (A), Punchbowl Landing (B), Lucas Bay Plantation (C), Conway Wastewater Treatment Plant (D), Red Hill (E), Horry County Memorial Library Bucksport Branch (F), Conway Recreation Complex (G), Horry County Fire Department Cates Bay (H), Horry County Fire Department Bucksport (I), Horry County Fire Department Juniper Bay (J), Conway Police Department Satellite Station (K). Display/hide their locations on the map
Churches in zip code 29527 include: Toddville Church (A), Pawleys Swamp Church (B), Pauley Swamp Baptist Church (C), Old Antioch Church (D), Oakey Swamp Church (E), Juniper Bay Church (F), Jerusalem Church (G), High Point Church (H), Faith Church (I). Display/hide their locations on the map
Lakes, reservoirs, and swamps: Wadus Lake (A), Black Lake (B), Eddy Lake (C), Jordan Lake (D), Page Lake (E), Old Mill Lake (F), Old River Lake (G), Indian Creek Lake (H). Display/hide their locations on the map
Streams, rivers, and creeks: Cowford Swamp (A), Bradley Branch (B), Willow Springs Branch (C), Singleton Creek (D), Sheep Pen Branch (E), Sarah Branch (F), Running Branch (G), Red Hill Branch (H), Old River (I). Display/hide their locations on the map
2,391 married couples with children.
2,563 single-parent households (280 men, 2,283 women).
95.4% of residents of 29527 zip code speak English at home.
3.1% of residents speak Spanish at home (32% very well, 26% well, 31% not well, 12% not at all).
0.3% of residents speak other Indo-European language at home (61% very well, 39% well).
0.4% of residents speak Asian or Pacific Island language at home (84% very well, 16% well).
0.7% of residents speak other language at home (46% very well, 54% well).
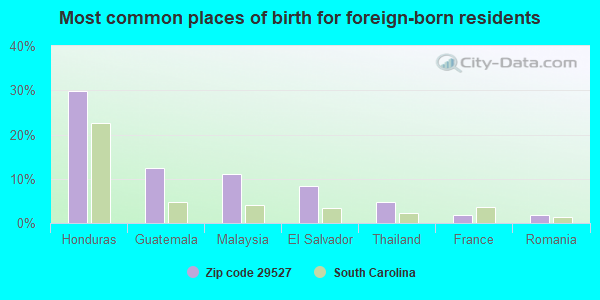
Foreign born population: 965 (3.3%) (46.0% of them are naturalized citizens)
This zip code:
3.3%
Whole state:
5.2%
30%Honduras
12%Guatemala
11%Malaysia
8%El Salvador
5%Thailand
2%France
2%Romania
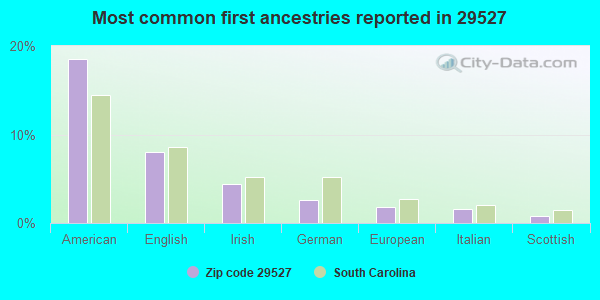
19%American
8%English
4%Irish
3%German
2%European
2%Italian
1%Scottish
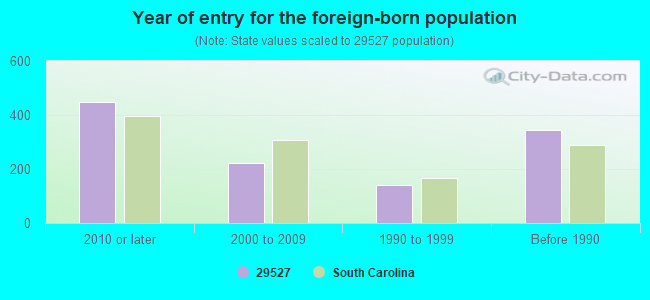
Year of entry for the foreign-born population
4472010 or later
2242000 to 2009
1411990 to 1999
345Before 1990
Facilities with environmental interests located in this zip code:
BURNIE JORDAN/JORDANS SAND PIT (HAMPTON ROAD in CONWAY, SC)
National Pollutant Discharge Elimination System NON-MAJOR (Tracking pollutant discharge elimination systems) - permit Business SIC classification: CONSTRUCTION SAND AND GRAVEL
D & L SITEWORK/CATES BAY MINE (PEE DEE HWY (SC-24) in CONWAY, SC)
National Pollutant Discharge Elimination System NON-MAJOR (Tracking pollutant discharge elimination systems) - permit Business SIC classification: MISCELLANEOUS NONMETALLIC MINERALS, EXCEPT FUELS
FAITH LANDSCAPING/FAITH MINE (W OF STATE RD S-26-548 in CONWAY, SC)
National Pollutant Discharge Elimination System NON-MAJOR (Tracking pollutant discharge elimination systems) - permit Business SIC classification: MISCELLANEOUS NONMETALLIC MINERALS, EXCEPT FUELS
Housing units lacking complete plumbing facilities: 2.7% Housing units lacking complete kitchen facilities: 1.9%
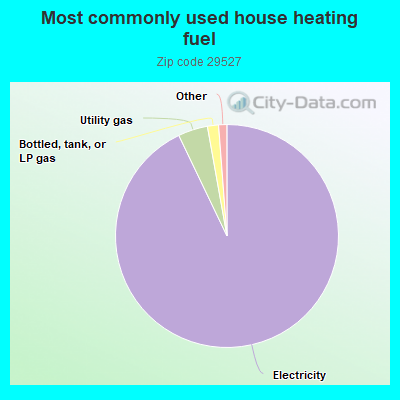
92.9%Electricity
4.3%Utility gas
1.6%Bottled, tank, or LP gas
0.6%No fuel used
0.5%Wood
Population in 1990: 19,781.
Place of birth for U.S.-born residents:
This state: 15,372
Northeast: 5,573
Midwest: 1,379
South: 4,954
West: 516
55% of the 29527 zip code residents lived in the same house 5 years ago. Out of people who lived in different houses, 62% lived in this county. Out of people who lived in different counties, 50% lived in South Carolina.
90% of the 29527 zip code residents lived in the same house 1 year ago. Out of people who lived in different houses, 47% moved from this county. Out of people who lived in different houses, 13% moved from different county within same state. Out of people who lived in different houses, 40% moved from different state.
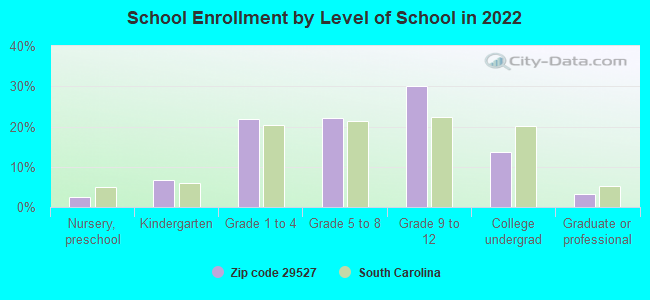
Private vs. public school enrollment:
Students in private schools in grades 1 to 8 (elementary and middle school): 111
Here:
4.1%
South Carolina:
14.4%
Students in private schools in grades 9 to 12 (high school): 128
Here:
6.8%
South Carolina:
11.1%
Students in private undergraduate colleges: 230
Here:
27.2%
South Carolina:
21.9%
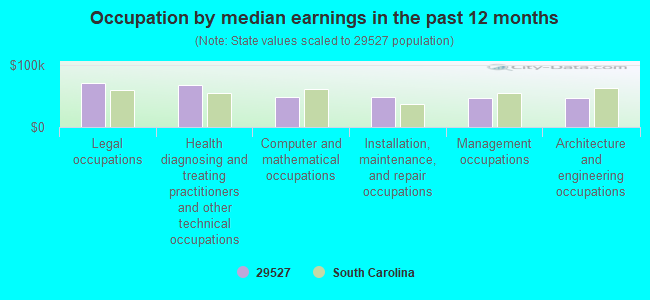
Occupation by median earnings in the past 12 months ($)
71,530Legal occupations
68,759Health diagnosing and treating practitioners and other technical occupations
49,054Computer and mathematical occupations
48,392Installation, maintenance, and repair occupations
47,858Management occupations
47,753Architecture and engineering occupations
Companies with federal contracts located in this zip code (CONWAY, SC):
GUNMASTERS DEFENSE SYSTEMS, LL (4030 HWY 378; small business) : $704,776 in 9 contractsfrom 2003 to 2005
Contracts for Optical Sighting and Ranging Equipment, Miscellaneous Weapons, Armament Training Devices, Guns, over 30 mm up to 75 mm, and moreby Army Signed by year:2000: $0; 2001: $0; 2002: $0; 2003: $72,040; 2004: $628,236; 2005: $4,500; 2006: $0.
Biggest contracts:
$352,758 with Army for Optical Sighting and Ranging Equipment. Signed on 2004-12-07. Completion date: 2005-01-31.
$134,378, same as above.Signed on 2004-11-03. Completion date: 2005-01-31.
$72,900 with Army for Miscellaneous Weapons. Signed on 2004-08-10. Completion date: 2004-11-12.
$48,000 with Army for Armament Training Devices. Taking place in ID. Signed on 2003-09-18. Completion date: 2003-12-19.
SENTNER MACHINE TOOL SERVICE I (5859 BLUEWATER RD; small business) : $20,000 in 9 contractsfrom 2001 to 2005
Contracts for Maintenance, Repair and Rebuilding of Equipment -- Metalworking Machinery, Maintenance, Repair and Rebuilding of Equipment -- Instruments and Laboratory Equipment by Army Signed by year:2000: $0; 2001: $5,000; 2002: -$5,000; 2003: $10,000; 2004: $0; 2005: $10,000; 2006: $0.
Biggest contracts:
$5,000 with Army for Maintenance, Repair and Rebuilding of Equipment -- Metalworking Machinery. Taking place in MD. Signed on 2005-12-06. Completion date: 2007-01-24.
$5,000, same as above.Signed on 2005-01-07. Completion date: 2005-09-30.
$5,000, same as above.Signed on 2003-12-03. Completion date: 2004-09-30.
$5,000, same as above.Signed on 2003-02-21. Completion date: 2003-09-30.
GRAYCO DETENTION EQUIPMENT INC (620 C SANDY LN; small business) 12 employees, $1000000 revenue. : $10,000 in 2 contractsfrom 2000 to 2001
$5,000 with Public Buildings Service for Maintenance, Repair or Alteration of Real Property -- Office Buildings. Taking place in GA. Signed on 2000-09-15. Completion date: 2000-12-15.
$5,000 with Public Buildings Service for Installation of Equipment -- Miscellaneous. Signed on 2001-06-15. Completion date: 2001-07-15.
WASTE INDUSTRIES USA INC (3010 HWY 378)
$1,381 with Army for Trash/Garbage Collection Services - Including Portable Sanitation Services. Signed on 2005-09-17. Completion date: 2006-07-31.
Top industries in this zip code by the number of employees in 2005:
Health Care and Social Assistance: Nursing Care Facilities (100-249 employees: 1 establishment)
2002 - 2018 National Fire Incident Reporting System (NFIRS) incidents
Based on the data from the years 2002 - 2018 the average number of fire incidents per year is 88. The highest number of fire incidents - 136 took place in 2017, and the least - 22 in 2009. The data has an increasing trend.
When looking into fire subcategories, the most incidents belonged to: Outside Fires (53.9%), and Structure Fires (27.2%).
Fire incident types reported to NFIRS in Zip Code 29527


 Nearest zip codes: 29588, 29544, 29511, 29526, 29579, 29575.


 Based on the data from the years 2002 - 2018 the average number of fire incidents per year is 88. The highest number of fire incidents - 136 took place in 2017, and the least - 22 in 2009. The data has an increasing trend.
 When looking into fire subcategories, the most incidents belonged to: Outside Fires (53.9%), and Structure Fires (27.2%).