Estimated zip code population in 2022: 7,177 Zip code population in 2010: 4,909 Zip code population in 2000: 4,364
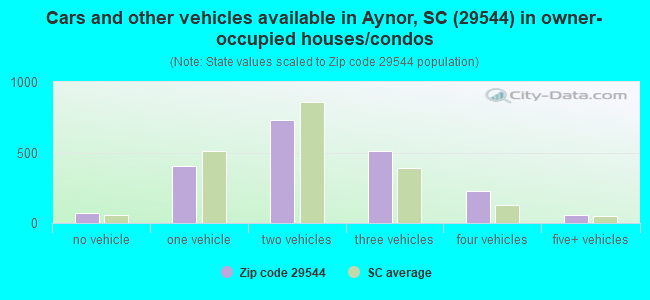
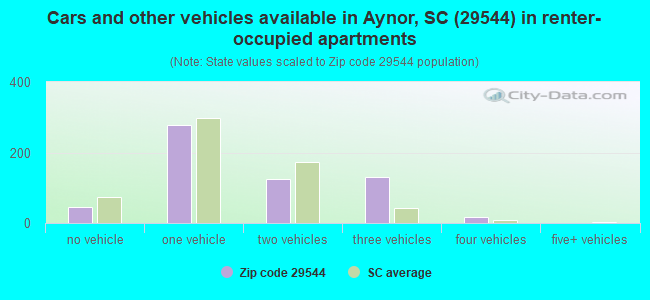
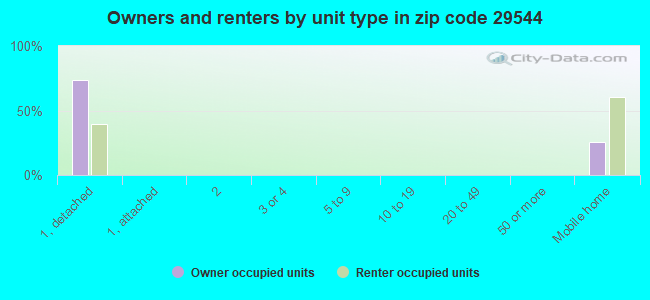
Houses and condos: 2,908 Renter-occupied apartments: 605
% of renters here:
23%
State:
28%
March 2022 cost of living index in zip code 29544: 80.5 (low, U.S. average is 100)
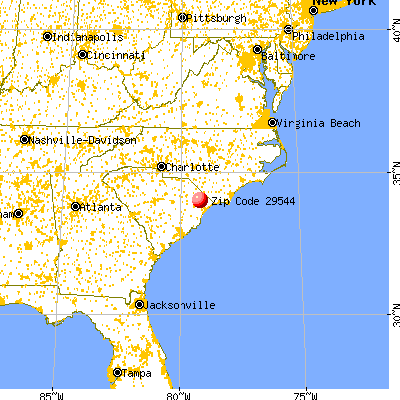
Land area: 114.0 sq. mi. Water area: 0.9 sq. mi.
Population density: 63 people per square mile
(very low).
OSM Map
General Map
Google Map
MSN Map
OSM Map
General Map
Google Map
MSN Map
OSM Map
General Map
Google Map
MSN Map
OSM Map
General Map
Google Map
MSN Map
Please wait while loading the map...
Real estate property taxes paid for housing units in 2022:
This zip code:
0.3% ($711)
South Carolina:
0.5% ($1,185)
Median real estate property taxes paid for housing units with mortgages in 2022: $843 (0.3%) Median real estate property taxes paid for housing units with no mortgage in 2022: $396 (0.2%)
Business Search- 14 Million verified businesses
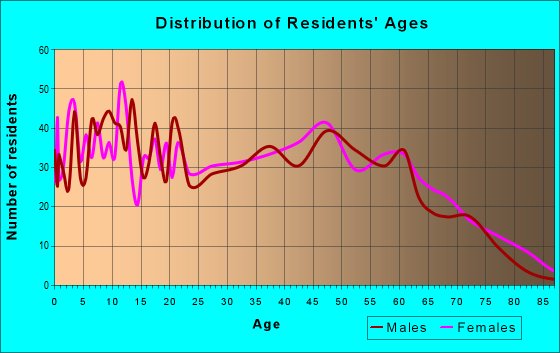
Males: 3,470
(48.4%)
Females: 3,706
(51.6%)
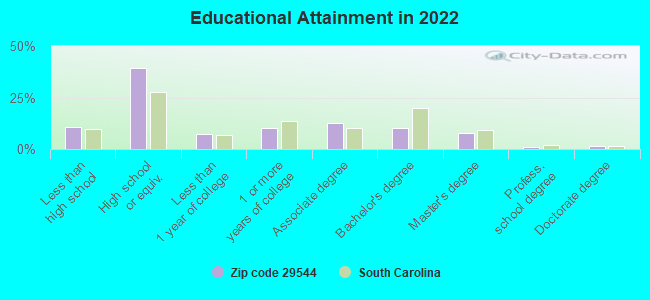
For population 25 years and over in 29544:
High school or higher: 88.4%
Bachelor's degree or higher: 19.7%
Graduate or professional degree: 9.8%
Unemployed: 5.4%
Mean travel time to work (commute): 33.3 minutes
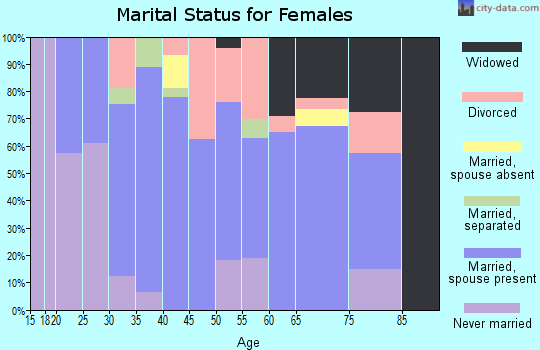
For population 15 years and over in 29544:
Never married: 27.8%
Now married: 54.1%
Separated: 2.3%
Widowed: 6.4%
Divorced: 9.4%
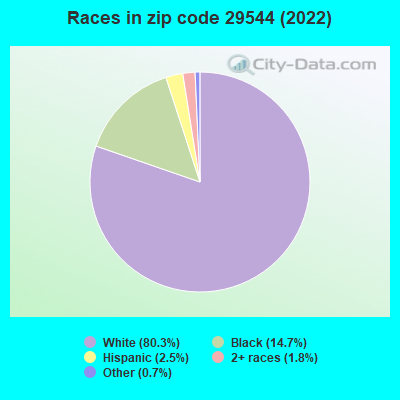
Zip code 29544 compared to state average:
Black race population percentage below state average.
Hispanic race population percentage below state average.
Foreign-born population percentage significantly below state average.
Length of stay since moving in above state average.
Percentage of population with a bachelor's degree or higher below state average.
Averages for the 2020 tax year for zip code 29544, filed in 2021:
Average Adjusted Gross Income (AGI) in 2020: $51,115 (Individual Income Tax Returns)
Here:
$51,115
State:
$65,754
Salary/wage: $45,773 (reported on 83.3% of returns)
Here:
$45,773
State:
$52,566
(% of AGI for various income ranges: 1140.4% for AGIs below $25k, 3405.1% for AGIs $25k-50k, 6744.7% for AGIs $50k-75k, 9976.8% for AGIs $75k-100k, 17147.4% for AGIs $100k-200k)
Taxable interest for individuals: $1,347 (reported on 18.1% of returns)
This zip code:
$1,347
South Carolina:
$1,749
(% of AGI for various income ranges: 9.3% for AGIs below $25k, 22.9% for AGIs $25k-50k, 37.3% for AGIs $50k-75k, 50.0% for AGIs $75k-100k, 42.1% for AGIs $100k-200k)
Ordinary dividends: $2,342 (reported on 8.9% of returns)
Here:
$2,342
State:
$8,783
(% of AGI for various income ranges: 4.6% for AGIs below $25k, 15.1% for AGIs $25k-50k, 42.7% for AGIs $50k-75k, 74.2% for AGIs $75k-100k, 106.8% for AGIs $100k-200k)
Net capital gain/loss in AGI: +$10,896 (reported on 8.9% of returns)
Here:
+$10,896
State:
+$24,194
(% of AGI for various income ranges: 3.6% for AGIs below $25k, 11.5% for AGIs $25k-50k, 31.7% for AGIs $50k-75k, 141.1% for AGIs $75k-100k, 494.7% for AGIs $100k-200k)
Profit/loss from business: +$6,390 (reported on 17.4% of returns)
Here:
+$6,390
State:
+$11,253
(% of AGI for various income ranges: 123.8% for AGIs below $25k, 49.1% for AGIs $25k-50k, 160.3% for AGIs $50k-75k, 265.3% for AGIs $75k-100k, 481.6% for AGIs $100k-200k)
Taxable individual retirement arrangement distribution: $18,476 (reported on 5.8% of returns)
29544:
$18,476
South Carolina:
$21,604
(% of AGI for various income ranges: 30.8% for AGIs below $25k, 87.5% for AGIs $25k-50k, 186.0% for AGIs $50k-75k, 217.4% for AGIs $75k-100k, 706.3% for AGIs $100k-200k)
Total itemized deductions: $29,191 (reported on 3.8% of returns)
Here:
$29,191
State:
$35,199
(% of AGI for various income ranges: 98.6% for AGIs $25k-50k, 325.3% for AGIs $75k-100k, 1027.4% for AGIs $100k-200k)
Charity contributions: $9,438 (reported on 2.7% of returns)
Here:
$9,438
State:
$14,319
(% of AGI for various income ranges: 58.0% for AGIs $50k-75k, 305.8% for AGIs $100k-200k)
Taxes paid: $7,291 (reported on 3.8% of returns)
29544:
$7,291
State:
$7,486
(% of AGI for various income ranges: 21.1% for AGIs $25k-50k, 58.9% for AGIs $75k-100k, 291.1% for AGIs $100k-200k)
Earned income credit: $2,524 (reported on 23.2% of returns)
Here:
$2,524
State:
$2,397
(% of AGI for various income ranges: 130.0% for AGIs below $25k, 96.0% for AGIs $25k-50k)
Percentage of individuals using paid preparers for their 2020 taxes: 95.9%
Here:
96%
State:
93%
(% for various income ranges: 94.4% for AGIs below $25k, 97.4% for AGIs $25k-50k, 95.2% for AGIs $50k-75k, 96.4% for AGIs $75k-100k, 96.9% for AGIs $100k-200k, 100.0% for AGIs over 200k)
Averages for the 2012 tax year for zip code 29544, filed in 2013:
Average Adjusted Gross Income (AGI) in 2012: $36,100 (Individual Income Tax Returns)
Here:
$36,100
State:
$51,133
Salary/wage: $34,592 (reported on 84.2% of returns)
Here:
$34,592
State:
$42,173
(% of AGI for various income ranges: 73.3% for AGIs below $25k, 84.6% for AGIs $25k-50k, 82.1% for AGIs $50k-75k, 82.1% for AGIs $75k-100k, 79.0% for AGIs $100k-200k)
Taxable interest for individuals: $1,420 (reported on 22.8% of returns)
This zip code:
$1,420
South Carolina:
$1,468
(% of AGI for various income ranges: 1.1% for AGIs below $25k, 0.5% for AGIs $25k-50k, 0.4% for AGIs $50k-75k, 0.6% for AGIs $75k-100k, 2.1% for AGIs $100k-200k)
Ordinary dividends: $936 (reported on 6.9% of returns)
Here:
$936
State:
$6,511
(% of AGI for various income ranges: 0.2% for AGIs below $25k, 0.3% for AGIs $25k-50k, 0.2% for AGIs $50k-75k, 0.2% for AGIs $75k-100k)
Net capital gain/loss in AGI: +$4,948 (reported on 11.4% of returns)
Here:
+$4,948
State:
+$13,061
(% of AGI for various income ranges: 1.8% for AGIs below $25k, 1.0% for AGIs $25k-50k, 1.8% for AGIs $50k-75k, 0.5% for AGIs $75k-100k, 2.8% for AGIs $100k-200k)
Profit/loss from business: +$6,346 (reported on 17.3% of returns)
Here:
+$6,346
State:
+$10,167
(% of AGI for various income ranges: 11.3% for AGIs below $25k, 1.2% for AGIs $25k-50k, 2.4% for AGIs $50k-75k, 0.7% for AGIs $75k-100k, 1.3% for AGIs $100k-200k)
Taxable individual retirement arrangement distribution: $12,080 (reported on 5.0% of returns)
29544:
$12,080
South Carolina:
$17,019
(% of AGI for various income ranges: 1.7% for AGIs below $25k, 1.5% for AGIs $25k-50k, 5.6% for AGIs $75k-100k)
Total itemized deductions: $17,748 (24% of AGI, reported on 19.8% of returns)
Here:
$17,748
State:
$22,890
Here:
24.1% of AGI
State:
21.4% of AGI
(% of AGI for various income ranges: 5.8% for AGIs below $25k, 5.9% for AGIs $25k-50k, 10.3% for AGIs $50k-75k, 13.4% for AGIs $75k-100k, 14.4% for AGIs $100k-200k)
Charity contributions: $4,029 (reported on 15.3% of returns)
Here:
$4,029
State:
$5,169
(% of AGI for various income ranges: 0.5% for AGIs below $25k, 0.8% for AGIs $25k-50k, 1.6% for AGIs $50k-75k, 2.9% for AGIs $75k-100k, 2.9% for AGIs $100k-200k)
Taxes paid: $5,120 (reported on 19.8% of returns)
29544:
$5,120
State:
$7,644
(% of AGI for various income ranges: 0.8% for AGIs below $25k, 1.3% for AGIs $25k-50k, 2.6% for AGIs $50k-75k, 4.3% for AGIs $75k-100k, 5.4% for AGIs $100k-200k)
Earned income credit: $2,659 (reported on 30.2% of returns)
Here:
$2,659
State:
$2,418
(% of AGI for various income ranges: 10.6% for AGIs below $25k, 1.7% for AGIs $25k-50k)
Percentage of individuals using paid preparers for their 2012 taxes: 68.8%
Here:
69%
State:
57%
(% for various income ranges: 65.7% for AGIs below $25k, 69.8% for AGIs $25k-50k, 75.0% for AGIs $50k-75k, 73.3% for AGIs $75k-100k, 72.7% for AGIs $100k-200k)
Averages for the 2004 tax year for zip code 29544, filed in 2005:
Average Adjusted Gross Income (AGI) in 2004: $30,909 (Individual Income Tax Returns)
Here:
$30,909
State:
$41,965
Salary/wage: $29,957 (reported on 85.9% of returns)
Here:
$29,957
State:
$35,695
(% of AGI for various income ranges: 87.4% for AGIs below $10k, 80.9% for AGIs $10k-25k, 88.1% for AGIs $25k-50k, 87.0% for AGIs $50k-75k, 86.4% for AGIs $75k-100k, 61.1% for AGIs over 100k)
Taxable interest for individuals: $1,234 (reported on 31.4% of returns)
This zip code:
$1,234
South Carolina:
$1,623
(% of AGI for various income ranges: 4.4% for AGIs below $10k, 2.1% for AGIs $10k-25k, 0.8% for AGIs $25k-50k, 0.8% for AGIs $50k-75k, 0.7% for AGIs $75k-100k, 1.9% for AGIs over 100k)
Taxable dividends: $1,329 (reported on 8.7% of returns)
Here:
$1,329
State:
$3,999
(% of AGI for various income ranges: 1.7% for AGIs below $10k, 0.6% for AGIs $10k-25k, 0.4% for AGIs $25k-50k, 0.1% for AGIs $50k-75k, 0.1% for AGIs $75k-100k, 0.6% for AGIs over 100k)
Net capital gain/loss: +$9,958 (reported on 8.2% of returns)
Here:
+$9,958
State:
+$13,100
(% of AGI for various income ranges: -0.8% for AGIs below $10k, 1.0% for AGIs $10k-25k, 1.1% for AGIs $25k-50k, 1.2% for AGIs $50k-75k, 0.6% for AGIs $75k-100k, 15.5% for AGIs over 100k)
Profit/loss from business: +$3,880 (reported on 16.7% of returns)
Here:
+$3,880
State:
+$9,144
(% of AGI for various income ranges: 3.2% for AGIs below $10k, 4.5% for AGIs $10k-25k, 1.8% for AGIs $25k-50k, 1.9% for AGIs $50k-75k, 1.7% for AGIs $75k-100k)
Total itemized deductions: $15,628 (25% of AGI, reported on 22.0% of returns)
Here:
$15,628
State:
$19,039
Here:
25.1% of AGI
State:
22.8% of AGI
(% of AGI for various income ranges: 5.7% for AGIs below $10k, 4.3% for AGIs $10k-25k, 9.3% for AGIs $25k-50k, 14.4% for AGIs $50k-75k, 13.8% for AGIs $75k-100k, 17.5% for AGIs over 100k)
Charity contributions deductions: $3,778 (6% of AGI, reported on 18.9% of returns)
Here:
$3,778
State:
$4,305
Here:
5.8% of AGI
State:
5.0% of AGI
(% of AGI for various income ranges: 0.7% for AGIs $10k-25k, 1.5% for AGIs $25k-50k, 3.0% for AGIs $50k-75k, 2.9% for AGIs $75k-100k, 5.5% for AGIs over 100k)
Total tax: $3,304 (reported on 68.9% of returns)
29544:
$3,304
State:
$6,497
(% of AGI for various income ranges: 3.1% for AGIs below $10k, 3.9% for AGIs $10k-25k, 5.7% for AGIs $25k-50k, 7.6% for AGIs $50k-75k, 10.0% for AGIs $75k-100k, 14.9% for AGIs over 100k)
Earned income credit: $1,924 (reported on 25.1% of returns)
Here:
$1,924
State:
$1,882
Percentage of individuals using paid preparers for their 2004 taxes: 76.3%
Here:
76%
State:
66%
(% for various income ranges: 71.8% for AGIs below $10k, 78.9% for AGIs $10k-25k, 75.8% for AGIs $25k-50k, 76.4% for AGIs $50k-75k, 75.9% for AGIs $75k-100k, 91.9% for AGIs over 100k)
Household received Food Stamps/SNAP in the past 12 months: 411 Household did not receive Food Stamps/SNAP in the past 12 months: 2,197
Women who had a birth in the past 12 months: 81 (69 now married, 14 unmarried) Women who did not have a birth in the past 12 months: 1,580 (746 now married, 837 unmarried)
Housing units in zip code 29544 with a mortgage: 1,103 (14 second mortgage, 13 both second mortgage and home equity loan) Houses without a mortgage: 14
Median monthly owner costs for units with a mortgage: $1,211 Median monthly owner costs for units without a mortgage: $317
Residents with income below the poverty level in 2022:
This zip code:
13.1%
Whole state:
14.0%
Residents with income below 50% of the poverty level in 2022:
This zip code:
6.5%
Whole state:
7.3%
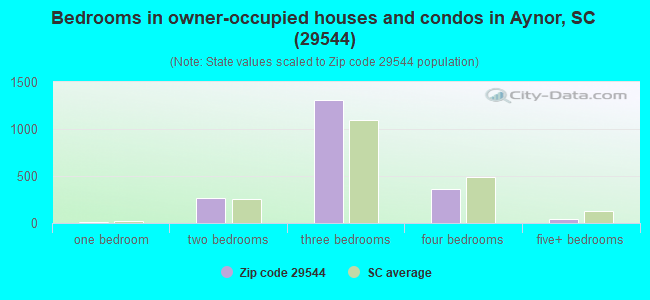
Median number of rooms in houses and condos:
Here:
5.8
State:
6.4
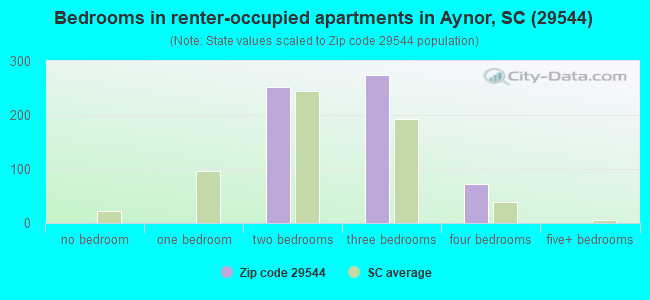
Median number of rooms in apartments:
Here:
4.9
State:
4.5
Notable locations in this zip code not listed on our city pages
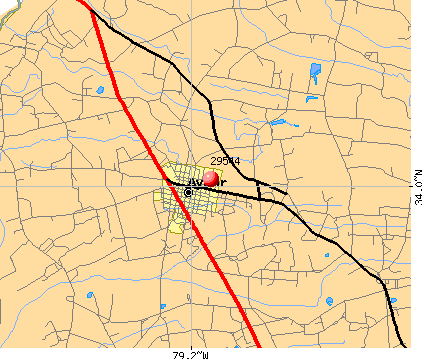
Notable locations in zip code 29544: Rolling Hills Golf Club (A), Rogers Fallout (B), Horry County Fire Department Antioch (C), Horry County Fire Department Joyner (D). Display/hide their locations on the map
Churches in zip code 29544 include: Saint Johns Church (A), Antioch Church (B), New Home Church (C), Mount Herman Church (D), Gallivants Ferry Church (E), Gethsemane Church (F), Berea Church (G), Red Hill Church (H), Mount Pisgah Church (I). Display/hide their locations on the map
Lakes, reservoirs, and swamps: Broad Lake (A), Vaught Lake (B), White Oak Lake (C), Gunter Lake (D), Canoe Lake (E), Hodges Lake (F), Flat Lake (G), Johnny Lake (H). Display/hide their locations on the map
Streams, rivers, and creeks: Chinners Swamp (A), Spring Swamp (B), Rattlesnake Branch (C), Ratan Branch (D), Mill Branch (E), Breakfast Swamp (F), Long Branch (G), Limbrick Branch (H), Holly Hill Branch (I). Display/hide their locations on the map
In group quarters: 14 (-1 institutionalized population)
Size of family households: 789 2-persons, 453 3-persons, 420 4-persons, 163 5-persons, 53 6-persons, 13 7-or-more-persons
Size of nonfamily households: 525 1-person, 171 2-persons, 6 4-persons
1,410 married couples with children.
381 single-parent households (43 men, 338 women).
98.4% of residents of 29544 zip code speak English at home.
1.1% of residents speak Spanish at home (100% very well).
0.1% of residents speak other Indo-European language at home (100% very well).
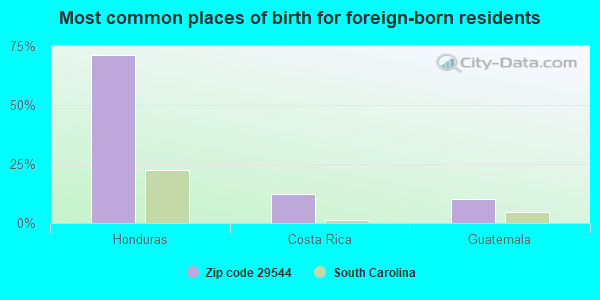
Foreign born population: 92 (1.3%) (64.2% of them are naturalized citizens)
This zip code:
1.3%
Whole state:
5.2%
71%Honduras
12%Costa Rica
10%Guatemala
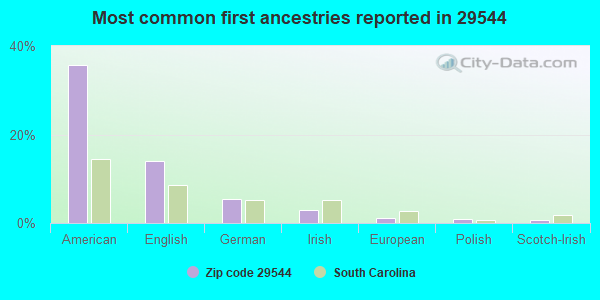
36%American
14%English
5%German
3%Irish
1%European
1%Polish
1%Scotch-Irish
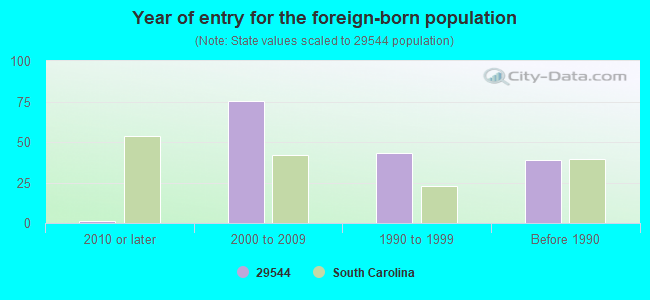
Year of entry for the foreign-born population
12010 or later
752000 to 2009
431990 to 1999
39Before 1990
Public elementary/middle schools in in zip code 29544 not listed on the city page:
Facilities with environmental interests located in this zip code:
BORDEN CHEMICAL (HWY 24 in GALIVANTS FERRY, SC)
(Resource Conservation and Recovery Act (tracking hazardous waste)) STATE MASTER (South Carolina database) - HAZARDOUS WASTE PROGRAM Alternative names: BORDEN CHEMICAL SMITH-DOUGLASS
D&L SITEWORK/GUNTERS ISLAND MI (3955 GUNTERS ISLAND RD in GALIVANTS FERRY, SC)
National Pollutant Discharge Elimination System NON-MAJOR (Tracking pollutant discharge elimination systems) - permit Business SIC classification: MISCELLANEOUS NONMETALLIC MINERALS, EXCEPT FUELS
BRYAN OBRIEN (3569 BLUEBERRY LANE in GALIVANTS FERRY, SC)
AIR MINOR (AIRS/AFS) Business SIC classification: SERVICES
Housing units lacking complete plumbing facilities: 3.3% Housing units lacking complete kitchen facilities: 2.3%
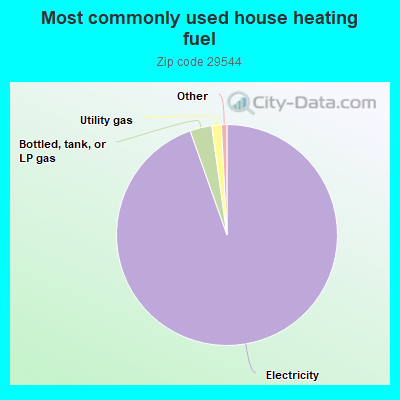
94.7%Electricity
3.2%Bottled, tank, or LP gas
1.4%Utility gas
Population in 1990: 1,129. Population change in the 1990s: +3,235 (+286.5%).
Place of birth for U.S.-born residents:
This state: 4,807
Northeast: 682
Midwest: 475
South: 862
West: 129
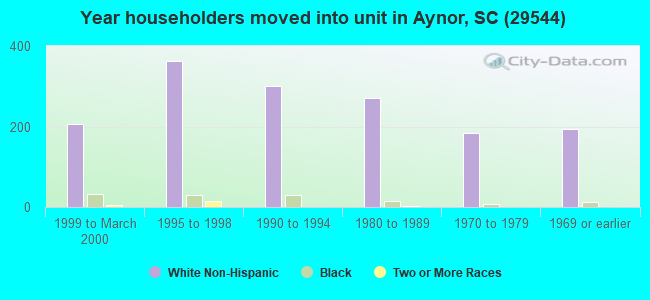
71% of the 29544 zip code residents lived in the same house 5 years ago. Out of people who lived in different houses, 72% lived in this county. Out of people who lived in different counties, 50% lived in South Carolina.
91% of the 29544 zip code residents lived in the same house 1 year ago. Out of people who lived in different houses, 67% moved from this county. Out of people who lived in different houses, 10% moved from different county within same state. Out of people who lived in different houses, 13% moved from different state.
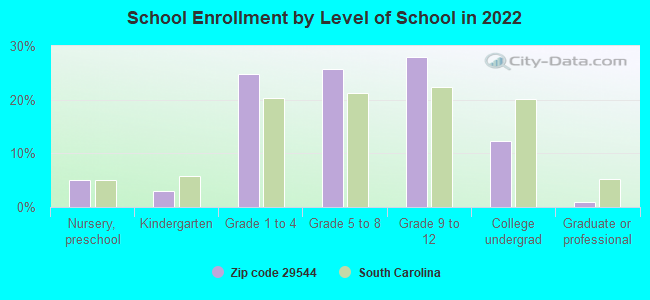
Private vs. public school enrollment:
Students in private schools in grades 1 to 8 (elementary and middle school): 47
Here:
5.3%
South Carolina:
14.4%
Students in private schools in grades 9 to 12 (high school): 26
Here:
5.2%
South Carolina:
11.1%
Students in private undergraduate colleges: 59
Here:
25.5%
South Carolina:
21.9%
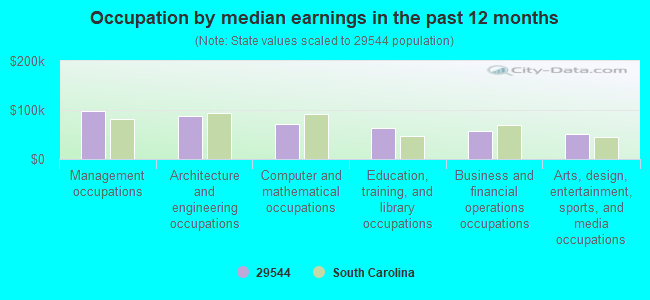
Occupation by median earnings in the past 12 months ($)
98,502Management occupations
87,363Architecture and engineering occupations
70,974Computer and mathematical occupations
64,216Education, training, and library occupations
57,058Business and financial operations occupations
50,121Arts, design, entertainment, sports, and media occupations
Top industries in this zip code by the number of employees in 2005:
Wholesale Trade: Service Establishment Equipment and Supplies Merchant Wholesalers (20-49 employees: 1 establishment)
Construction: All Other Specialty Trade Contractors (5-9: 1, 1-4: 1)
Construction: Painting and Wall Covering Contractors (5-9: 1, 1-4: 1)
Other Services (except Public Administration): Business Associations (5-9: 1)
Construction: New Housing Operative Builders (5-9: 1)
Administrative and Support and Waste Management and Remediation Services: Landscaping Services (5-9: 1)
Professional, Scientific, and Technical Services: Administrative Management and General Management Consulting Services (5-9: 1)
People in group quarters in 2010:
9 people in residential treatment centers for adults
People in group quarters in 2000:
11 people in other noninstitutional group quarters
Fatal accident statistics in 2014:
Fatal accident count: 2
Vehicles involved in fatal accidents: 2
Fatal accidents caused by drunken drivers: 0
Fatalities: 2
Persons involved in fatal accidents: 2
Pedestrians involved in fatal accidents: 1
Fatal accident statistics in 2013:
Fatal accident count: 1
Vehicles involved in fatal accidents: 1
Fatal accidents caused by drunken drivers: 0
Fatalities: 1
Persons involved in fatal accidents: 2
Pedestrians involved in fatal accidents: 0
Home Mortgage Disclosure Act Aggregated Statistics For Year 2009 (Based on 4 partial tracts)
A) FHA, FSA/RHS & VA Home Purchase Loans
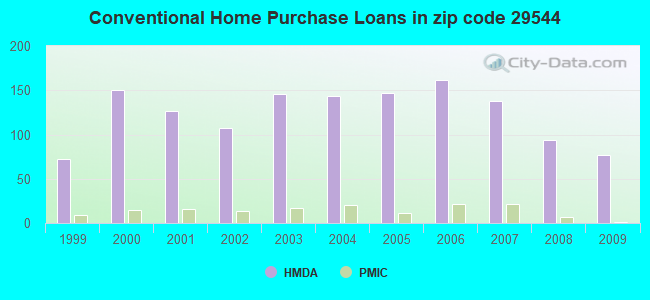
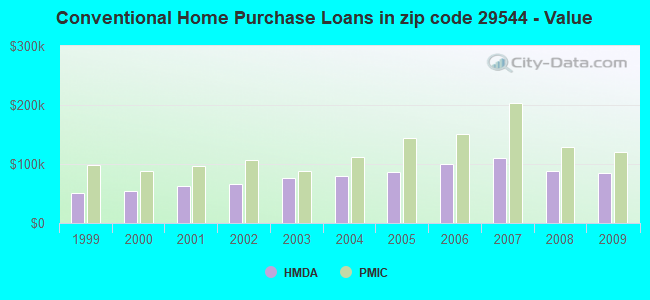
B) Conventional Home Purchase Loans
C) Refinancings
D) Home Improvement Loans
E) Loans on Dwellings For 5+ Families
F) Non-occupant Loans on < 5 Family Dwellings (A B C & D)
G) Loans On Manufactured Home Dwelling (A B C & D)
Number
Average Value
Number
Average Value
Number
Average Value
Number
Average Value
Number
Average Value
Number
Average Value
Number
Average Value
LOANS ORIGINATED
21
$151,835
77
$84,509
280
$132,037
25
$67,572
1
$325,210
41
$84,457
105
$44,825
APPLICATIONS APPROVED, NOT ACCEPTED
1
$71,900
3
$109,750
17
$162,026
3
$30,827
0
$0
1
$87,710
4
$55,420
APPLICATIONS DENIED
9
$98,599
16
$99,181
102
$159,720
7
$87,283
0
$0
3
$166,693
21
$71,210
APPLICATIONS WITHDRAWN
4
$124,650
0
$0
58
$166,001
0
$0
0
$0
1
$82,350
4
$110,860
FILES CLOSED FOR INCOMPLETENESS
3
$120,997
1
$103,900
12
$165,369
1
$214,380
0
$0
0
$0
3
$75,117
Aggregated Statistics For Year 2008 (Based on 4 partial tracts)
A) FHA, FSA/RHS & VA Home Purchase Loans
B) Conventional Home Purchase Loans
C) Refinancings
D) Home Improvement Loans
F) Non-occupant Loans on < 5 Family Dwellings (A B C & D)
G) Loans On Manufactured Home Dwelling (A B C & D)
Number
Average Value
Number
Average Value
Number
Average Value
Number
Average Value
Number
Average Value
Number
Average Value
LOANS ORIGINATED
12
$166,715
94
$87,289
270
$128,018
66
$57,101
46
$56,027
153
$49,975
APPLICATIONS APPROVED, NOT ACCEPTED
1
$266,670
8
$133,216
17
$153,448
1
$20,920
1
$134,940
9
$77,356
APPLICATIONS DENIED
1
$151,130
34
$89,284
125
$136,957
20
$32,560
9
$54,500
62
$82,102
APPLICATIONS WITHDRAWN
1
$130,720
4
$163,042
46
$146,007
3
$31,810
0
$0
7
$92,487
FILES CLOSED FOR INCOMPLETENESS
0
$0
1
$103,900
12
$120,366
0
$0
3
$52,287
3
$118,297
Aggregated Statistics For Year 2007 (Based on 4 partial tracts)
A) FHA, FSA/RHS & VA Home Purchase Loans
B) Conventional Home Purchase Loans
C) Refinancings
D) Home Improvement Loans
E) Loans on Dwellings For 5+ Families
F) Non-occupant Loans on < 5 Family Dwellings (A B C & D)
G) Loans On Manufactured Home Dwelling (A B C & D)
Number
Average Value
Number
Average Value
Number
Average Value
Number
Average Value
Number
Average Value
Number
Average Value
Number
Average Value
LOANS ORIGINATED
7
$138,281
138
$109,792
276
$125,740
46
$51,257
1
$140,340
41
$98,625
152
$47,396
APPLICATIONS APPROVED, NOT ACCEPTED
0
$0
19
$120,324
24
$133,124
1
$332,030
0
$0
1
$74,510
11
$72,100
APPLICATIONS DENIED
1
$260,130
30
$113,132
114
$156,193
15
$79,898
1
$6,540
3
$126,167
39
$74,013
APPLICATIONS WITHDRAWN
0
$0
12
$147,441
48
$151,519
3
$59,260
0
$0
1
$145,100
1
$118,960
FILES CLOSED FOR INCOMPLETENESS
0
$0
4
$176,325
12
$139,546
1
$75,570
0
$0
0
$0
1
$75,570
Aggregated Statistics For Year 2006 (Based on 4 partial tracts)
A) FHA, FSA/RHS & VA Home Purchase Loans
B) Conventional Home Purchase Loans
C) Refinancings
D) Home Improvement Loans
F) Non-occupant Loans on < 5 Family Dwellings (A B C & D)
G) Loans On Manufactured Home Dwelling (A B C & D)
Number
Average Value
Number
Average Value
Number
Average Value
Number
Average Value
Number
Average Value
Number
Average Value
LOANS ORIGINATED
1
$139,870
162
$100,491
213
$114,667
34
$54,489
50
$59,091
131
$41,046
APPLICATIONS APPROVED, NOT ACCEPTED
1
$236,600
32
$110,837
26
$112,114
1
$32,680
3
$138,987
25
$80,796
APPLICATIONS DENIED
1
$162,090
59
$96,785
99
$134,886
16
$36,030
9
$133,973
46
$62,420
APPLICATIONS WITHDRAWN
0
$0
19
$134,701
50
$126,726
1
$39,220
5
$121,952
11
$78,460
FILES CLOSED FOR INCOMPLETENESS
0
$0
1
$303,620
17
$106,779
0
$0
0
$0
0
$0
Aggregated Statistics For Year 2005 (Based on 4 partial tracts)
A) FHA, FSA/RHS & VA Home Purchase Loans
B) Conventional Home Purchase Loans
C) Refinancings
D) Home Improvement Loans
F) Non-occupant Loans on < 5 Family Dwellings (A B C & D)
G) Loans On Manufactured Home Dwelling (A B C & D)
Number
Average Value
Number
Average Value
Number
Average Value
Number
Average Value
Number
Average Value
Number
Average Value
LOANS ORIGINATED
1
$107,190
147
$85,794
204
$94,679
44
$45,195
52
$60,441
112
$39,612
APPLICATIONS APPROVED, NOT ACCEPTED
0
$0
20
$89,276
20
$95,100
1
$39,220
3
$175,163
12
$52,602
APPLICATIONS DENIED
3
$32,370
63
$67,957
90
$109,323
14
$22,036
0
$0
66
$59,507
APPLICATIONS WITHDRAWN
1
$220,920
23
$113,273
83
$117,383
5
$214,620
3
$161,757
17
$64,425
FILES CLOSED FOR INCOMPLETENESS
0
$0
5
$77,724
29
$125,994
0
$0
0
$0
1
$151,640
Aggregated Statistics For Year 2004 (Based on 4 partial tracts)
A) FHA, FSA/RHS & VA Home Purchase Loans
B) Conventional Home Purchase Loans
C) Refinancings
D) Home Improvement Loans
E) Loans on Dwellings For 5+ Families
F) Non-occupant Loans on < 5 Family Dwellings (A B C & D)
G) Loans On Manufactured Home Dwelling (A B C & D)
Number
Average Value
Number
Average Value
Number
Average Value
Number
Average Value
Number
Average Value
Number
Average Value
Number
Average Value
LOANS ORIGINATED
3
$116,637
144
$79,102
221
$90,474
26
$32,283
1
$152,940
40
$54,103
108
$38,704
APPLICATIONS APPROVED, NOT ACCEPTED
1
$132,240
16
$84,341
11
$63,677
1
$24,840
0
$0
0
$0
13
$63,245
APPLICATIONS DENIED
0
$0
50
$69,310
107
$89,933
25
$44,983
0
$0
7
$100,349
52
$53,082
APPLICATIONS WITHDRAWN
0
$0
4
$136,930
47
$98,079
3
$26,580
0
$0
4
$73,858
3
$48,367
FILES CLOSED FOR INCOMPLETENESS
0
$0
1
$150,330
20
$121,106
0
$0
0
$0
0
$0
7
$82,354
Aggregated Statistics For Year 2003 (Based on 4 partial tracts)
A) FHA, FSA/RHS & VA Home Purchase Loans
B) Conventional Home Purchase Loans
C) Refinancings
D) Home Improvement Loans
F) Non-occupant Loans on < 5 Family Dwellings (A B C & D)
Number
Average Value
Number
Average Value
Number
Average Value
Number
Average Value
Number
Average Value
LOANS ORIGINATED
3
$38,343
146
$75,711
349
$102,389
24
$61,163
41
$46,679
APPLICATIONS APPROVED, NOT ACCEPTED
1
$50,980
16
$44,814
64
$99,878
0
$0
5
$70,538
APPLICATIONS DENIED
7
$44,819
85
$59,326
177
$93,218
12
$34,152
12
$73,643
APPLICATIONS WITHDRAWN
0
$0
15
$146,417
66
$96,005
1
$6,540
3
$47,930
FILES CLOSED FOR INCOMPLETENESS
0
$0
0
$0
7
$76,564
0
$0
0
$0
Aggregated Statistics For Year 2002 (Based on 4 partial tracts)
A) FHA, FSA/RHS & VA Home Purchase Loans
B) Conventional Home Purchase Loans
C) Refinancings
D) Home Improvement Loans
F) Non-occupant Loans on < 5 Family Dwellings (A B C & D)
Number
Average Value
Number
Average Value
Number
Average Value
Number
Average Value
Number
Average Value
LOANS ORIGINATED
5
$84,184
107
$66,116
296
$90,680
25
$34,166
32
$29,588
APPLICATIONS APPROVED, NOT ACCEPTED
0
$0
33
$37,825
37
$91,971
0
$0
1
$88,890
APPLICATIONS DENIED
4
$73,500
109
$47,470
134
$98,216
12
$13,884
1
$108,500
APPLICATIONS WITHDRAWN
0
$0
9
$75,851
66
$99,494
1
$52,290
1
$128,110
FILES CLOSED FOR INCOMPLETENESS
0
$0
4
$72,615
15
$123,106
0
$0
1
$115,030
Aggregated Statistics For Year 2001 (Based on 4 partial tracts)
A) FHA, FSA/RHS & VA Home Purchase Loans
B) Conventional Home Purchase Loans
C) Refinancings
D) Home Improvement Loans
F) Non-occupant Loans on < 5 Family Dwellings (A B C & D)
Number
Average Value
Number
Average Value
Number
Average Value
Number
Average Value
Number
Average Value
LOANS ORIGINATED
8
$111,278
127
$62,771
271
$93,867
16
$29,549
23
$26,348
APPLICATIONS APPROVED, NOT ACCEPTED
1
$165,980
29
$43,190
41
$63,344
0
$0
3
$61,003
APPLICATIONS DENIED
4
$84,640
103
$52,903
136
$72,825
8
$8,650
8
$45,061
APPLICATIONS WITHDRAWN
3
$91,067
12
$79,908
57
$82,918
3
$20,917
0
$0
FILES CLOSED FOR INCOMPLETENESS
0
$0
4
$93,750
8
$93,234
3
$28,843
0
$0
Aggregated Statistics For Year 2000 (Based on 4 partial tracts)
A) FHA, FSA/RHS & VA Home Purchase Loans
B) Conventional Home Purchase Loans
C) Refinancings
D) Home Improvement Loans
F) Non-occupant Loans on < 5 Family Dwellings (A B C & D)
Number
Average Value
Number
Average Value
Number
Average Value
Number
Average Value
Number
Average Value
LOANS ORIGINATED
3
$90,633
150
$54,133
123
$62,025
28
$23,708
24
$26,142
APPLICATIONS APPROVED, NOT ACCEPTED
13
$47,413
62
$56,073
21
$71,475
1
$20,240
4
$45,752
APPLICATIONS DENIED
16
$43,491
186
$44,421
112
$60,141
9
$21,173
5
$31,634
APPLICATIONS WITHDRAWN
4
$83,660
15
$64,065
42
$57,479
0
$0
0
$0
FILES CLOSED FOR INCOMPLETENESS
0
$0
0
$0
13
$57,268
0
$0
0
$0
Aggregated Statistics For Year 1999 (Based on 2 partial tracts)
A) FHA, FSA/RHS & VA Home Purchase Loans
B) Conventional Home Purchase Loans
C) Refinancings
D) Home Improvement Loans
F) Non-occupant Loans on < 5 Family Dwellings (A B C & D)
Detailed PMIC statistics for the following Tracts:0801.00
, 0802.00
2003 - 2018 National Fire Incident Reporting System (NFIRS) incidents
According to the data from the years 2003 - 2018 the average number of fire incidents per year is 31. The highest number of fires - 59 took place in 2017, and the least - 4 in 2006. The data has an increasing trend.
When looking into fire subcategories, the most reports belonged to: Outside Fires (59.8%), and Structure Fires (23.5%).
Fire incident types reported to NFIRS in Zip Code 29544


 Nearest zip codes: 29546, 29519, 29511, 29527, 29574, 29555.
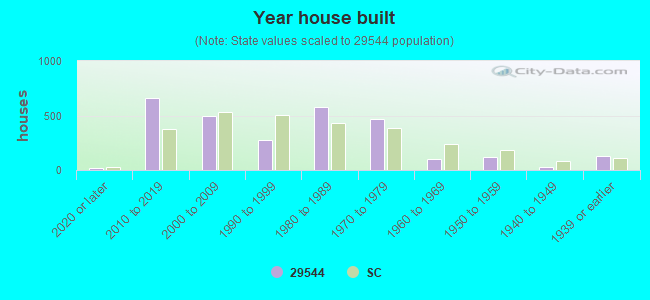


 (Students: 516, Location: 3011 NICHOLS HIGHWAY, Grades: PK-5)
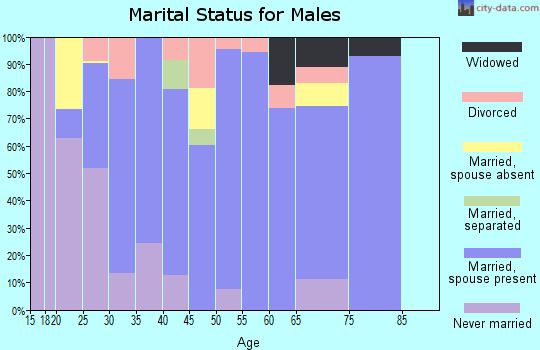
 According to the data from the years 2003 - 2018 the average number of fire incidents per year is 31. The highest number of fires - 59 took place in 2017, and the least - 4 in 2006. The data has an increasing trend.
 When looking into fire subcategories, the most reports belonged to: Outside Fires (59.8%), and Structure Fires (23.5%).