Estimated zip code population in 2022: 4,689 Zip code population in 2010: 5,467 Zip code population in 2000: 5,212
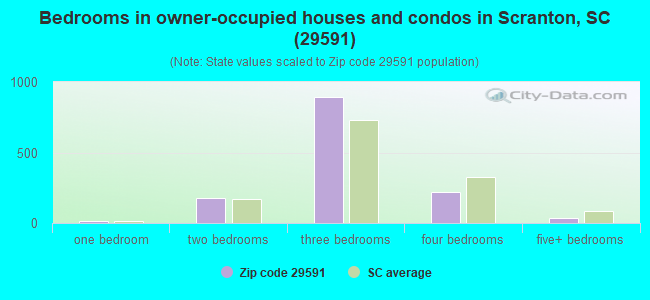
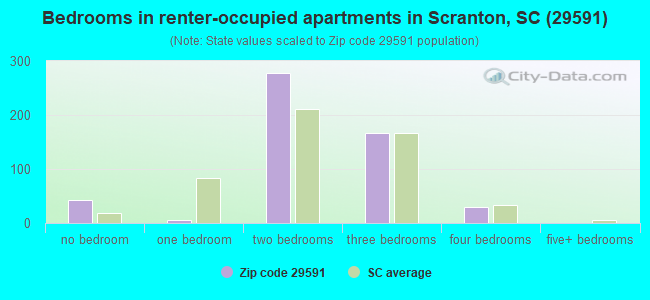
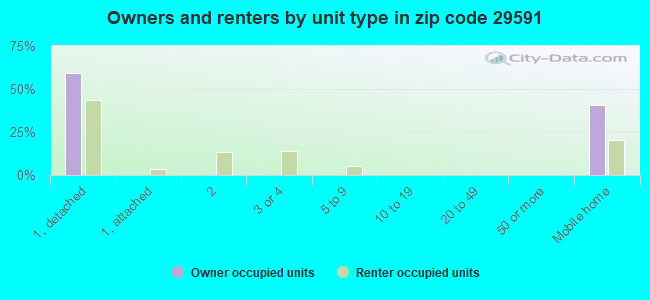
Houses and condos: 2,196 Renter-occupied apartments: 526
% of renters here:
28%
State:
28%
March 2022 cost of living index in zip code 29591: 78.4 (low, U.S. average is 100)
Land area: 72.4 sq. mi. Water area: 0.0 sq. mi.
Population density: 65 people per square mile
(very low).
OSM Map
General Map
Google Map
MSN Map
OSM Map
General Map
Google Map
MSN Map
OSM Map
General Map
Google Map
MSN Map
OSM Map
General Map
Google Map
MSN Map
Please wait while loading the map...
Real estate property taxes paid for housing units in 2022:
This zip code:
0.7% ($567)
South Carolina:
0.5% ($1,185)
Median real estate property taxes paid for housing units with mortgages in 2022: $823 (0.5%) Median real estate property taxes paid for housing units with no mortgage in 2022: $536 (0.8%)
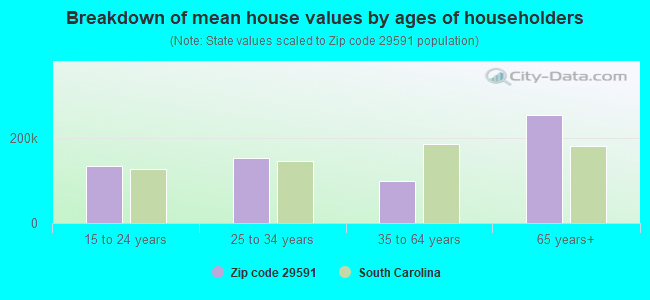
Estimated median house/condo value in 2022: $83,611
29591:
$83,611
South Carolina:
$254,600
According to our research of South Carolina and other state lists, there was 1 registered sex offender living in 29591 zip code as of April 27, 2024. The ratio of all residents to sex offenders in zip code 29591 is 4,931 to 1. The ratio of registered sex offenders to all residents in this zip code is much lower than the state average.
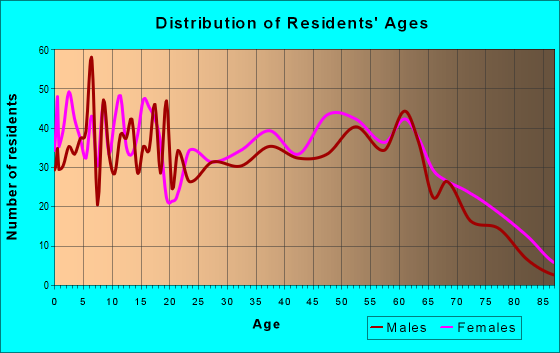
Median resident age:
This zip code:
44.2 years
South Carolina median age:
40.5 years
Average household size:
This zip code:
2.5 people
South Carolina:
2.4 people
Averages for the 2020 tax year for zip code 29591, filed in 2021:
Average Adjusted Gross Income (AGI) in 2020: $44,002 (Individual Income Tax Returns)
Here:
$44,002
State:
$65,754
Salary/wage: $40,819 (reported on 83.4% of returns)
Here:
$40,819
State:
$52,566
(% of AGI for various income ranges: 1262.0% for AGIs below $25k, 4036.0% for AGIs $25k-50k, 8003.7% for AGIs $50k-75k, 10970.0% for AGIs $75k-100k, 20294.0% for AGIs $100k-200k)
Taxable interest for individuals: $608 (reported on 13.5% of returns)
This zip code:
$608
South Carolina:
$1,749
(% of AGI for various income ranges: 6.9% for AGIs below $25k, 9.0% for AGIs $25k-50k, 16.2% for AGIs $50k-75k, 8.8% for AGIs $75k-100k, 47.0% for AGIs $100k-200k)
Ordinary dividends: $3,560 (reported on 7.8% of returns)
Here:
$3,560
State:
$8,783
(% of AGI for various income ranges: 12.6% for AGIs below $25k, 13.8% for AGIs $25k-50k, 65.6% for AGIs $50k-75k, 297.0% for AGIs $100k-200k)
Net capital gain/loss in AGI: +$4,600 (reported on 6.7% of returns)
Here:
+$4,600
State:
+$24,194
(% of AGI for various income ranges: 3.9% for AGIs below $25k, 20.0% for AGIs $25k-50k, 213.8% for AGIs $50k-75k, 152.0% for AGIs $100k-200k)
Profit/loss from business: +$7,321 (reported on 15.0% of returns)
Here:
+$7,321
State:
+$11,253
(% of AGI for various income ranges: 134.9% for AGIs below $25k, 67.0% for AGIs $25k-50k, 208.8% for AGIs $50k-75k, 698.0% for AGIs $100k-200k)
Taxable individual retirement arrangement distribution: $15,008 (reported on 6.2% of returns)
29591:
$15,008
South Carolina:
$21,604
(% of AGI for various income ranges: 36.1% for AGIs below $25k, 73.0% for AGIs $25k-50k, 373.1% for AGIs $50k-75k, 692.0% for AGIs $100k-200k)
Total itemized deductions: $30,100 (reported on 3.1% of returns)
Here:
$30,100
State:
$35,199
(% of AGI for various income ranges: 456.2% for AGIs $50k-75k, 1076.0% for AGIs $100k-200k)
Charity contributions: $13,750 (reported on 3.1% of returns)
Here:
$13,750
State:
$14,319
(% of AGI for various income ranges: 44.8% for AGIs $25k-50k, 646.0% for AGIs $100k-200k)
Taxes paid: $6,900 (reported on 3.1% of returns)
29591:
$6,900
State:
$7,486
(% of AGI for various income ranges: 108.7% for AGIs $50k-75k, 240.0% for AGIs $100k-200k)
Earned income credit: $2,640 (reported on 26.9% of returns)
Here:
$2,640
State:
$2,397
(% of AGI for various income ranges: 157.0% for AGIs below $25k, 103.8% for AGIs $25k-50k)
Percentage of individuals using paid preparers for their 2020 taxes: 94.3%
Here:
94%
State:
93%
(% for various income ranges: 95.1% for AGIs below $25k, 92.5% for AGIs $25k-50k, 96.2% for AGIs $50k-75k, 92.3% for AGIs $75k-100k, 94.1% for AGIs $100k-200k, 100.0% for AGIs over 200k)
Averages for the 2012 tax year for zip code 29591, filed in 2013:
Average Adjusted Gross Income (AGI) in 2012: $35,192 (Individual Income Tax Returns)
Here:
$35,192
State:
$51,133
Salary/wage: $31,824 (reported on 86.3% of returns)
Here:
$31,824
State:
$42,173
(% of AGI for various income ranges: 77.0% for AGIs below $25k, 87.7% for AGIs $25k-50k, 80.6% for AGIs $50k-75k, 80.2% for AGIs $75k-100k, 62.9% for AGIs $100k-200k)
Taxable interest for individuals: $665 (reported on 18.8% of returns)
This zip code:
$665
South Carolina:
$1,468
(% of AGI for various income ranges: 0.6% for AGIs below $25k, 0.1% for AGIs $25k-50k, 0.2% for AGIs $50k-75k, 0.4% for AGIs $75k-100k, 0.5% for AGIs $100k-200k)
Ordinary dividends: $1,812 (reported on 8.1% of returns)
Here:
$1,812
State:
$6,511
(% of AGI for various income ranges: 0.9% for AGIs below $25k, 0.3% for AGIs $25k-50k, 0.2% for AGIs $50k-75k, 0.6% for AGIs $100k-200k)
Net capital gain/loss in AGI: +$4,147 (reported on 7.6% of returns)
Here:
+$4,147
State:
+$13,061
(% of AGI for various income ranges: 0.2% for AGIs below $25k, 0.2% for AGIs $25k-50k, 0.8% for AGIs $50k-75k, 3.1% for AGIs $100k-200k)
Profit/loss from business: +$6,969 (reported on 14.7% of returns)
Here:
+$6,969
State:
+$10,167
(% of AGI for various income ranges: 7.9% for AGIs below $25k, 1.0% for AGIs $25k-50k, 3.3% for AGIs $50k-75k, 3.5% for AGIs $75k-100k)
Taxable individual retirement arrangement distribution: $12,490 (reported on 5.1% of returns)
29591:
$12,490
South Carolina:
$17,019
(% of AGI for various income ranges: 2.1% for AGIs below $25k, 2.6% for AGIs $25k-50k, 5.1% for AGIs $75k-100k)
Total itemized deductions: $18,248 (23% of AGI, reported on 16.8% of returns)
Here:
$18,248
State:
$22,890
Here:
23.5% of AGI
State:
21.4% of AGI
(% of AGI for various income ranges: 3.3% for AGIs below $25k, 7.0% for AGIs $25k-50k, 9.6% for AGIs $50k-75k, 11.7% for AGIs $75k-100k, 12.9% for AGIs $100k-200k)
Charity contributions: $5,714 (reported on 14.2% of returns)
Here:
$5,714
State:
$5,169
(% of AGI for various income ranges: 0.7% for AGIs below $25k, 1.2% for AGIs $25k-50k, 2.6% for AGIs $50k-75k, 3.2% for AGIs $75k-100k, 4.3% for AGIs $100k-200k)
Taxes paid: $5,258 (reported on 16.8% of returns)
29591:
$5,258
State:
$7,644
(% of AGI for various income ranges: 0.5% for AGIs below $25k, 1.2% for AGIs $25k-50k, 2.5% for AGIs $50k-75k, 3.3% for AGIs $75k-100k, 5.5% for AGIs $100k-200k)
Earned income credit: $2,626 (reported on 33.0% of returns)
Here:
$2,626
State:
$2,418
(% of AGI for various income ranges: 11.0% for AGIs below $25k, 1.4% for AGIs $25k-50k)
Percentage of individuals using paid preparers for their 2012 taxes: 67.0%
Here:
67%
State:
57%
(% for various income ranges: 68.3% for AGIs below $25k, 60.4% for AGIs $25k-50k, 68.2% for AGIs $50k-75k, 72.7% for AGIs $75k-100k, 80.0% for AGIs $100k-200k)
Averages for the 2004 tax year for zip code 29591, filed in 2005:
Average Adjusted Gross Income (AGI) in 2004: $29,039 (Individual Income Tax Returns)
Here:
$29,039
State:
$41,965
Salary/wage: $27,781 (reported on 88.1% of returns)
Here:
$27,781
State:
$35,695
(% of AGI for various income ranges: 84.0% for AGIs below $10k, 82.7% for AGIs $10k-25k, 89.1% for AGIs $25k-50k, 87.6% for AGIs $50k-75k, 84.4% for AGIs $75k-100k, 65.6% for AGIs over 100k)
Taxable interest for individuals: $795 (reported on 21.6% of returns)
This zip code:
$795
South Carolina:
$1,623
(% of AGI for various income ranges: 1.3% for AGIs below $10k, 0.8% for AGIs $10k-25k, 0.7% for AGIs $25k-50k, 0.2% for AGIs $50k-75k, 0.7% for AGIs $75k-100k, 0.3% for AGIs over 100k)
Taxable dividends: $1,766 (reported on 9.4% of returns)
Here:
$1,766
State:
$3,999
(% of AGI for various income ranges: 0.4% for AGIs below $10k, 0.6% for AGIs $10k-25k, 0.3% for AGIs $25k-50k, 0.2% for AGIs $50k-75k, 0.2% for AGIs $75k-100k, 2.4% for AGIs over 100k)
Net capital gain/loss: +$960 (reported on 6.4% of returns)
Here:
+$960
State:
+$13,100
(% of AGI for various income ranges: -0.7% for AGIs below $10k, 0.1% for AGIs $10k-25k, 0.6% for AGIs $25k-50k, -0.2% for AGIs $50k-75k, 1.0% for AGIs $75k-100k, -0.3% for AGIs over 100k)
Profit/loss from business: +$5,694 (reported on 16.0% of returns)
Here:
+$5,694
State:
+$9,144
(% of AGI for various income ranges: 7.0% for AGIs below $10k, 5.9% for AGIs $10k-25k, 2.5% for AGIs $25k-50k, 2.6% for AGIs $50k-75k, 2.7% for AGIs $75k-100k)
Profit/loss from farming: +$31 (reported on 1.6% of returns)
Here:
+$31
State:
-$4,882
IRA payment deduction: $2,850 (reported on 1.0% of returns)
29591:
$2,850
South Carolina:
$2,972
Total itemized deductions: $14,869 (24% of AGI, reported on 16.7% of returns)
Here:
$14,869
State:
$19,039
Here:
23.9% of AGI
State:
22.8% of AGI
(% of AGI for various income ranges: 4.4% for AGIs $10k-25k, 7.7% for AGIs $25k-50k, 10.6% for AGIs $50k-75k, 14.1% for AGIs $75k-100k, 12.6% for AGIs over 100k)
Charity contributions deductions: $4,367 (7% of AGI, reported on 14.4% of returns)
Here:
$4,367
State:
$4,305
Here:
6.7% of AGI
State:
5.0% of AGI
(% of AGI for various income ranges: 0.8% for AGIs $10k-25k, 1.7% for AGIs $25k-50k, 2.8% for AGIs $50k-75k, 3.1% for AGIs $75k-100k, 4.7% for AGIs over 100k)
Total tax: $3,431 (reported on 63.8% of returns)
29591:
$3,431
State:
$6,497
(% of AGI for various income ranges: 2.7% for AGIs below $10k, 3.2% for AGIs $10k-25k, 6.1% for AGIs $25k-50k, 8.2% for AGIs $50k-75k, 10.3% for AGIs $75k-100k, 17.7% for AGIs over 100k)
Earned income credit: $2,093 (reported on 33.5% of returns)
Here:
$2,093
State:
$1,882
Percentage of individuals using paid preparers for their 2004 taxes: 74.7%
Here:
75%
State:
66%
(% for various income ranges: 71.1% for AGIs below $10k, 77.7% for AGIs $10k-25k, 74.2% for AGIs $25k-50k, 69.8% for AGIs $50k-75k, 78.6% for AGIs $75k-100k, 89.5% for AGIs over 100k)
Household received Food Stamps/SNAP in the past 12 months: 355 Household did not receive Food Stamps/SNAP in the past 12 months: 1,519
Women who had a birth in the past 12 months: 15 (9 now married, 5 unmarried) Women who did not have a birth in the past 12 months: 1,060 (437 now married, 622 unmarried)
Housing units in zip code 29591 with a mortgage: 430 (25 second mortgage, 13 both second mortgage and home equity loan) Median monthly owner costs for units with a mortgage: $1,073 Median monthly owner costs for units without a mortgage: $398
Residents with income below the poverty level in 2022:
This zip code:
22.4%
Whole state:
14.0%
Residents with income below 50% of the poverty level in 2022:
This zip code:
12.8%
Whole state:
7.3%
Median number of rooms in houses and condos:
Here:
5.8
State:
6.4
Median number of rooms in apartments:
Here:
5.0
State:
4.5
Notable locations in this zip code not listed on our city pages
Notable locations in zip code 29591: Scranton Fire Department (A), South Lynches Fire Department Station 3 (B), South Lynches Fire Department Station 6 (C), Scranton Police Department (D). Display/hide their locations on the map
Churches in zip code 29591 include: Pleasant Grove Church (A), Saint Paul Church (B), Savannah Grove Baptist Church (C), Camp Branch Oris Free Will Baptist Church (D), Beulah Church (E), Salem Church (F), Camp Branch Pentecostal Holiness Church (G), Gilead Freewill Baptist Church (H), High Hill Church (I). Display/hide their locations on the map
448 married couples with children.
207 single-parent households (65 men, 142 women).
98.0% of residents of 29591 zip code speak English at home.
0.9% of residents speak Spanish at home (90% very well, 10% not at all).
0.8% of residents speak other Indo-European language at home (100% very well).
0.2% of residents speak other language at home (100% very well).
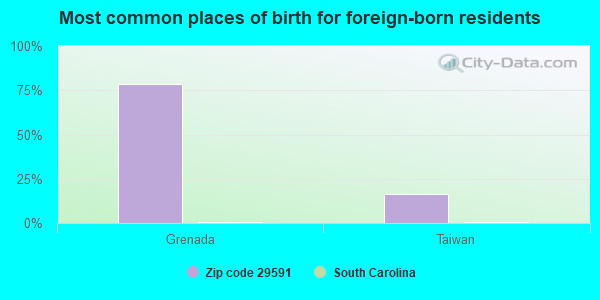
Foreign born population: 37 (0.8%) (57.8% of them are naturalized citizens)
This zip code:
0.8%
Whole state:
5.2%
78%Grenada
16%Taiwan
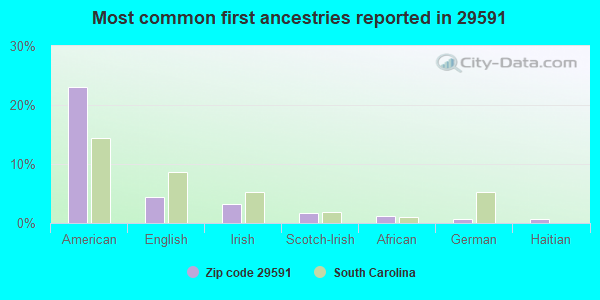
23%American
4%English
3%Irish
2%Scotch-Irish
1%African
1%German
1%Haitian
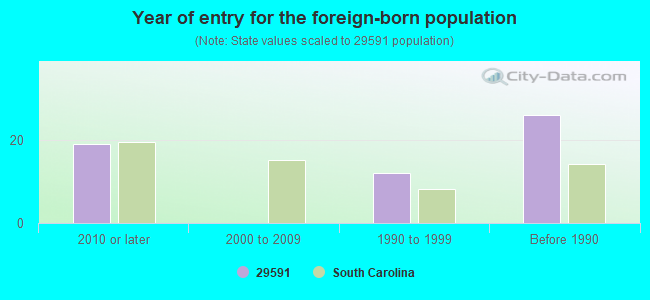
Year of entry for the foreign-born population
192010 or later
02000 to 2009
121990 to 1999
26Before 1990
Housing units lacking complete plumbing facilities: 4.9% Housing units lacking complete kitchen facilities: 2.9%
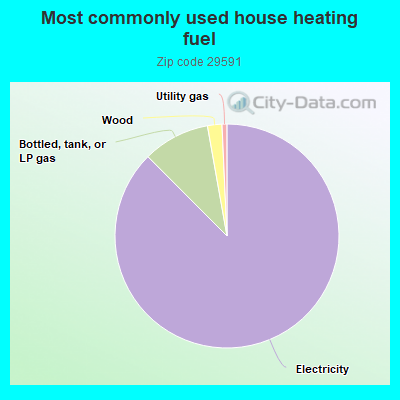
87.7%Electricity
9.7%Bottled, tank, or LP gas
2.1%Wood
0.7%Utility gas
Population in 1990: 4,122. Population change in the 1990s: +1,090 (+26.4%).
Place of birth for U.S.-born residents:
This state: 3,913
Northeast: 258
Midwest: 70
South: 282
West: 17
68% of the 29591 zip code residents lived in the same house 5 years ago. Out of people who lived in different houses, 63% lived in this county. Out of people who lived in different counties, 50% lived in South Carolina.
90% of the 29591 zip code residents lived in the same house 1 year ago. Out of people who lived in different houses, 52% moved from this county. Out of people who lived in different houses, 20% moved from different county within same state. Out of people who lived in different houses, 23% moved from different state.
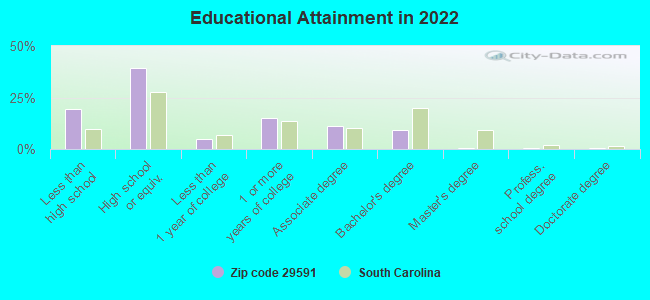
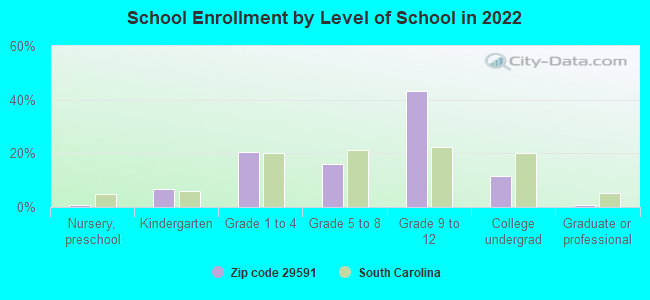
Private vs. public school enrollment:
Students in private schools in grades 1 to 8 (elementary and middle school): 125
Here:
38.0%
South Carolina:
14.4%
Students in private schools in grades 9 to 12 (high school): 86
Here:
23.1%
South Carolina:
11.1%
Students in private undergraduate colleges:
Here:
0.0%
South Carolina:
21.9%
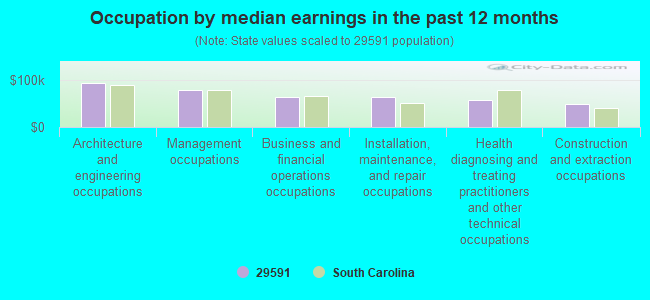
Occupation by median earnings in the past 12 months ($)
94,465Architecture and engineering occupations
79,951Management occupations
64,399Business and financial operations occupations
63,707Installation, maintenance, and repair occupations
57,926Health diagnosing and treating practitioners and other technical occupations
49,787Construction and extraction occupations
Top industries in this zip code by the number of employees in 2005:
Wholesale Trade: General Line Grocery Merchant Wholesalers (250-499 employees: 1 establishment)
Health Care and Social Assistance: Nursing Care Facilities (50-99: 1)
Accommodation and Food Services: Limited-Service Restaurants (10-19: 1, 1-4: 1)
Wholesale Trade: Recyclable Material Merchant Wholesalers (10-19: 1)
Administrative and Support and Waste Management and Remediation Services: Temporary Help Services (10-19: 1)
Accommodation and Food Services: Full-Service Restaurants (5-9: 1, 1-4: 2)
People in group quarters in 2010:
87 people in nursing facilities/skilled-nursing facilities
People in group quarters in 2000:
118 people in nursing homes
29 people in other noninstitutional group quarters
Fatal accident statistics in 2014:
Fatal accident count: 1
Vehicles involved in fatal accidents: 1
Fatal accidents caused by drunken drivers: 1
Fatalities: 1
Persons involved in fatal accidents: 1
Pedestrians involved in fatal accidents: 0
Fatal accident statistics in 2013:
Fatal accident count: 1
Vehicles involved in fatal accidents: 2
Fatal accidents caused by drunken drivers: 0
Fatalities: 1
Persons involved in fatal accidents: 4
Pedestrians involved in fatal accidents: 0
Home Mortgage Disclosure Act Aggregated Statistics For Year 2009 (Based on 8 partial tracts)
A) FHA, FSA/RHS & VA Home Purchase Loans
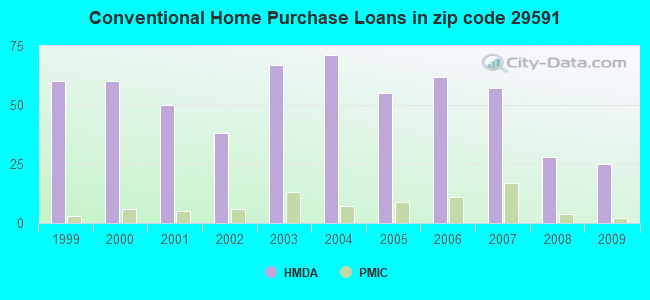
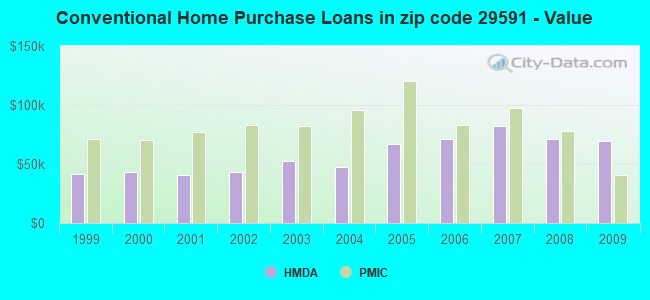
B) Conventional Home Purchase Loans
C) Refinancings
D) Home Improvement Loans
F) Non-occupant Loans on < 5 Family Dwellings (A B C & D)
G) Loans On Manufactured Home Dwelling (A B C & D)
Number
Average Value
Number
Average Value
Number
Average Value
Number
Average Value
Number
Average Value
Number
Average Value
LOANS ORIGINATED
10
$76,406
25
$69,586
59
$116,669
22
$17,750
13
$48,403
28
$33,235
APPLICATIONS APPROVED, NOT ACCEPTED
1
$56,630
2
$47,720
4
$120,135
0
$0
1
$81,980
4
$46,350
APPLICATIONS DENIED
4
$95,592
13
$52,908
35
$102,601
8
$31,691
1
$274,410
13
$35,097
APPLICATIONS WITHDRAWN
2
$72,800
1
$129,800
19
$111,431
0
$0
0
$0
1
$89,940
FILES CLOSED FOR INCOMPLETENESS
3
$88,507
0
$0
7
$127,551
0
$0
0
$0
0
$0
Aggregated Statistics For Year 2008 (Based on 8 partial tracts)
A) FHA, FSA/RHS & VA Home Purchase Loans
B) Conventional Home Purchase Loans
C) Refinancings
D) Home Improvement Loans
F) Non-occupant Loans on < 5 Family Dwellings (A B C & D)
G) Loans On Manufactured Home Dwelling (A B C & D)
Number
Average Value
Number
Average Value
Number
Average Value
Number
Average Value
Number
Average Value
Number
Average Value
LOANS ORIGINATED
10
$85,920
28
$71,320
66
$90,445
29
$25,221
19
$44,604
35
$34,952
APPLICATIONS APPROVED, NOT ACCEPTED
0
$0
4
$65,372
9
$82,648
2
$17,090
1
$57,900
6
$60,465
APPLICATIONS DENIED
2
$132,600
24
$53,676
56
$94,035
17
$22,987
1
$70,200
27
$47,239
APPLICATIONS WITHDRAWN
1
$104,640
1
$29,230
19
$115,466
0
$0
0
$0
1
$12,260
FILES CLOSED FOR INCOMPLETENESS
1
$91,510
2
$81,820
1
$105,840
0
$0
0
$0
0
$0
Aggregated Statistics For Year 2007 (Based on 8 partial tracts)
A) FHA, FSA/RHS & VA Home Purchase Loans
B) Conventional Home Purchase Loans
C) Refinancings
D) Home Improvement Loans
E) Loans on Dwellings For 5+ Families
F) Non-occupant Loans on < 5 Family Dwellings (A B C & D)
G) Loans On Manufactured Home Dwelling (A B C & D)
Number
Average Value
Number
Average Value
Number
Average Value
Number
Average Value
Number
Average Value
Number
Average Value
Number
Average Value
LOANS ORIGINATED
1
$112,940
57
$82,185
64
$85,441
30
$28,085
0
$0
21
$62,955
39
$45,229
APPLICATIONS APPROVED, NOT ACCEPTED
1
$17,560
11
$62,965
10
$85,277
1
$32,680
0
$0
1
$39,690
8
$57,252
APPLICATIONS DENIED
0
$0
54
$76,287
73
$92,001
19
$19,171
0
$0
5
$68,104
36
$45,997
APPLICATIONS WITHDRAWN
0
$0
9
$97,480
21
$115,038
1
$19,120
2
$182,090
1
$48,700
2
$57,685
FILES CLOSED FOR INCOMPLETENESS
0
$0
6
$122,470
6
$200,892
0
$0
0
$0
0
$0
0
$0
Aggregated Statistics For Year 2006 (Based on 8 partial tracts)
A) FHA, FSA/RHS & VA Home Purchase Loans
B) Conventional Home Purchase Loans
C) Refinancings
D) Home Improvement Loans
F) Non-occupant Loans on < 5 Family Dwellings (A B C & D)
G) Loans On Manufactured Home Dwelling (A B C & D)
Number
Average Value
Number
Average Value
Number
Average Value
Number
Average Value
Number
Average Value
Number
Average Value
LOANS ORIGINATED
3
$99,810
62
$71,262
71
$75,230
31
$23,203
19
$77,212
49
$36,226
APPLICATIONS APPROVED, NOT ACCEPTED
0
$0
8
$52,994
9
$80,536
3
$23,883
1
$73,610
6
$54,168
APPLICATIONS DENIED
1
$42,950
57
$62,218
79
$75,912
16
$22,461
4
$62,200
38
$42,854
APPLICATIONS WITHDRAWN
0
$0
7
$104,846
39
$97,675
1
$18,760
0
$0
7
$51,706
FILES CLOSED FOR INCOMPLETENESS
1
$41,390
4
$98,282
11
$122,127
0
$0
1
$61,040
1
$120,230
Aggregated Statistics For Year 2005 (Based on 8 partial tracts)
A) FHA, FSA/RHS & VA Home Purchase Loans
B) Conventional Home Purchase Loans
C) Refinancings
D) Home Improvement Loans
F) Non-occupant Loans on < 5 Family Dwellings (A B C & D)
G) Loans On Manufactured Home Dwelling (A B C & D)
Number
Average Value
Number
Average Value
Number
Average Value
Number
Average Value
Number
Average Value
Number
Average Value
LOANS ORIGINATED
5
$76,738
55
$66,764
83
$73,535
19
$19,730
28
$49,203
39
$31,495
APPLICATIONS APPROVED, NOT ACCEPTED
1
$70,710
11
$91,177
27
$60,447
2
$24,835
0
$0
10
$49,059
APPLICATIONS DENIED
3
$65,480
58
$57,488
89
$82,140
20
$28,325
3
$54,020
50
$45,704
APPLICATIONS WITHDRAWN
0
$0
17
$94,062
29
$93,337
6
$93,395
1
$391,340
8
$66,790
FILES CLOSED FOR INCOMPLETENESS
0
$0
1
$50,290
12
$101,710
1
$25,820
1
$67,230
1
$73,580
Aggregated Statistics For Year 2004 (Based on 8 partial tracts)
A) FHA, FSA/RHS & VA Home Purchase Loans
B) Conventional Home Purchase Loans
C) Refinancings
D) Home Improvement Loans
F) Non-occupant Loans on < 5 Family Dwellings (A B C & D)
G) Loans On Manufactured Home Dwelling (A B C & D)
Number
Average Value
Number
Average Value
Number
Average Value
Number
Average Value
Number
Average Value
Number
Average Value
LOANS ORIGINATED
2
$117,110
71
$47,129
118
$74,827
32
$21,429
23
$43,250
69
$35,639
APPLICATIONS APPROVED, NOT ACCEPTED
1
$64,370
14
$54,186
26
$69,720
2
$28,860
2
$31,470
12
$50,425
APPLICATIONS DENIED
0
$0
43
$58,413
71
$71,767
21
$30,788
2
$60,360
32
$41,405
APPLICATIONS WITHDRAWN
0
$0
8
$73,241
35
$86,051
2
$47,045
1
$37,350
7
$45,494
FILES CLOSED FOR INCOMPLETENESS
0
$0
4
$76,900
10
$81,379
1
$28,010
0
$0
3
$76,260
Aggregated Statistics For Year 2003 (Based on 8 partial tracts)
A) FHA, FSA/RHS & VA Home Purchase Loans
B) Conventional Home Purchase Loans
C) Refinancings
D) Home Improvement Loans
E) Loans on Dwellings For 5+ Families
F) Non-occupant Loans on < 5 Family Dwellings (A B C & D)
Number
Average Value
Number
Average Value
Number
Average Value
Number
Average Value
Number
Average Value
Number
Average Value
LOANS ORIGINATED
3
$46,347
67
$52,126
140
$71,535
18
$16,219
2
$28,950
22
$38,347
APPLICATIONS APPROVED, NOT ACCEPTED
1
$91,510
14
$58,721
30
$69,917
2
$94,335
0
$0
1
$95,350
APPLICATIONS DENIED
2
$68,125
57
$46,825
121
$71,538
13
$20,586
0
$0
8
$57,792
APPLICATIONS WITHDRAWN
1
$60,700
5
$82,012
44
$75,228
1
$29,940
0
$0
1
$49,640
FILES CLOSED FOR INCOMPLETENESS
0
$0
2
$145,605
5
$70,522
0
$0
0
$0
0
$0
Aggregated Statistics For Year 2002 (Based on 6 partial tracts)
A) FHA, FSA/RHS & VA Home Purchase Loans
B) Conventional Home Purchase Loans
C) Refinancings
D) Home Improvement Loans
F) Non-occupant Loans on < 5 Family Dwellings (A B C & D)
Number
Average Value
Number
Average Value
Number
Average Value
Number
Average Value
Number
Average Value
LOANS ORIGINATED
0
$0
38
$42,857
71
$72,545
7
$11,639
9
$41,881
APPLICATIONS APPROVED, NOT ACCEPTED
0
$0
17
$39,116
19
$58,079
1
$26,200
2
$35,225
APPLICATIONS DENIED
2
$50,830
44
$39,557
55
$61,353
3
$12,200
3
$55,813
APPLICATIONS WITHDRAWN
0
$0
6
$75,673
20
$72,044
0
$0
0
$0
FILES CLOSED FOR INCOMPLETENESS
0
$0
1
$144,630
4
$76,905
0
$0
0
$0
Aggregated Statistics For Year 2001 (Based on 6 partial tracts)
A) FHA, FSA/RHS & VA Home Purchase Loans
B) Conventional Home Purchase Loans
C) Refinancings
D) Home Improvement Loans
F) Non-occupant Loans on < 5 Family Dwellings (A B C & D)
Number
Average Value
Number
Average Value
Number
Average Value
Number
Average Value
Number
Average Value
LOANS ORIGINATED
2
$46,990
50
$41,022
71
$59,828
10
$8,703
11
$62,272
APPLICATIONS APPROVED, NOT ACCEPTED
0
$0
16
$37,452
14
$58,931
1
$30,430
1
$35,000
APPLICATIONS DENIED
1
$40,600
49
$37,131
53
$62,931
7
$12,889
2
$22,710
APPLICATIONS WITHDRAWN
0
$0
3
$70,643
19
$55,995
0
$0
1
$39,740
FILES CLOSED FOR INCOMPLETENESS
0
$0
1
$56,960
6
$55,880
0
$0
0
$0
Aggregated Statistics For Year 2000 (Based on 6 partial tracts)
A) FHA, FSA/RHS & VA Home Purchase Loans
B) Conventional Home Purchase Loans
C) Refinancings
D) Home Improvement Loans
F) Non-occupant Loans on < 5 Family Dwellings (A B C & D)
Number
Average Value
Number
Average Value
Number
Average Value
Number
Average Value
Number
Average Value
LOANS ORIGINATED
3
$52,660
60
$43,005
48
$54,345
6
$13,342
11
$27,091
APPLICATIONS APPROVED, NOT ACCEPTED
5
$33,418
31
$45,029
12
$61,277
1
$7,120
1
$47,920
APPLICATIONS DENIED
2
$20,660
121
$35,317
48
$52,757
4
$20,882
4
$34,532
APPLICATIONS WITHDRAWN
1
$60,650
4
$52,512
15
$63,161
0
$0
1
$62,030
FILES CLOSED FOR INCOMPLETENESS
0
$0
0
$0
5
$60,644
0
$0
0
$0
Aggregated Statistics For Year 1999 (Based on 4 partial tracts)
A) FHA, FSA/RHS & VA Home Purchase Loans
B) Conventional Home Purchase Loans
C) Refinancings
D) Home Improvement Loans
F) Non-occupant Loans on < 5 Family Dwellings (A B C & D)
2003 - 2018 National Fire Incident Reporting System (NFIRS) incidents
According to the data from the years 2003 - 2018 the average number of fires per year is 24. The highest number of fire incidents - 64 took place in 2010, and the least - 0 in 2005. The data has a growing trend.
When looking into fire subcategories, the most reports belonged to: Outside Fires (54.1%), and Structure Fires (33.4%).
Fire incident types reported to NFIRS in Zip Code 29591


+$31
-$4,882
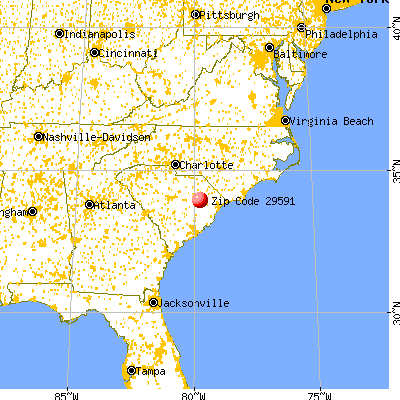
 Nearest zip codes: 29530, 29560, 29541, 29114, 29518, 29583.


 According to the data from the years 2003 - 2018 the average number of fires per year is 24. The highest number of fire incidents - 64 took place in 2010, and the least - 0 in 2005. The data has a growing trend.
 When looking into fire subcategories, the most reports belonged to: Outside Fires (54.1%), and Structure Fires (33.4%).