Estimated zip code population in 2022: 2,667 Zip code population in 2010: 2,915 Zip code population in 2000: 2,688
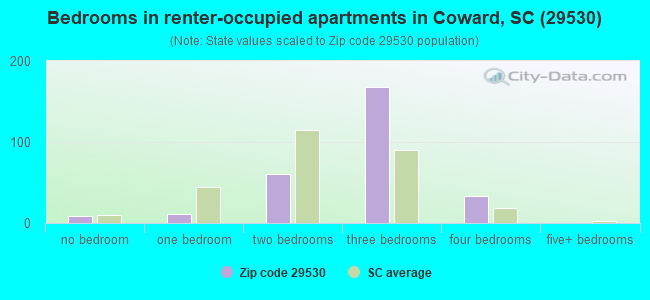
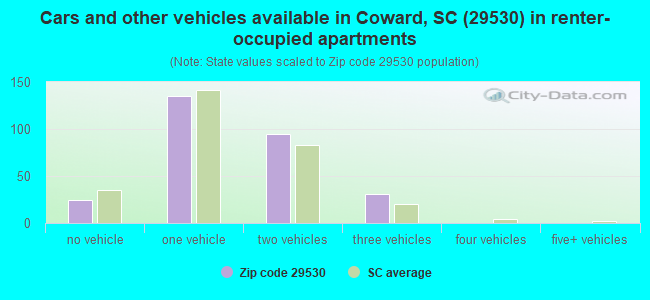
Houses and condos: 1,354 Renter-occupied apartments: 285
% of renters here:
28%
State:
28%
March 2022 cost of living index in zip code 29530: 79.2 (low, U.S. average is 100)
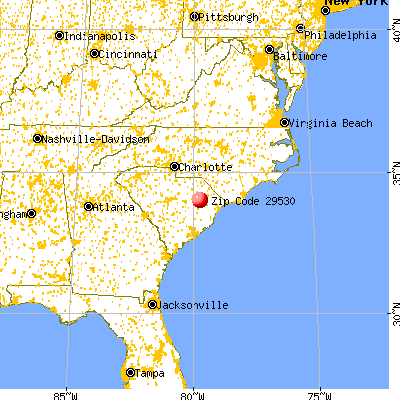
Land area: 38.3 sq. mi. Water area: 0.0 sq. mi.
Population density: 70 people per square mile
(very low).
OSM Map
General Map
Google Map
MSN Map
OSM Map
General Map
Google Map
MSN Map
OSM Map
General Map
Google Map
MSN Map
OSM Map
General Map
Google Map
MSN Map
Please wait while loading the map...
Real estate property taxes paid for housing units in 2022:
This zip code:
0.6% ($776)
South Carolina:
0.5% ($1,185)
Median real estate property taxes paid for housing units with mortgages in 2022: $976 (0.5%) Median real estate property taxes paid for housing units with no mortgage in 2022: $577 (0.6%)
Business Search- 14 Million verified businesses
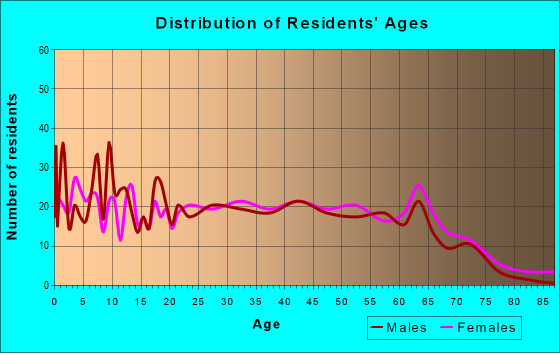
Males: 1,436
(53.9%)
Females: 1,230
(46.1%)
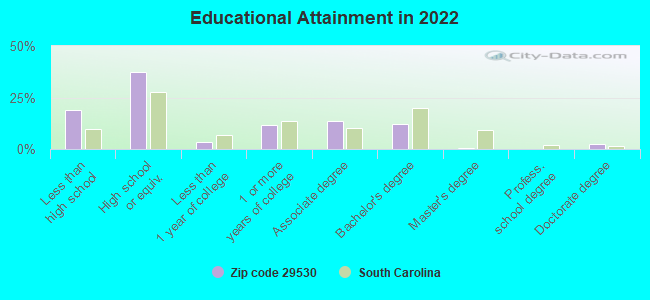
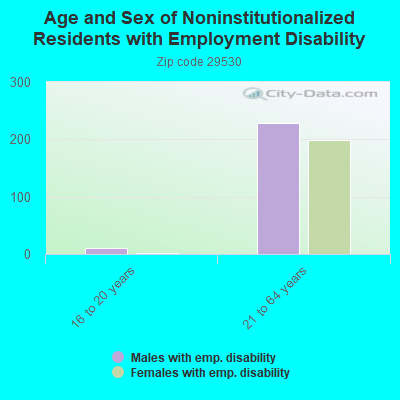
For population 25 years and over in 29530:
High school or higher: 78.4%
Bachelor's degree or higher: 14.4%
Graduate or professional degree: 2.6%
Unemployed: 1.5%
Mean travel time to work (commute): 28.1 minutes
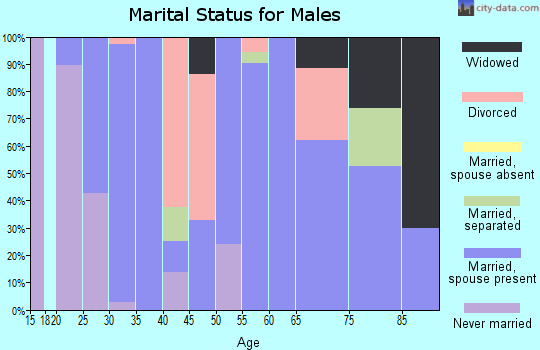
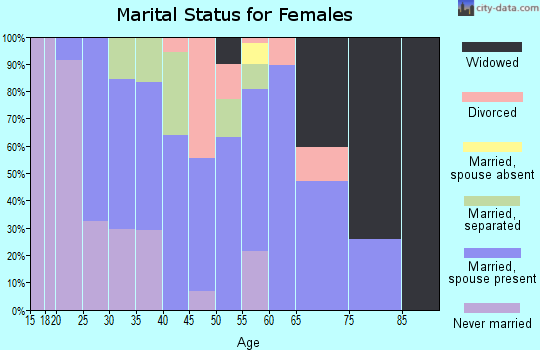
For population 15 years and over in 29530:
Never married: 33.6%
Now married: 49.2%
Separated: 0.8%
Widowed: 8.0%
Divorced: 8.3%
Zip code 29530 compared to state average:
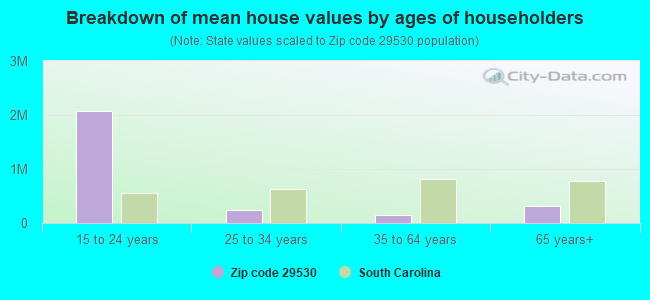
Median house value below state average.
Unemployed percentage significantly below state average.
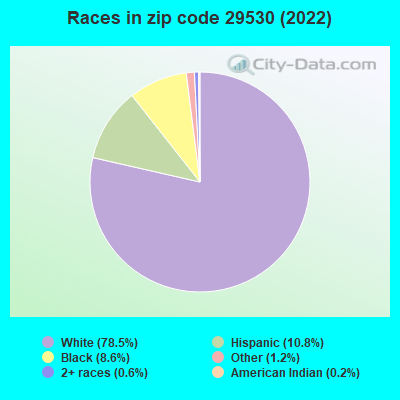
Black race population percentage significantly below state average.
Hispanic race population percentage above state average.
Length of stay since moving in significantly above state average.
Percentage of population with a bachelor's degree or higher significantly below state average.
Estimated median house/condo value in 2022: $136,485
29530:
$136,485
South Carolina:
$254,600
Median resident age:
This zip code:
40.1 years
South Carolina median age:
40.5 years
Average household size:
This zip code:
2.7 people
South Carolina:
2.4 people
Averages for the 2020 tax year for zip code 29530, filed in 2021:
Average Adjusted Gross Income (AGI) in 2020: $40,362 (Individual Income Tax Returns)
Here:
$40,362
State:
$65,754
Salary/wage: $38,584 (reported on 87.0% of returns)
Here:
$38,584
State:
$52,566
(% of AGI for various income ranges: 1343.9% for AGIs below $25k, 3924.3% for AGIs $25k-50k, 7652.0% for AGIs $50k-75k, 10050.0% for AGIs $75k-100k, 18152.0% for AGIs $100k-200k)
Taxable interest for individuals: $540 (reported on 8.7% of returns)
This zip code:
$540
South Carolina:
$1,749
(% of AGI for various income ranges: 3.9% for AGIs below $25k, 6.8% for AGIs $25k-50k, 5.0% for AGIs $50k-75k, 32.0% for AGIs $100k-200k)
Ordinary dividends: $329 (reported on 6.1% of returns)
Here:
$329
State:
$8,783
(% of AGI for various income ranges: 5.0% for AGIs $25k-50k, 18.0% for AGIs $100k-200k)
Net capital gain/loss in AGI: +$1,140 (reported on 4.3% of returns)
Here:
+$1,140
State:
+$24,194
(% of AGI for various income ranges: 17.1% for AGIs $25k-50k, 15.0% for AGIs $75k-100k)
Profit/loss from business: +$7,222 (reported on 15.7% of returns)
Here:
+$7,222
State:
+$11,253
(% of AGI for various income ranges: 149.7% for AGIs below $25k, 35.0% for AGIs $25k-50k, 77.0% for AGIs $50k-75k, 976.7% for AGIs $75k-100k)
Taxable individual retirement arrangement distribution: $14,275 (reported on 3.5% of returns)
29530:
$14,275
South Carolina:
$21,604
(% of AGI for various income ranges: 49.7% for AGIs below $25k, 392.0% for AGIs $50k-75k)
Total itemized deductions: $23,933 (reported on 2.6% of returns)
Here:
$23,933
State:
$35,199
(% of AGI for various income ranges: 718.0% for AGIs $50k-75k)
Taxes paid: $8,150 (reported on 1.7% of returns)
29530:
$8,150
State:
$7,486
(% of AGI for various income ranges: 163.0% for AGIs $50k-75k)
Earned income credit: $2,755 (reported on 28.7% of returns)
Here:
$2,755
State:
$2,397
(% of AGI for various income ranges: 181.4% for AGIs below $25k, 91.4% for AGIs $25k-50k)
Percentage of individuals using paid preparers for their 2020 taxes: 93.9%
Here:
94%
State:
93%
(% for various income ranges: 93.5% for AGIs below $25k, 91.9% for AGIs $25k-50k, 93.3% for AGIs $50k-75k, 100.0% for AGIs $75k-100k, 100.0% for AGIs $100k-200k)
Averages for the 2012 tax year for zip code 29530, filed in 2013:
Average Adjusted Gross Income (AGI) in 2012: $30,669 (Individual Income Tax Returns)
Here:
$30,669
State:
$51,133
Salary/wage: $28,974 (reported on 85.5% of returns)
Here:
$28,974
State:
$42,173
(% of AGI for various income ranges: 79.0% for AGIs below $25k, 85.1% for AGIs $25k-50k, 82.8% for AGIs $50k-75k, 78.3% for AGIs $75k-100k, 70.5% for AGIs $100k-200k)
Taxable interest for individuals: $481 (reported on 14.5% of returns)
This zip code:
$481
South Carolina:
$1,468
(% of AGI for various income ranges: 0.2% for AGIs below $25k, 0.3% for AGIs $25k-50k, 0.1% for AGIs $50k-75k, 0.6% for AGIs $75k-100k)
Ordinary dividends: $583 (reported on 5.5% of returns)
Here:
$583
State:
$6,511
Net capital gain/loss in AGI: +$2,943 (reported on 6.4% of returns)
Here:
+$2,943
State:
+$13,061
Profit/loss from business: +$6,200 (reported on 15.5% of returns)
Here:
+$6,200
State:
+$10,167
(% of AGI for various income ranges: 9.2% for AGIs below $25k, 2.5% for AGIs $25k-50k, 1.2% for AGIs $50k-75k)
Taxable individual retirement arrangement distribution: $11,240 (reported on 4.5% of returns)
29530:
$11,240
South Carolina:
$17,019
Total itemized deductions: $18,007 (27% of AGI, reported on 12.7% of returns)
Here:
$18,007
State:
$22,890
Here:
27.4% of AGI
State:
21.4% of AGI
(% of AGI for various income ranges: 8.6% for AGIs $25k-50k, 9.1% for AGIs $50k-75k, 20.0% for AGIs $75k-100k)
Charity contributions: $5,355 (reported on 10.0% of returns)
Here:
$5,355
State:
$5,169
(% of AGI for various income ranges: 1.5% for AGIs $25k-50k, 2.1% for AGIs $50k-75k, 5.9% for AGIs $75k-100k)
Taxes paid: $4,314 (reported on 12.7% of returns)
29530:
$4,314
State:
$7,644
(% of AGI for various income ranges: 1.2% for AGIs $25k-50k, 2.2% for AGIs $50k-75k, 6.5% for AGIs $75k-100k)
Earned income credit: $2,642 (reported on 36.4% of returns)
Here:
$2,642
State:
$2,418
(% of AGI for various income ranges: 11.4% for AGIs below $25k, 1.8% for AGIs $25k-50k)
Percentage of individuals using paid preparers for their 2012 taxes: 62.7%
Here:
63%
State:
57%
(% for various income ranges: 59.3% for AGIs below $25k, 65.5% for AGIs $25k-50k, 69.2% for AGIs $50k-75k, 66.7% for AGIs $75k-100k, 66.7% for AGIs $100k-200k)
Averages for the 2004 tax year for zip code 29530, filed in 2005:
Average Adjusted Gross Income (AGI) in 2004: $28,700 (Individual Income Tax Returns)
Here:
$28,700
State:
$41,965
Salary/wage: $27,865 (reported on 86.5% of returns)
Here:
$27,865
State:
$35,695
(% of AGI for various income ranges: 130.9% for AGIs below $10k, 81.7% for AGIs $10k-25k, 89.2% for AGIs $25k-50k, 85.5% for AGIs $50k-75k, 85.6% for AGIs $75k-100k, 48.2% for AGIs over 100k)
Taxable interest for individuals: $696 (reported on 21.2% of returns)
This zip code:
$696
South Carolina:
$1,623
(% of AGI for various income ranges: 1.0% for AGIs below $10k, 0.6% for AGIs $10k-25k, 0.5% for AGIs $25k-50k, 0.6% for AGIs $50k-75k, 0.4% for AGIs $75k-100k, 0.3% for AGIs over 100k)
Taxable dividends: $531 (reported on 6.1% of returns)
Here:
$531
State:
$3,999
(% of AGI for various income ranges: 0.2% for AGIs $10k-25k, 0.1% for AGIs $25k-50k, 0.1% for AGIs $50k-75k, 0.1% for AGIs $75k-100k)
Net capital gain/loss: +$5,068 (reported on 5.6% of returns)
Here:
+$5,068
State:
+$13,100
(% of AGI for various income ranges: 1.8% for AGIs below $10k, -0.1% for AGIs $10k-25k, 0.0% for AGIs $25k-50k, 0.2% for AGIs $50k-75k, 9.4% for AGIs $75k-100k)
Profit/loss from business: +$4,348 (reported on 15.0% of returns)
Here:
+$4,348
State:
+$9,144
(% of AGI for various income ranges: 11.9% for AGIs below $10k, 4.5% for AGIs $10k-25k, 1.4% for AGIs $25k-50k, 1.3% for AGIs $50k-75k, 2.7% for AGIs $75k-100k)
Total itemized deductions: $14,781 (27% of AGI, reported on 18.6% of returns)
Here:
$14,781
State:
$19,039
Here:
26.8% of AGI
State:
22.8% of AGI
(% of AGI for various income ranges: 5.0% for AGIs $10k-25k, 8.5% for AGIs $25k-50k, 10.5% for AGIs $50k-75k, 18.7% for AGIs $75k-100k, 14.8% for AGIs over 100k)
Charity contributions deductions: $4,128 (8% of AGI, reported on 17.0% of returns)
Here:
$4,128
State:
$4,305
Here:
7.6% of AGI
State:
5.0% of AGI
(% of AGI for various income ranges: 0.9% for AGIs $10k-25k, 2.0% for AGIs $25k-50k, 3.1% for AGIs $50k-75k, 5.9% for AGIs $75k-100k, 2.8% for AGIs over 100k)
Total tax: $3,098 (reported on 67.7% of returns)
29530:
$3,098
State:
$6,497
(% of AGI for various income ranges: 4.8% for AGIs below $10k, 3.7% for AGIs $10k-25k, 6.0% for AGIs $25k-50k, 7.9% for AGIs $50k-75k, 10.9% for AGIs $75k-100k, 16.2% for AGIs over 100k)
Earned income credit: $1,916 (reported on 29.4% of returns)
Here:
$1,916
State:
$1,882
Percentage of individuals using paid preparers for their 2004 taxes: 72.1%
Here:
72%
State:
66%
(% for various income ranges: 61.9% for AGIs below $10k, 77.8% for AGIs $10k-25k, 73.1% for AGIs $25k-50k, 72.0% for AGIs $50k-75k, 65.7% for AGIs $75k-100k, 89.5% for AGIs over 100k)
Household received Food Stamps/SNAP in the past 12 months: 101 Household did not receive Food Stamps/SNAP in the past 12 months: 903
Women who had a birth in the past 12 months: 62 (49 now married, 14 unmarried) Women who did not have a birth in the past 12 months: 452 (181 now married, 270 unmarried)
Housing units in zip code 29530 with a mortgage: 323 (19 second mortgage, 15 both second mortgage and home equity loan) Median monthly owner costs for units with a mortgage: $1,059 Median monthly owner costs for units without a mortgage: $390
Residents with income below the poverty level in 2022:
This zip code:
13.9%
Whole state:
14.0%
Residents with income below 50% of the poverty level in 2022:
This zip code:
7.2%
Whole state:
7.3%
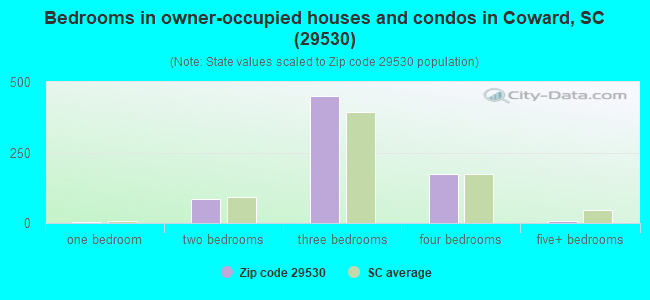
Median number of rooms in houses and condos:
Here:
6.2
State:
6.4
Median number of rooms in apartments:
Here:
5.2
State:
4.5
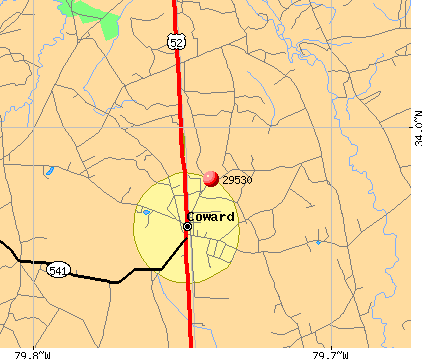
Notable locations in this zip code not listed on our city pages
Notable locations in zip code 29530: Godwin Poultry Farms (A), South Lynches Fire Department Station 2 (B), Coward Police Department (C). Display/hide their locations on the map
Churches in zip code 29530 include: Saint Paul Church (A), Sand Hill Original Church (B), Olive Grove Baptist Church (C), Coward Pentecostal Holy Church (D), Coward Church of God (E), The Bible Temple (F), Shiloh Church of Prophecy (G), Mossy Grove Church (H), Tabernacle Free Will Baptist Church (I). Display/hide their locations on the map
Cemeteries: Gause Cemetery (1), Olive Grove Cemetery (2), Mossy Grove Cemetery (3), Coward Cemetery (4), Lynchs Memorial Gardens Cemetery (5). Display/hide their locations on the map
Streams, rivers, and creeks: Sparrow Swamp (A), Polecat Branch (B), Horse Branch (C), Big Branch (D), Bay Branch (E), Millpond Branch (F). Display/hide their locations on the map
Size of family households: 318 2-persons, 109 3-persons, 107 4-persons, 169 5-persons
Size of nonfamily households: 268 1-person, 24 2-persons
425 married couples with children.
197 single-parent households (26 men, 171 women).
90.1% of residents of 29530 zip code speak English at home.
9.7% of residents speak Spanish at home (16% very well, 59% well, 22% not well, 4% not at all).
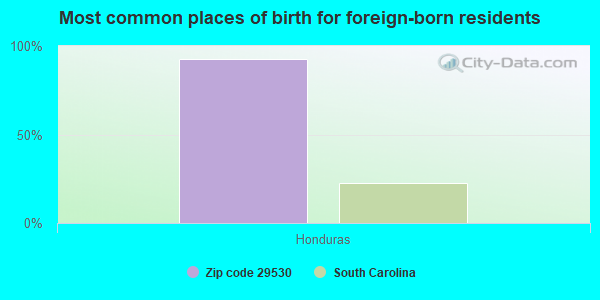
Foreign born population: 86 (3.3%) (0.0% of them are naturalized citizens)
:
3.3%
Whole state:
5.2%
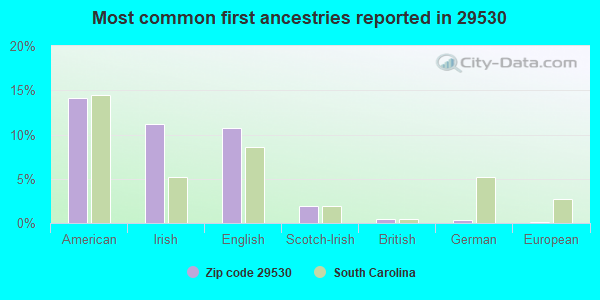
92%Honduras
14%American
11%Irish
11%English
2%Scotch-Irish
0%British
0%German
0%European
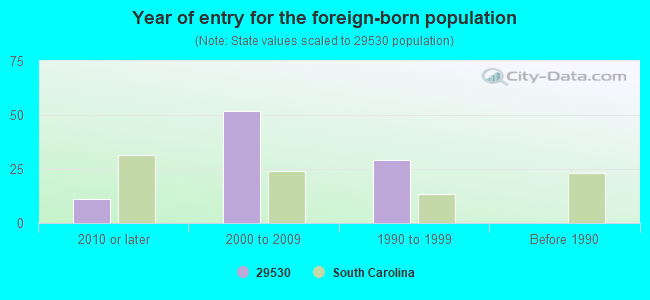
Year of entry for the foreign-born population
112010 or later
522000 to 2009
291990 to 1999
0Before 1990
Facilities with environmental interests located in this zip code:
HOME IMPROVEMENT MANUFACTURER (52 HWY N in COWARD, SC)
(Resource Conservation and Recovery Act (tracking hazardous waste)) STATE MASTER (South Carolina database) - HAZARDOUS WASTE PROGRAM Organizations: SHERMAN GASKINS (CONTACT/OWNER)
Alternative names: HOME IMPROVEMENT MANUFACTURER DEACTIVATE
J C LYNCH ELEM SCHOOL (124 HICKS RD. in COWARD, SC)
(National Center for Education Statistics) - STATE ID-2103036 Organizations: FLORENCE COUNTY SCHOOL DISTRICT 03 (SCHOOL DISTRICT)
Housing units lacking complete plumbing facilities: 9.8% Housing units lacking complete kitchen facilities: 6.4%
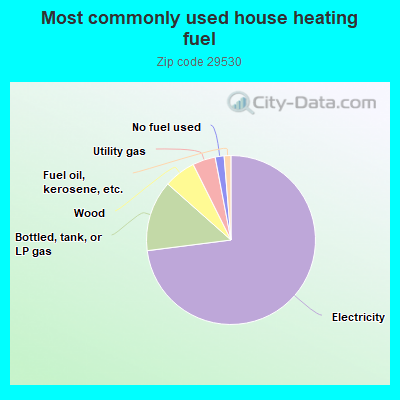
73.2%Electricity
13.6%Bottled, tank, or LP gas
6.1%Wood
4.4%Utility gas
1.7%No fuel used
1.3%Fuel oil, kerosene, etc.
Population in 1990: 2,098. Population change in the 1990s: +590 (+28.1%).
Place of birth for U.S.-born residents:
This state: 2,227
Northeast: 132
Midwest: 40
South: 113
West: 6
76% of the 29530 zip code residents lived in the same house 5 years ago. Out of people who lived in different houses, 72% lived in this county. Out of people who lived in different counties, 50% lived in South Carolina.
94% of the 29530 zip code residents lived in the same house 1 year ago. Out of people who lived in different houses, 68% moved from this county. Out of people who lived in different houses, 4% moved from different county within same state. Out of people who lived in different houses, 17% moved from abroad.
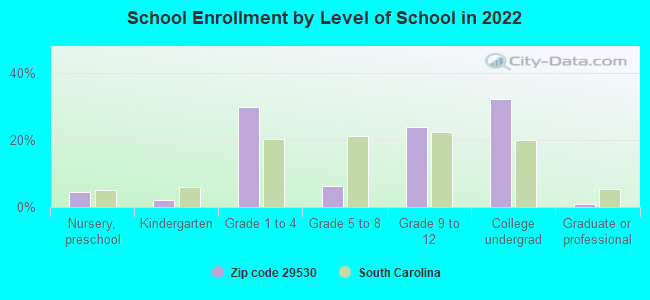
Private vs. public school enrollment:
Students in private schools in grades 1 to 8 (elementary and middle school): 63
Here:
21.9%
South Carolina:
14.4%
Students in private schools in grades 9 to 12 (high school): 9
Here:
5.3%
South Carolina:
11.1%
Students in private undergraduate colleges:
Here:
0.0%
South Carolina:
21.9%
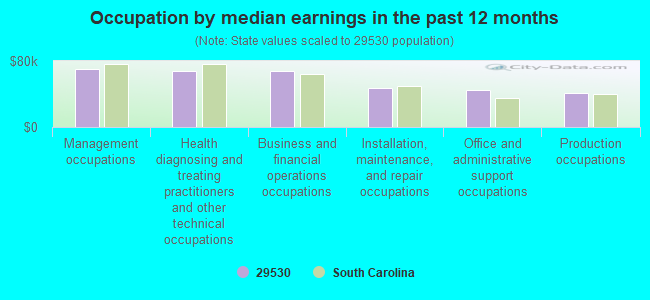
Occupation by median earnings in the past 12 months ($)
70,545Management occupations
68,099Health diagnosing and treating practitioners and other technical occupations
67,836Business and financial operations occupations
47,118Installation, maintenance, and repair occupations
44,854Office and administrative support occupations
41,737Production occupations
Top industries in this zip code by the number of employees in 2005:
Construction: Plumbing, Heating, and Air-Conditioning Contractors (10-19 employees: 2 establishments)
Accommodation and Food Services: Hotels (except Casino Hotels) and Motels (10-19: 1)
Construction: Framing Contractors (5-9: 1)
Construction: All Other Specialty Trade Contractors (5-9: 1)
Other Services (except Public Administration): Religious Organizations (1-4: 3)
Construction: Roofing Contractors (1-4: 2)
Administrative and Support and Waste Management and Remediation Services: Landscaping Services (1-4: 2)
Fatal accident statistics in 2012:
Fatal accident count: 1
Vehicles involved in fatal accidents: 2
Fatal accidents caused by drunken drivers: 1
Fatalities: 1
Persons involved in fatal accidents: 2
Pedestrians involved in fatal accidents: 0
Fatal accident statistics in 2011:
Fatal accident count: 1
Vehicles involved in fatal accidents: 2
Fatal accidents caused by drunken drivers: 1
Fatalities: 1
Persons involved in fatal accidents: 2
Pedestrians involved in fatal accidents: 0
Home Mortgage Disclosure Act Aggregated Statistics For Year 2009 (Based on 2 partial tracts)
A) FHA, FSA/RHS & VA Home Purchase Loans
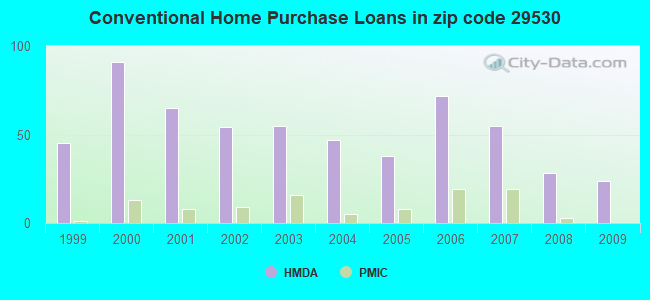
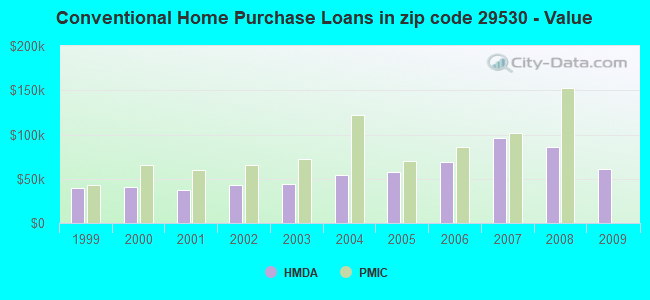
B) Conventional Home Purchase Loans
C) Refinancings
D) Home Improvement Loans
F) Non-occupant Loans on < 5 Family Dwellings (A B C & D)
G) Loans On Manufactured Home Dwelling (A B C & D)
Number
Average Value
Number
Average Value
Number
Average Value
Number
Average Value
Number
Average Value
Number
Average Value
LOANS ORIGINATED
2
$65,380
24
$61,440
54
$108,849
9
$11,028
9
$71,243
25
$45,434
APPLICATIONS APPROVED, NOT ACCEPTED
3
$70,367
2
$44,900
3
$62,490
0
$0
2
$44,900
6
$64,328
APPLICATIONS DENIED
5
$59,866
14
$50,525
24
$92,095
5
$25,206
2
$66,955
16
$45,588
APPLICATIONS WITHDRAWN
3
$84,020
0
$0
6
$224,495
2
$19,690
0
$0
2
$19,690
FILES CLOSED FOR INCOMPLETENESS
2
$44,110
0
$0
6
$137,847
0
$0
0
$0
0
$0
Aggregated Statistics For Year 2008 (Based on 2 partial tracts)
A) FHA, FSA/RHS & VA Home Purchase Loans
B) Conventional Home Purchase Loans
C) Refinancings
D) Home Improvement Loans
F) Non-occupant Loans on < 5 Family Dwellings (A B C & D)
G) Loans On Manufactured Home Dwelling (A B C & D)
Number
Average Value
Number
Average Value
Number
Average Value
Number
Average Value
Number
Average Value
Number
Average Value
LOANS ORIGINATED
6
$115,267
28
$86,253
47
$89,194
9
$7,877
14
$50,976
30
$29,145
APPLICATIONS APPROVED, NOT ACCEPTED
0
$0
6
$75,620
5
$95,154
3
$8,403
0
$0
8
$84,481
APPLICATIONS DENIED
0
$0
16
$53,958
32
$69,810
8
$67,545
2
$38,595
16
$31,902
APPLICATIONS WITHDRAWN
3
$107,127
3
$15,230
6
$113,167
2
$102,400
2
$118,155
3
$15,230
FILES CLOSED FOR INCOMPLETENESS
0
$0
0
$0
0
$0
0
$0
0
$0
0
$0
Aggregated Statistics For Year 2007 (Based on 2 partial tracts)
A) FHA, FSA/RHS & VA Home Purchase Loans
B) Conventional Home Purchase Loans
C) Refinancings
D) Home Improvement Loans
F) Non-occupant Loans on < 5 Family Dwellings (A B C & D)
G) Loans On Manufactured Home Dwelling (A B C & D)
Number
Average Value
Number
Average Value
Number
Average Value
Number
Average Value
Number
Average Value
Number
Average Value
LOANS ORIGINATED
2
$81,920
55
$96,013
54
$63,249
16
$18,117
25
$92,948
52
$57,381
APPLICATIONS APPROVED, NOT ACCEPTED
0
$0
9
$50,238
9
$76,144
0
$0
3
$31,507
8
$57,502
APPLICATIONS DENIED
0
$0
46
$75,208
46
$90,757
24
$28,751
3
$55,663
38
$47,718
APPLICATIONS WITHDRAWN
0
$0
9
$99,600
17
$102,123
2
$16,540
2
$71,680
6
$71,680
FILES CLOSED FOR INCOMPLETENESS
0
$0
2
$33,870
2
$64,590
0
$0
0
$0
0
$0
Aggregated Statistics For Year 2006 (Based on 2 partial tracts)
B) Conventional Home Purchase Loans
C) Refinancings
D) Home Improvement Loans
F) Non-occupant Loans on < 5 Family Dwellings (A B C & D)
G) Loans On Manufactured Home Dwelling (A B C & D)
Number
Average Value
Number
Average Value
Number
Average Value
Number
Average Value
Number
Average Value
LOANS ORIGINATED
72
$69,449
44
$66,131
24
$50,282
14
$81,246
60
$39,621
APPLICATIONS APPROVED, NOT ACCEPTED
11
$54,280
11
$88,223
5
$33,398
0
$0
8
$58,880
APPLICATIONS DENIED
36
$56,277
47
$66,435
11
$23,345
0
$0
28
$42,930
APPLICATIONS WITHDRAWN
0
$0
20
$91,373
2
$19,690
0
$0
6
$34,397
FILES CLOSED FOR INCOMPLETENESS
5
$73,098
9
$168,918
0
$0
2
$35,445
2
$35,445
Aggregated Statistics For Year 2005 (Based on 2 partial tracts)
A) FHA, FSA/RHS & VA Home Purchase Loans
B) Conventional Home Purchase Loans
C) Refinancings
D) Home Improvement Loans
F) Non-occupant Loans on < 5 Family Dwellings (A B C & D)
G) Loans On Manufactured Home Dwelling (A B C & D)
Number
Average Value
Number
Average Value
Number
Average Value
Number
Average Value
Number
Average Value
Number
Average Value
LOANS ORIGINATED
3
$140,210
38
$58,083
58
$79,857
11
$26,352
16
$36,923
27
$35,709
APPLICATIONS APPROVED, NOT ACCEPTED
2
$37,810
9
$78,946
19
$63,348
0
$0
0
$0
13
$50,898
APPLICATIONS DENIED
0
$0
49
$47,841
50
$81,984
17
$40,034
5
$43,482
49
$42,279
APPLICATIONS WITHDRAWN
2
$64,590
17
$87,944
20
$100,353
2
$54,350
0
$0
13
$82,042
FILES CLOSED FOR INCOMPLETENESS
0
$0
3
$62,490
6
$108,177
2
$23,630
0
$0
0
$0
Aggregated Statistics For Year 2004 (Based on 2 partial tracts)
A) FHA, FSA/RHS & VA Home Purchase Loans
B) Conventional Home Purchase Loans
C) Refinancings
D) Home Improvement Loans
F) Non-occupant Loans on < 5 Family Dwellings (A B C & D)
G) Loans On Manufactured Home Dwelling (A B C & D)
Number
Average Value
Number
Average Value
Number
Average Value
Number
Average Value
Number
Average Value
Number
Average Value
LOANS ORIGINATED
2
$69,320
47
$54,770
82
$78,040
14
$24,194
5
$40,016
50
$33,461
APPLICATIONS APPROVED, NOT ACCEPTED
0
$0
14
$56,939
24
$71,221
2
$3,150
0
$0
14
$47,599
APPLICATIONS DENIED
0
$0
25
$73,603
55
$83,067
14
$18,680
2
$41,750
20
$42,220
APPLICATIONS WITHDRAWN
0
$0
9
$79,470
24
$101,416
3
$63,540
0
$0
9
$53,389
FILES CLOSED FOR INCOMPLETENESS
0
$0
2
$55,140
3
$126,557
0
$0
0
$0
0
$0
Aggregated Statistics For Year 2003 (Based on 2 partial tracts)
A) FHA, FSA/RHS & VA Home Purchase Loans
B) Conventional Home Purchase Loans
C) Refinancings
D) Home Improvement Loans
F) Non-occupant Loans on < 5 Family Dwellings (A B C & D)
Number
Average Value
Number
Average Value
Number
Average Value
Number
Average Value
Number
Average Value
LOANS ORIGINATED
3
$65,117
55
$43,510
112
$61,328
19
$9,204
17
$36,512
APPLICATIONS APPROVED, NOT ACCEPTED
0
$0
3
$56,190
30
$84,074
3
$17,853
2
$150,450
APPLICATIONS DENIED
0
$0
43
$57,337
77
$81,368
9
$29,058
6
$56,715
APPLICATIONS WITHDRAWN
0
$0
8
$91,768
35
$82,596
2
$44,900
2
$54,350
FILES CLOSED FOR INCOMPLETENESS
0
$0
2
$138,635
3
$84,020
0
$0
0
$0
Aggregated Statistics For Year 2002 (Based on 2 partial tracts)
B) Conventional Home Purchase Loans
C) Refinancings
D) Home Improvement Loans
F) Non-occupant Loans on < 5 Family Dwellings (A B C & D)
Number
Average Value
Number
Average Value
Number
Average Value
Number
Average Value
LOANS ORIGINATED
54
$42,886
88
$63,875
14
$10,803
13
$34,538
APPLICATIONS APPROVED, NOT ACCEPTED
22
$43,825
35
$52,078
3
$32,557
6
$36,497
APPLICATIONS DENIED
54
$39,618
74
$68,253
6
$14,703
2
$26,780
APPLICATIONS WITHDRAWN
8
$56,320
27
$63,950
0
$0
0
$0
FILES CLOSED FOR INCOMPLETENESS
3
$119,730
6
$60,653
0
$0
0
$0
Aggregated Statistics For Year 2001 (Based on 2 partial tracts)
A) FHA, FSA/RHS & VA Home Purchase Loans
B) Conventional Home Purchase Loans
C) Refinancings
D) Home Improvement Loans
F) Non-occupant Loans on < 5 Family Dwellings (A B C & D)
Number
Average Value
Number
Average Value
Number
Average Value
Number
Average Value
Number
Average Value
LOANS ORIGINATED
3
$66,167
65
$37,494
91
$64,643
17
$7,877
5
$13,234
APPLICATIONS APPROVED, NOT ACCEPTED
0
$0
22
$35,805
20
$68,924
5
$22,686
0
$0
APPLICATIONS DENIED
2
$31,510
98
$37,183
69
$64,934
11
$15,467
2
$23,630
APPLICATIONS WITHDRAWN
0
$0
8
$79,164
27
$65,583
0
$0
2
$7,875
FILES CLOSED FOR INCOMPLETENESS
0
$0
2
$40,175
14
$58,627
0
$0
2
$20,480
Aggregated Statistics For Year 2000 (Based on 2 partial tracts)
A) FHA, FSA/RHS & VA Home Purchase Loans
B) Conventional Home Purchase Loans
C) Refinancings
D) Home Improvement Loans
F) Non-occupant Loans on < 5 Family Dwellings (A B C & D)
Number
Average Value
Number
Average Value
Number
Average Value
Number
Average Value
Number
Average Value
LOANS ORIGINATED
0
$0
91
$40,372
54
$61,470
16
$14,671
14
$31,396
APPLICATIONS APPROVED, NOT ACCEPTED
8
$22,844
32
$42,634
17
$74,971
2
$9,450
2
$40,175
APPLICATIONS DENIED
0
$0
197
$34,171
61
$62,706
8
$29,736
3
$36,233
APPLICATIONS WITHDRAWN
0
$0
8
$62,031
6
$72,732
0
$0
0
$0
FILES CLOSED FOR INCOMPLETENESS
0
$0
0
$0
5
$101,140
0
$0
0
$0
Aggregated Statistics For Year 1999 (Based on 1 partial tract)
A) FHA, FSA/RHS & VA Home Purchase Loans
B) Conventional Home Purchase Loans
C) Refinancings
D) Home Improvement Loans
F) Non-occupant Loans on < 5 Family Dwellings (A B C & D)
Detailed PMIC statistics for the following Tracts:0023.00
2003 - 2018 National Fire Incident Reporting System (NFIRS) incidents
According to the data from the years 2003 - 2018 the average number of fire incidents per year is 21. The highest number of fire incidents - 49 took place in 2003, and the least - 0 in 2005. The data has a dropping trend.
When looking into fire subcategories, the most incidents belonged to: Outside Fires (60.4%), and Structure Fires (21.8%).
Fire incident types reported to NFIRS in Zip Code 29530


 Nearest zip codes: 29591, 29541, 29505, 29560, 29583, 29114.
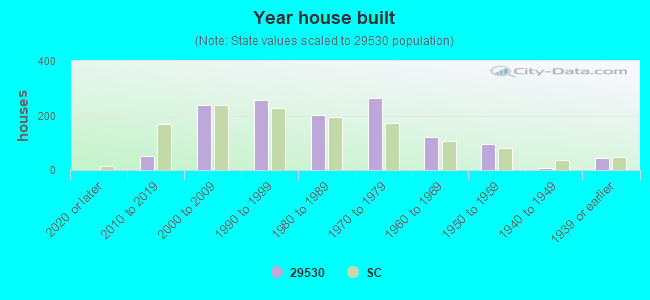


 According to the data from the years 2003 - 2018 the average number of fire incidents per year is 21. The highest number of fire incidents - 49 took place in 2003, and the least - 0 in 2005. The data has a dropping trend.
 When looking into fire subcategories, the most incidents belonged to: Outside Fires (60.4%), and Structure Fires (21.8%).