Estimated zip code population in 2022: 25,230 Zip code population in 2010: 24,279 Zip code population in 2000: 19,115
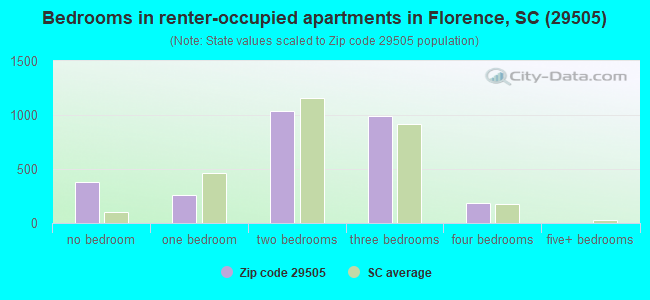
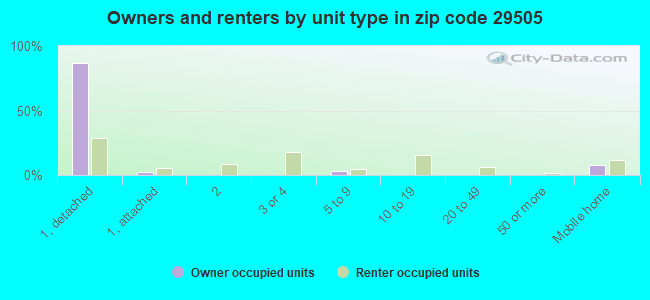
Houses and condos: 11,228 Renter-occupied apartments: 2,876
% of renters here:
28%
State:
28%
March 2022 cost of living index in zip code 29505: 82.0 (low, U.S. average is 100)
Land area: 51.7 sq. mi. Water area: 0.0 sq. mi.
Population density: 488 people per square mile
(low).
OSM Map
General Map
Google Map
MSN Map
OSM Map
General Map
Google Map
MSN Map
OSM Map
General Map
Google Map
MSN Map
OSM Map
General Map
Google Map
MSN Map
Please wait while loading the map...
Real estate property taxes paid for housing units in 2022:
This zip code:
0.4% ($702)
South Carolina:
0.5% ($1,185)
Median real estate property taxes paid for housing units with mortgages in 2022: $780 (0.4%) Median real estate property taxes paid for housing units with no mortgage in 2022: $528 (0.3%)
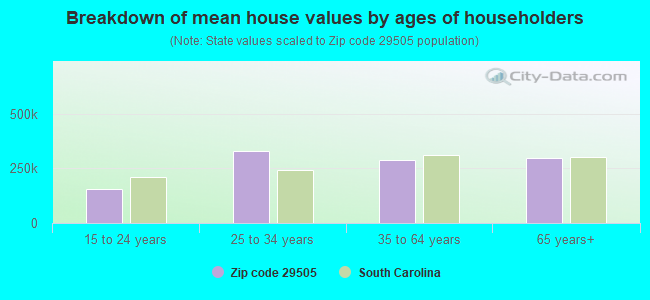
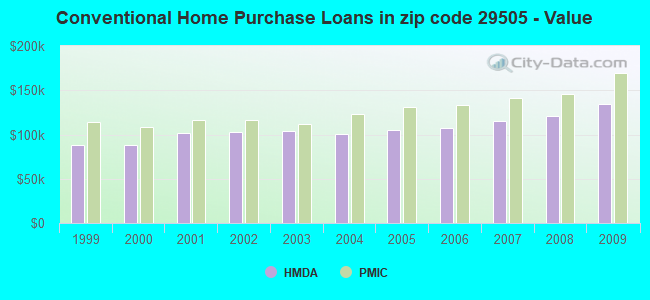
Estimated median house/condo value in 2022: $193,717
29505:
$193,717
South Carolina:
$254,600
According to our research of South Carolina and other state lists, there were 10 registered sex offenders living in 29505 zip code as of April 27, 2024. The ratio of all residents to sex offenders in zip code 29505 is 2,558 to 1. The ratio of registered sex offenders to all residents in this zip code is lower than the state average.
Median resident age:
This zip code:
39.8 years
South Carolina median age:
40.5 years
Average household size:
This zip code:
2.4 people
South Carolina:
2.4 people
Averages for the 2020 tax year for zip code 29505, filed in 2021:
Average Adjusted Gross Income (AGI) in 2020: $54,622 (Individual Income Tax Returns)
Here:
$54,622
State:
$65,754
Salary/wage: $48,299 (reported on 82.9% of returns)
Here:
$48,299
State:
$52,566
(% of AGI for various income ranges: 1232.4% for AGIs below $25k, 3768.3% for AGIs $25k-50k, 6897.5% for AGIs $50k-75k, 10881.5% for AGIs $75k-100k, 19619.6% for AGIs $100k-200k, 61658.9% for AGIs over 200k)
Taxable interest for individuals: $908 (reported on 20.3% of returns)
This zip code:
$908
South Carolina:
$1,749
(% of AGI for various income ranges: 8.8% for AGIs below $25k, 8.2% for AGIs $25k-50k, 33.0% for AGIs $50k-75k, 42.7% for AGIs $75k-100k, 93.3% for AGIs $100k-200k, 411.1% for AGIs over 200k)
Ordinary dividends: $4,244 (reported on 13.2% of returns)
Here:
$4,244
State:
$8,783
(% of AGI for various income ranges: 13.2% for AGIs below $25k, 24.0% for AGIs $25k-50k, 67.0% for AGIs $50k-75k, 162.0% for AGIs $75k-100k, 280.4% for AGIs $100k-200k, 1984.4% for AGIs over 200k)
Net capital gain/loss in AGI: +$12,620 (reported on 11.3% of returns)
Here:
+$12,620
State:
+$24,194
(% of AGI for various income ranges: 4.5% for AGIs below $25k, 22.8% for AGIs $25k-50k, 51.8% for AGIs $50k-75k, 191.7% for AGIs $75k-100k, 380.4% for AGIs $100k-200k, 12764.4% for AGIs over 200k)
Profit/loss from business: +$9,290 (reported on 15.7% of returns)
Here:
+$9,290
State:
+$11,253
(% of AGI for various income ranges: 61.2% for AGIs below $25k, 28.5% for AGIs $25k-50k, 135.4% for AGIs $50k-75k, 259.5% for AGIs $75k-100k, 643.8% for AGIs $100k-200k, 7280.0% for AGIs over 200k)
Taxable individual retirement arrangement distribution: $15,976 (reported on 7.9% of returns)
29505:
$15,976
South Carolina:
$21,604
(% of AGI for various income ranges: 46.9% for AGIs below $25k, 88.8% for AGIs $25k-50k, 220.9% for AGIs $50k-75k, 331.0% for AGIs $75k-100k, 697.1% for AGIs $100k-200k, 1755.6% for AGIs over 200k)
Self-employed (Keogh) retirement plans: $20,050 (reported on 0.2% of returns)
29505:
$20,050
South Carolina:
$25,038
(% of AGI for various income ranges: 54.9% for AGIs $100k-200k)
Total itemized deductions: $28,446 (reported on 7.1% of returns)
Here:
$28,446
State:
$35,199
(% of AGI for various income ranges: 34.2% for AGIs below $25k, 125.9% for AGIs $25k-50k, 313.2% for AGIs $50k-75k, 587.0% for AGIs $75k-100k, 1024.1% for AGIs $100k-200k, 5698.9% for AGIs over 200k)
Charity contributions: $12,430 (reported on 6.1% of returns)
Here:
$12,430
State:
$14,319
(% of AGI for various income ranges: 5.4% for AGIs below $25k, 37.5% for AGIs $25k-50k, 90.0% for AGIs $50k-75k, 189.7% for AGIs $75k-100k, 429.5% for AGIs $100k-200k, 2798.9% for AGIs over 200k)
Taxes paid: $6,371 (reported on 7.0% of returns)
29505:
$6,371
State:
$7,486
(% of AGI for various income ranges: 3.7% for AGIs below $25k, 15.0% for AGIs $25k-50k, 60.6% for AGIs $50k-75k, 136.0% for AGIs $75k-100k, 291.4% for AGIs $100k-200k, 1276.7% for AGIs over 200k)
Earned income credit: $2,568 (reported on 22.5% of returns)
Here:
$2,568
State:
$2,397
(% of AGI for various income ranges: 136.0% for AGIs below $25k, 93.7% for AGIs $25k-50k, 1.2% for AGIs $50k-75k)
Percentage of individuals using paid preparers for their 2020 taxes: 93.2%
Here:
93%
State:
93%
(% for various income ranges: 93.4% for AGIs below $25k, 93.7% for AGIs $25k-50k, 92.5% for AGIs $50k-75k, 92.1% for AGIs $75k-100k, 93.7% for AGIs $100k-200k, 92.9% for AGIs over 200k)
Averages for the 2012 tax year for zip code 29505, filed in 2013:
Average Adjusted Gross Income (AGI) in 2012: $49,536 (Individual Income Tax Returns)
Here:
$49,536
State:
$51,133
Salary/wage: $44,248 (reported on 85.6% of returns)
Here:
$44,248
State:
$42,173
(% of AGI for various income ranges: 77.8% for AGIs below $25k, 81.4% for AGIs $25k-50k, 77.8% for AGIs $50k-75k, 77.8% for AGIs $75k-100k, 78.4% for AGIs $100k-200k, 60.6% for AGIs over 200k)
Taxable interest for individuals: $985 (reported on 27.7% of returns)
This zip code:
$985
South Carolina:
$1,468
(% of AGI for various income ranges: 0.6% for AGIs below $25k, 0.4% for AGIs $25k-50k, 0.6% for AGIs $50k-75k, 0.5% for AGIs $75k-100k, 0.5% for AGIs $100k-200k, 0.9% for AGIs over 200k)
Ordinary dividends: $3,412 (reported on 15.1% of returns)
Here:
$3,412
State:
$6,511
(% of AGI for various income ranges: 1.0% for AGIs below $25k, 0.7% for AGIs $25k-50k, 0.7% for AGIs $50k-75k, 0.8% for AGIs $75k-100k, 1.2% for AGIs $100k-200k, 2.0% for AGIs over 200k)
Net capital gain/loss in AGI: +$5,282 (reported on 11.4% of returns)
Here:
+$5,282
State:
+$13,061
(% of AGI for various income ranges: 0.2% for AGIs $25k-50k, 0.3% for AGIs $50k-75k, 0.4% for AGIs $75k-100k, 0.8% for AGIs $100k-200k, 7.0% for AGIs over 200k)
Profit/loss from business: +$8,949 (reported on 14.5% of returns)
Here:
+$8,949
State:
+$10,167
(% of AGI for various income ranges: 5.9% for AGIs below $25k, 1.7% for AGIs $25k-50k, 1.1% for AGIs $50k-75k, 1.4% for AGIs $75k-100k, 3.2% for AGIs $100k-200k, 3.6% for AGIs over 200k)
Taxable individual retirement arrangement distribution: $12,434 (reported on 9.3% of returns)
29505:
$12,434
South Carolina:
$17,019
(% of AGI for various income ranges: 2.5% for AGIs below $25k, 2.2% for AGIs $25k-50k, 2.1% for AGIs $50k-75k, 2.9% for AGIs $75k-100k, 2.6% for AGIs $100k-200k, 1.6% for AGIs over 200k)
Self-employment retirement plans: $21,800 (reported on 0.3% of returns)
29505:
$21,800
South Carolina:
$21,023
Total itemized deductions: $19,632 (22% of AGI, reported on 33.3% of returns)
Here:
$19,632
State:
$22,890
Here:
22.0% of AGI
State:
21.4% of AGI
(% of AGI for various income ranges: 8.7% for AGIs below $25k, 11.7% for AGIs $25k-50k, 13.6% for AGIs $50k-75k, 14.4% for AGIs $75k-100k, 15.4% for AGIs $100k-200k, 12.3% for AGIs over 200k)
Charity contributions: $5,019 (reported on 28.5% of returns)
Here:
$5,019
State:
$5,169
(% of AGI for various income ranges: 1.2% for AGIs below $25k, 2.3% for AGIs $25k-50k, 3.0% for AGIs $50k-75k, 3.3% for AGIs $75k-100k, 3.4% for AGIs $100k-200k, 3.3% for AGIs over 200k)
Taxes paid: $6,158 (reported on 33.2% of returns)
29505:
$6,158
State:
$7,644
(% of AGI for various income ranges: 1.1% for AGIs below $25k, 2.2% for AGIs $25k-50k, 3.4% for AGIs $50k-75k, 4.3% for AGIs $75k-100k, 6.1% for AGIs $100k-200k, 6.1% for AGIs over 200k)
Earned income credit: $2,449 (reported on 23.7% of returns)
Here:
$2,449
State:
$2,418
(% of AGI for various income ranges: 9.0% for AGIs below $25k, 1.4% for AGIs $25k-50k)
Percentage of individuals using paid preparers for their 2012 taxes: 55.1%
Here:
55%
State:
57%
(% for various income ranges: 53.7% for AGIs below $25k, 52.8% for AGIs $25k-50k, 56.8% for AGIs $50k-75k, 57.4% for AGIs $75k-100k, 59.0% for AGIs $100k-200k, 72.2% for AGIs over 200k)
Averages for the 2004 tax year for zip code 29505, filed in 2005:
Average Adjusted Gross Income (AGI) in 2004: $43,280 (Individual Income Tax Returns)
Here:
$43,280
State:
$41,965
Salary/wage: $39,949 (reported on 88.1% of returns)
Here:
$39,949
State:
$35,695
(% of AGI for various income ranges: 119.6% for AGIs below $10k, 79.7% for AGIs $10k-25k, 83.1% for AGIs $25k-50k, 83.7% for AGIs $50k-75k, 85.2% for AGIs $75k-100k, 74.2% for AGIs over 100k)
Taxable interest for individuals: $1,365 (reported on 37.8% of returns)
This zip code:
$1,365
South Carolina:
$1,623
(% of AGI for various income ranges: 4.5% for AGIs below $10k, 1.7% for AGIs $10k-25k, 0.9% for AGIs $25k-50k, 0.8% for AGIs $50k-75k, 0.7% for AGIs $75k-100k, 1.6% for AGIs over 100k)
Taxable dividends: $1,971 (reported on 20.0% of returns)
Here:
$1,971
State:
$3,999
(% of AGI for various income ranges: 3.3% for AGIs below $10k, 1.0% for AGIs $10k-25k, 0.6% for AGIs $25k-50k, 0.6% for AGIs $50k-75k, 0.8% for AGIs $75k-100k, 1.2% for AGIs over 100k)
Net capital gain/loss: +$3,726 (reported on 15.3% of returns)
Here:
+$3,726
State:
+$13,100
(% of AGI for various income ranges: -1.7% for AGIs below $10k, 0.0% for AGIs $10k-25k, 0.1% for AGIs $25k-50k, 0.5% for AGIs $50k-75k, 0.5% for AGIs $75k-100k, 3.9% for AGIs over 100k)
Profit/loss from business: +$7,059 (reported on 12.7% of returns)
Here:
+$7,059
State:
+$9,144
(% of AGI for various income ranges: -9.6% for AGIs below $10k, 3.3% for AGIs $10k-25k, 1.7% for AGIs $25k-50k, 1.5% for AGIs $50k-75k, 1.5% for AGIs $75k-100k, 3.3% for AGIs over 100k)
IRA payment deduction: $3,208 (reported on 2.1% of returns)
29505:
$3,208
South Carolina:
$2,972
(% of AGI for various income ranges: 0.1% for AGIs $10k-25k, 0.2% for AGIs $25k-50k, 0.1% for AGIs $50k-75k, 0.1% for AGIs $75k-100k, 0.2% for AGIs over 100k)
Self-employed pension: $20,538 (reported on 0.3% of returns)
Here:
$20,538
South Carolina:
$15,117
Total itemized deductions: $16,882 (23% of AGI, reported on 38.9% of returns)
Here:
$16,882
State:
$19,039
Here:
22.6% of AGI
State:
22.8% of AGI
(% of AGI for various income ranges: 10.6% for AGIs below $10k, 10.3% for AGIs $10k-25k, 14.4% for AGIs $25k-50k, 16.3% for AGIs $50k-75k, 17.0% for AGIs $75k-100k, 15.8% for AGIs over 100k)
Charity contributions deductions: $3,900 (5% of AGI, reported on 35.1% of returns)
Here:
$3,900
State:
$4,305
Here:
5.1% of AGI
State:
5.0% of AGI
(% of AGI for various income ranges: 0.8% for AGIs below $10k, 1.6% for AGIs $10k-25k, 2.9% for AGIs $25k-50k, 3.4% for AGIs $50k-75k, 3.6% for AGIs $75k-100k, 3.6% for AGIs over 100k)
Total tax: $5,963 (reported on 73.2% of returns)
29505:
$5,963
State:
$6,497
(% of AGI for various income ranges: 2.6% for AGIs below $10k, 3.3% for AGIs $10k-25k, 6.3% for AGIs $25k-50k, 8.4% for AGIs $50k-75k, 10.2% for AGIs $75k-100k, 16.7% for AGIs over 100k)
Earned income credit: $1,865 (reported on 18.5% of returns)
Here:
$1,865
State:
$1,882
Percentage of individuals using paid preparers for their 2004 taxes: 63.4%
Here:
63%
State:
66%
(% for various income ranges: 55.3% for AGIs below $10k, 67.8% for AGIs $10k-25k, 65.3% for AGIs $25k-50k, 61.9% for AGIs $50k-75k, 63.6% for AGIs $75k-100k, 65.9% for AGIs over 100k)
Likely homosexual households (counted as self-reported same-sex unmarried-partner households)
Lesbian couples: 0.1% of all households
Gay men: 0.0% of all households
Household received Food Stamps/SNAP in the past 12 months: 904 Household did not receive Food Stamps/SNAP in the past 12 months: 9,326
Women who had a birth in the past 12 months: 299 (174 now married, 123 unmarried) Women who did not have a birth in the past 12 months: 5,657 (2,771 now married, 2,900 unmarried)
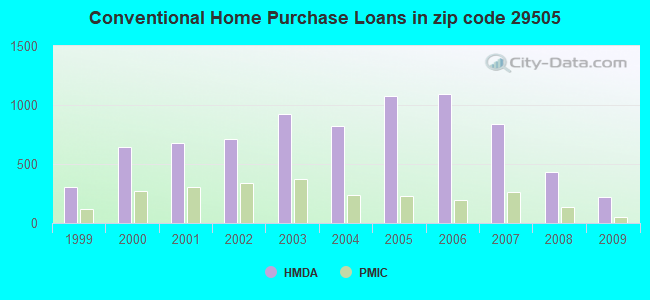
Housing units in zip code 29505 with a mortgage: 4,868 (316 second mortgage, 207 both second mortgage and home equity loan) Houses without a mortgage: 23
Median monthly owner costs for units with a mortgage: $1,165 Median monthly owner costs for units without a mortgage: $359
Residents with income below the poverty level in 2022:
This zip code:
14.7%
Whole state:
14.0%
Residents with income below 50% of the poverty level in 2022:
This zip code:
10.3%
Whole state:
7.3%
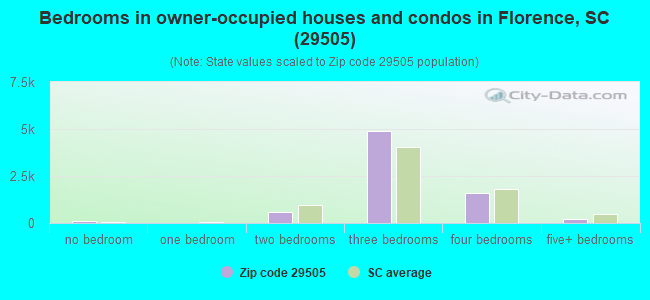
Median number of rooms in houses and condos:
Here:
6.1
State:
6.4
Median number of rooms in apartments:
Here:
4.8
State:
4.5
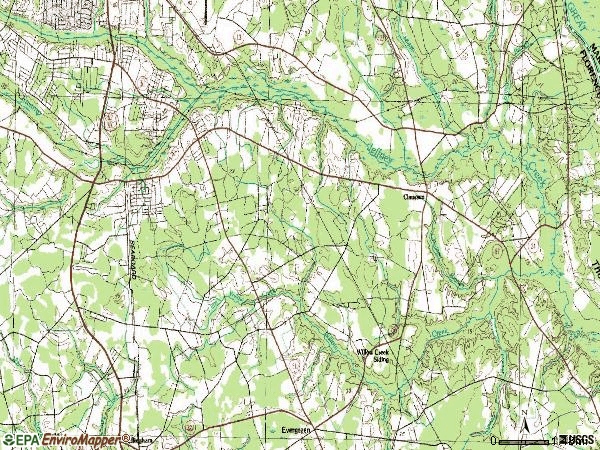
Notable locations in this zip code not listed on our city pages
Notable locations in zip code 29505: Southside Commons (A), Claussen Station (B), Howe Springs Fire Department Station 5 (C), Howe Springs Fire Department Station 1 (D), Freedom Florence Recreation Complex (E), Howe Springs Fire Department Station 4 (F), Florence Police Department Patrol Division South Region Headquarters (G). Display/hide their locations on the map
Churches in zip code 29505 include: Amada Church (A), Willow Creek Church (B), Spring Branch Church (C), Southway Church (D), Southside Baptist Church (E), Southoak Free Will Baptist Church (F), South Florence Church (G), Salem Church (H), Rumsey Memorial Church (I). Display/hide their locations on the map
Cemeteries: Saint Paul Cemetery (1), Burch Cemetery (2), McPherson Cemetery (3), Howe Cemetery (4), Garden of Memories Cemetery (5), Claussen Cemetery (6). Display/hide their locations on the map
Streams, rivers, and creeks: Spring Branch (A), Little Willow Creek (B), Eastman Branch (C), Claussen Branch (D), Billy Branch (E). Display/hide their locations on the map
3,313 married couples with children.
1,968 single-parent households (713 men, 1,255 women).
96.3% of residents of 29505 zip code speak English at home.
2.2% of residents speak Spanish at home (58% very well, 18% well, 20% not well, 4% not at all).
1.0% of residents speak other Indo-European language at home (53% very well, 31% well, 15% not well).
0.3% of residents speak Asian or Pacific Island language at home (100% very well).
0.1% of residents speak other language at home (100% very well).
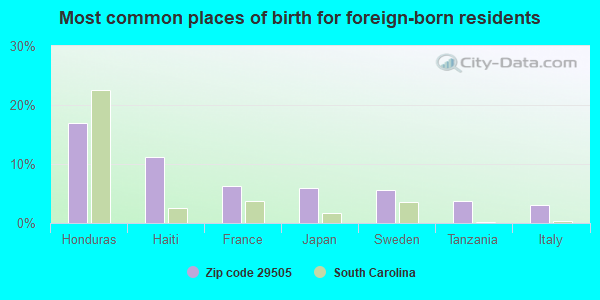
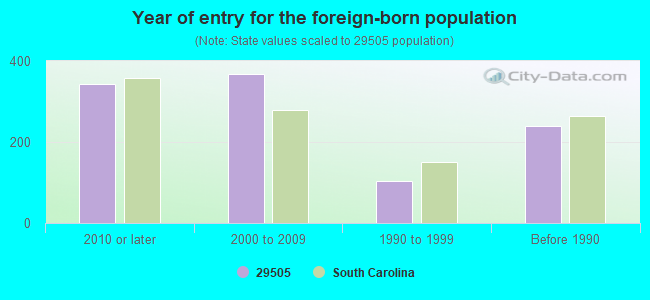
Foreign born population: 818 (3.2%) (47.4% of them are naturalized citizens)
Facilities with environmental interests located in this zip code:
FLORENCE CAREER CENTER (126 E HOWE SPRINGS RD in FLORENCE, SC)
(Geographic Names Information System) (National Center for Education Statistics) - STATE ID-2101995 Conditionally Exempt Small Quantity Generators, less than 100 kg/month of hazardous waste (Resource Conservation and Recovery Act (tracking hazardous waste)) - notification STATE MASTER (South Carolina database) - HAZARDOUS WASTE PROGRAM Organizations: FLORENCE SCHOOL DISTRICT #1 (CONTACT/OWNER)
, FLORENCE COUNTY SCHOOL DISTRICT 01 (SCHOOL DISTRICT)
CITY CLEANERS OF HARTSVILLE (312 W CAROLINA AVE in FLORENCE, SC)
(Resource Conservation and Recovery Act (tracking hazardous waste)) STATE MASTER (South Carolina database) - HAZARDOUS WASTE PROGRAM Organizations: CITY CLEANERS OF HARTSVILLE INC (CONTACT/OPERATOR)
, GEORGE M HARRISON JR (CONTACT/OWNER)
CAIN-POSTON FUNERAL HOME (512 WEST SECOND LOOP ROAD in FLORENCE, SC)
AIR MINOR (AIRS/AFS) STATE MASTER (South Carolina database) - AIR PROGRAM, Business SIC classification: FUNERAL SERVICE AND CREMATORIES Business NAICS classification: FUNERAL HOMES AND FUNERAL SERVICES. Organizations: REAJ CORPORATION (CONTACT/ENGINEERING/CONSULTING FIRM)
Alternative names: CAIN FUNERAL HOME INC
CAROLINAS HOSPITAL SYSTEM (1548 FREEDOM BOULEVARD in FLORENCE, SC)
AIR MINOR (AIRS/AFS) STATE MASTER (South Carolina database) - AIR PROGRAM Business SIC classification: GENERAL MEDICAL AND SURGICAL HOSPITALS Organizations: GRESHAM SMITH & PARTNERS (CONTACT/ENGINEERING/CONSULTING FIRM)
FLORENCE COUNTY HMCD SF (3200 S IRBY ST in FLORENCE, SC)
Conditionally Exempt Small Quantity Generators, less than 100 kg/month of hazardous waste (Resource Conservation and Recovery Act (tracking hazardous waste)) STATE MASTER (South Carolina database) - HAZARDOUS WASTE PROGRAM Organizations: FLORENCE COUNTY SCHOOLS DIST 1 (CONTACT/OWNER)
Alternative names: CITY OF FLORENCE PROJECT IMPACT
CHOICES SCHOOL (1405 POINSET DRIVE in FLORENCE, SC)
(National Center for Education Statistics) - STATE ID-1601610 Organizations: DARLINGTON COUNTY SCHOOL DISTRICT (SCHOOL DISTRICT)
CRYSTAL CLEANERS (2023 S IRBY ST in FLORENCE, SC)
(Resource Conservation and Recovery Act (tracking hazardous waste)) Organizations: GEORGE HARRISON (CONTACT/OWNER)
COLLINS & TURNER REALTY (2301 SOUTH IRBY ST. in FLORENCE, SC)
ENFORCEMENT/COMPLIANCE ACTIVITY (Integrated Compliance Information System)
Housing units lacking complete plumbing facilities: 1.8% Housing units lacking complete kitchen facilities: 2.5%
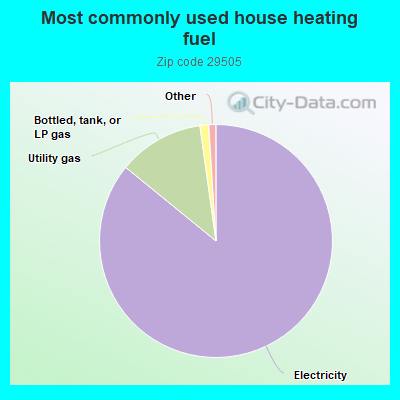
85.9%Electricity
11.9%Utility gas
1.2%Bottled, tank, or LP gas
Population in 1990: 1,440. Population change in the 1990s: +17,675 (+1227.4%).
Place of birth for U.S.-born residents:
This state: 17,584
Northeast: 2,168
Midwest: 714
South: 2,961
West: 494
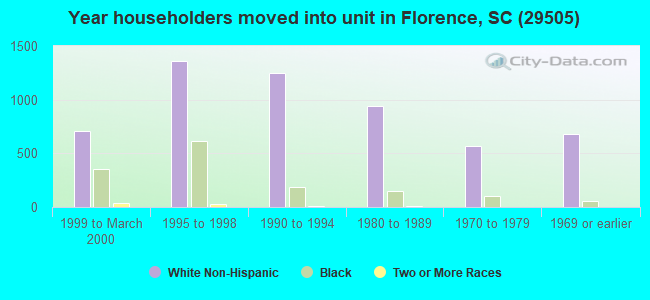
62% of the 29505 zip code residents lived in the same house 5 years ago. Out of people who lived in different houses, 61% lived in this county. Out of people who lived in different counties, 50% lived in South Carolina.
89% of the 29505 zip code residents lived in the same house 1 year ago. Out of people who lived in different houses, 37% moved from this county. Out of people who lived in different houses, 33% moved from different county within same state. Out of people who lived in different houses, 27% moved from different state. Out of people who lived in different houses, 3% moved from abroad.
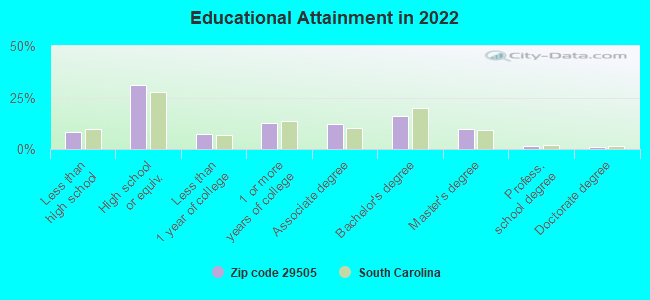
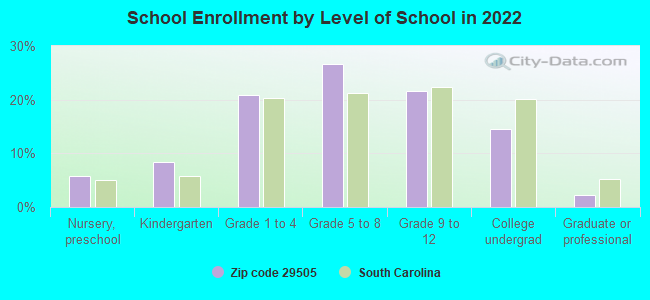
Private vs. public school enrollment:
Students in private schools in grades 1 to 8 (elementary and middle school): 510
Here:
16.7%
South Carolina:
14.4%
Students in private schools in grades 9 to 12 (high school): 30
Here:
2.2%
South Carolina:
11.1%
Students in private undergraduate colleges: 209
Here:
22.7%
South Carolina:
21.9%
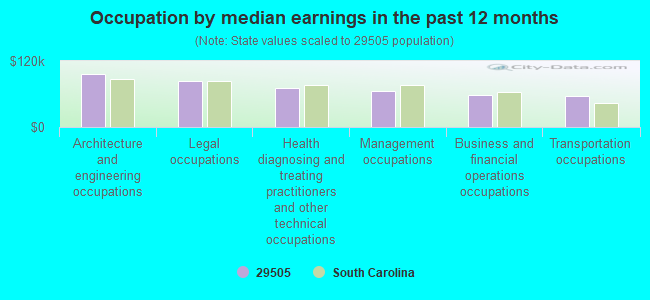
Occupation by median earnings in the past 12 months ($)
97,122Architecture and engineering occupations
83,555Legal occupations
71,042Health diagnosing and treating practitioners and other technical occupations
64,666Management occupations
57,542Business and financial operations occupations
56,655Transportation occupations
Companies with federal contracts located in this zip code (FLORENCE, SC):
SATIS, INC (1511 HERITAGE LN; small business) : $1,057,743 in 16 contractsfrom 1999 to 2006
Contracts for Installation of Equipment -- Automatic Data Processing Equipment (Including Firmware), Software, Supplies and Support Equipment, ADP Software, Defense Aircraft -- Basic Research (R&D), Services -- Basic Research (R&D), and moreby Air Force Signed by year:2000: $187,128; 2001: $93,745; 2002: $279,373; 2003: $171,320; 2004: $92,712; 2005: $92,720; 2006: $55,833.
Biggest contracts:
$98,400 with Air Force for Installation of Equipment -- Automatic Data Processing Equipment (Including Firmware), Software, Supplies and Support Equipment. Signed on 2000-08-22. Completion date: 2001-01-31.
$93,933 with Air Force for ADP Software. Taking place in GA. Signed on 2002-09-30. Completion date: 2003-03-31.
$93,745 with Air Force for Defense Aircraft -- Basic Research (R&D). Signed on 2001-09-26. Completion date: 2002-07-10.
$92,720 with Air Force for Services -- Basic Research (R&D). Taking place in GA. Signed on 2005-10-06. Completion date: 2006-09-30.
TOLEDO CAROLINA INC (125 TOLEDO RD; small business) : $177,764 in 8 contractsfrom 2002 to 2006
Contracts for Maintenance, Repair or Alteration of Real Property -- Other Non-Building Facilities, Maintenance, Repair or Alteration of Real Property -- Testing and Measurement Buildings, Maintenance, Repair and Rebuilding of Equipment -- Instruments and Laboratory Equipment by Army, Navy Signed by year:2000: $0; 2001: $0; 2002: $97,722; 2003: $33,743; 2004: $45,089; 2005: $0; 2006: $1,210.
Biggest contracts:
$64,758 with Army for Maintenance, Repair or Alteration of Real Property -- Other Non-Building Facilities. Taking place in NC. Signed on 2002-09-27. Completion date: 2003-01-06.
$56,704 with Army for Maintenance, Repair or Alteration of Real Property -- Testing and Measurement Buildings. Taking place in NC. Signed on 2004-11-01. Completion date: 2005-10-01.
$33,743 with Army for Maintenance, Repair or Alteration of Real Property -- Other Non-Building Facilities. Taking place in NC. Signed on 2003-05-27. Completion date: 2003-01-06.
$32,964 with Army for Maintenance, Repair and Rebuilding of Equipment -- Instruments and Laboratory Equipment. Taking place in NC. Signed on 2002-11-26. Completion date: 2003-09-30.
ALTMAN TRACTOR AND EQUIPMENT C (1808 PAMPLICO HWY; small business) : $105,745 in 3 contractsfrom 1999 to 2003
$89,000 with Forest Service (disused code: now 12C2) for Soil Preparation Equipment. Signed on 1999-10-15. Completion date: 2000-01-15.
$10,000 with Agricultural Research Service (disused code) for Soil Preparation Equipment. Signed on 2002-09-15. Completion date: 2002-11-15.
$6,745 with Army for Miscellaneous Service and Trade Equipment. Signed on 2003-09-25. Completion date: 2003-10-31.
CAYCE COMPANY INC (2710 S IRBY ST) : $34,208 in 3 contractsfrom 2004 to 2005
$24,728 with Army for Construction of Structures and Facilities -- Hospitals and Infirmaries. Signed on 2004-09-27. Completion date: 2005-01-30.
$5,263 with Army for Technical Representation Services -- Refrigeration, Air Conditioning, and Air Circulating Equipment. Signed on 2005-09-28. Completion date: 2005-10-28.
$4,217 with Army for Construction of Structures and Facilities -- Hospitals and Infirmaries. Signed on 2004-09-28. Completion date: 2004-12-30.
FLORENCE RESTAURANT SUPPLY, IN (1310 MEADORS FARM RD; small business) : $33,785 in 3 contractsfrom 2001 to 2005
$26,000 with Forest Service (disused code: now 12C2) for Miscellaneous Items. Taking place in CO. Signed on 2001-09-15. Completion date: 2001-09-15.
$4,478 with Army for Miscellaneous Furniture and Fixtures. Signed on 2004-09-23. Completion date: 2004-10-22.
$3,307 with Army for Refrigeration Equipment. Signed on 2005-12-14. Completion date: 2006-01-17.
KNIGHT FURNITURE SHOWROOMS, IN (214 2ND LOOP RD; small business)
$4,320 with Air Force for Miscellaneous Furniture and Fixtures. Signed on 2005-08-02. Completion date: 2005-08-30.
Top industries in this zip code by the number of employees in 2005:
Health Care and Social Assistance: General Medical and Surgical Hospitals (over 1000 employees: 1 establishment)
Other Services (except Public Administration): Religious Organizations (100-249: 1, 20-49: 5, 10-19: 1, 5-9: 2, 1-4: 4)
2004 - 2018 National Fire Incident Reporting System (NFIRS) incidents
Based on the data from the years 2004 - 2018 the average number of fire incidents per year is 132. The highest number of reported fire incidents - 264 took place in 2011, and the least - 14 in 2004. The data has an increasing trend.
When looking into fire subcategories, the most reports belonged to: Outside Fires (51.0%), and Structure Fires (32.6%).
Fire incident types reported to NFIRS in Zip Code 29505

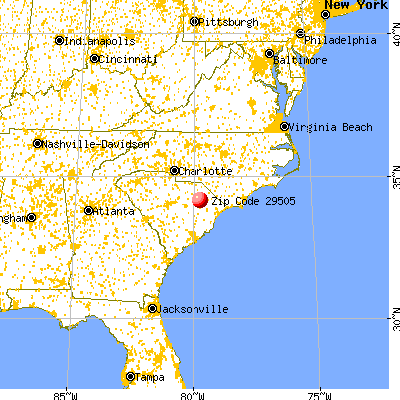


 Nearest zip codes: 29541, 29506, 29530, 29501, 29583, 29591.


 Based on the data from the years 2004 - 2018 the average number of fire incidents per year is 132. The highest number of reported fire incidents - 264 took place in 2011, and the least - 14 in 2004. The data has an increasing trend.
 When looking into fire subcategories, the most reports belonged to: Outside Fires (51.0%), and Structure Fires (32.6%).