Estimated zip code population in 2022: 4,922 Zip code population in 2010: 4,856 Zip code population in 2000: 4,940
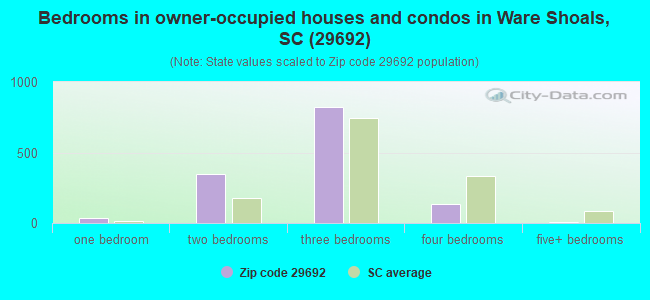
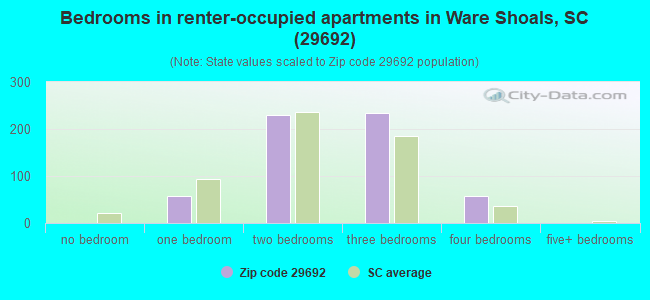
Houses and condos: 2,497 Renter-occupied apartments: 580
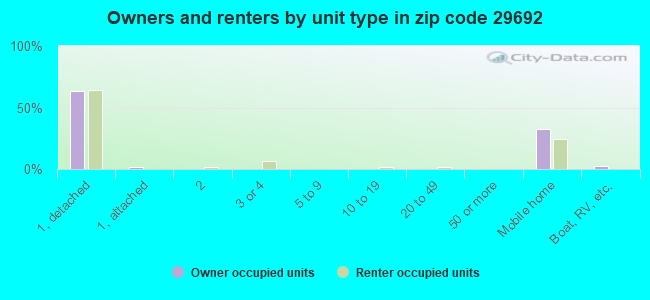
% of renters here:
30%
State:
28%
March 2022 cost of living index in zip code 29692: 79.5 (low, U.S. average is 100)
Land area: 48.3 sq. mi. Water area: 0.7 sq. mi.
Population density: 102 people per square mile
(very low).
OSM Map
General Map
Google Map
MSN Map
OSM Map
General Map
Google Map
MSN Map
OSM Map
General Map
Google Map
MSN Map
OSM Map
General Map
Google Map
MSN Map
Please wait while loading the map...
Real estate property taxes paid for housing units in 2022:
This zip code:
0.5% ($499)
South Carolina:
0.5% ($1,185)
Median real estate property taxes paid for housing units with mortgages in 2022: $554 (0.5%) Median real estate property taxes paid for housing units with no mortgage in 2022: $395 (0.5%)
Business Search- 14 Million verified businesses
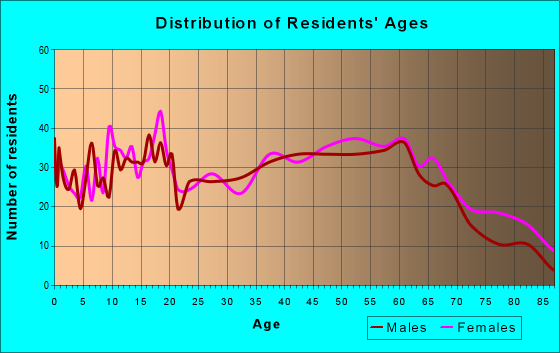
Males: 2,412
(49.0%)
Females: 2,510
(51.0%)
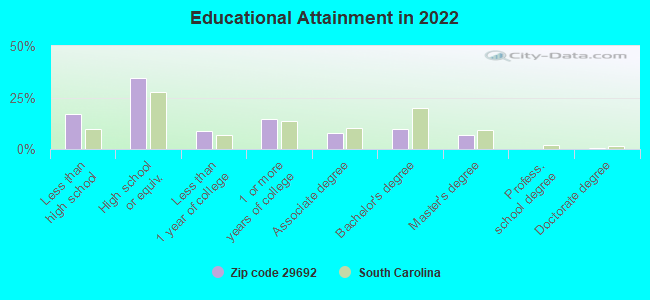
For population 25 years and over in 29692:
High school or higher: 81.9%
Bachelor's degree or higher: 17.1%
Graduate or professional degree: 7.5%
Unemployed: 2.6%
Mean travel time to work (commute): 32.5 minutes
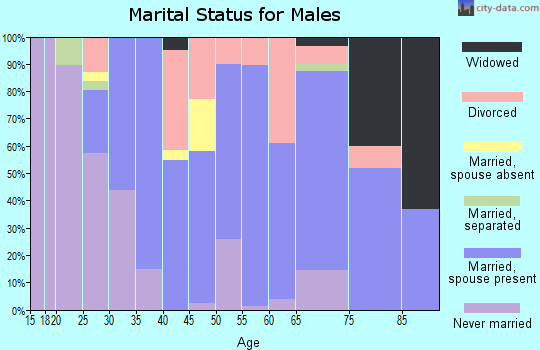
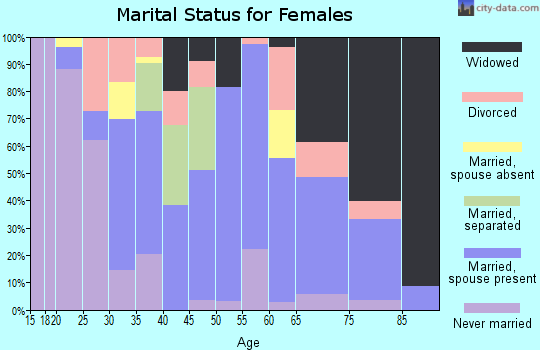
For population 15 years and over in 29692:
Never married: 26.0%
Now married: 43.9%
Separated: 5.2%
Widowed: 9.6%
Divorced: 15.3%
Zip code 29692 compared to state average:
Median household income below state average.
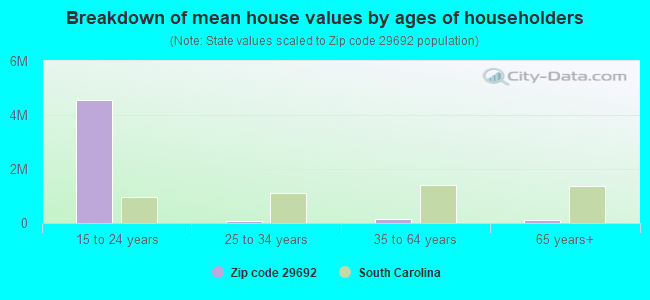
Median house value significantly below state average.
Black race population percentage below state average.
Median age below state average.
Foreign-born population percentage significantly below state average.
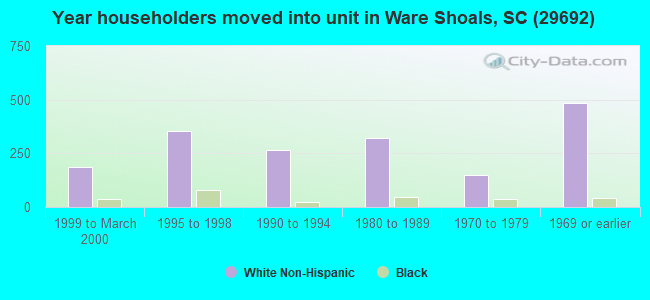
Length of stay since moving in significantly above state average.
House age above state average.
Number of college students below state average.
Percentage of population with a bachelor's degree or higher below state average.
Estimated median house/condo value in 2022: $103,512
29692:
$103,512
South Carolina:
$254,600
According to our research of South Carolina and other state lists, there was 1 registered sex offender living in 29692 zip code as of April 26, 2024. The ratio of all residents to sex offenders in zip code 29692 is 4,816 to 1. The ratio of registered sex offenders to all residents in this zip code is much lower than the state average.
Median resident age:
This zip code:
35.8 years
South Carolina median age:
40.5 years
Average household size:
This zip code:
2.5 people
South Carolina:
2.4 people
Averages for the 2020 tax year for zip code 29692, filed in 2021:
Average Adjusted Gross Income (AGI) in 2020: $42,383 (Individual Income Tax Returns)
Here:
$42,383
State:
$65,754
Salary/wage: $38,405 (reported on 84.7% of returns)
Here:
$38,405
State:
$52,566
(% of AGI for various income ranges: 1192.5% for AGIs below $25k, 3820.9% for AGIs $25k-50k, 6355.0% for AGIs $50k-75k, 10140.0% for AGIs $75k-100k, 18312.2% for AGIs $100k-200k)
Taxable interest for individuals: $567 (reported on 16.3% of returns)
This zip code:
$567
South Carolina:
$1,749
(% of AGI for various income ranges: 6.3% for AGIs below $25k, 7.4% for AGIs $25k-50k, 21.5% for AGIs $50k-75k, 25.5% for AGIs $75k-100k, 45.6% for AGIs $100k-200k)
Ordinary dividends: $2,556 (reported on 7.9% of returns)
Here:
$2,556
State:
$8,783
(% of AGI for various income ranges: 10.5% for AGIs below $25k, 12.6% for AGIs $25k-50k, 41.0% for AGIs $50k-75k, 223.3% for AGIs $100k-200k)
Net capital gain/loss in AGI: +$6,183 (reported on 5.9% of returns)
Here:
+$6,183
State:
+$24,194
(% of AGI for various income ranges: 10.0% for AGIs $25k-50k, 117.5% for AGIs $50k-75k, 512.2% for AGIs $100k-200k)
Profit/loss from business: +$3,962 (reported on 11.9% of returns)
Here:
+$3,962
State:
+$11,253
(% of AGI for various income ranges: 70.0% for AGIs below $25k, 18.0% for AGIs $25k-50k, 71.5% for AGIs $50k-75k, 245.5% for AGIs $75k-100k)
Taxable individual retirement arrangement distribution: $12,780 (reported on 7.4% of returns)
29692:
$12,780
South Carolina:
$21,604
(% of AGI for various income ranges: 50.2% for AGIs below $25k, 78.5% for AGIs $25k-50k, 299.0% for AGIs $50k-75k, 702.2% for AGIs $100k-200k)
Total itemized deductions: $25,533 (reported on 3.0% of returns)
Here:
$25,533
State:
$35,199
(% of AGI for various income ranges: 446.0% for AGIs $50k-75k, 711.1% for AGIs $100k-200k)
Charity contributions: $10,325 (reported on 2.0% of returns)
Here:
$10,325
State:
$14,319
(% of AGI for various income ranges: 375.5% for AGIs $75k-100k)
Taxes paid: $6,760 (reported on 2.5% of returns)
29692:
$6,760
State:
$7,486
(% of AGI for various income ranges: 77.0% for AGIs $50k-75k, 204.4% for AGIs $100k-200k)
Earned income credit: $2,487 (reported on 27.2% of returns)
Here:
$2,487
State:
$2,397
(% of AGI for various income ranges: 135.2% for AGIs below $25k, 106.3% for AGIs $25k-50k)
Percentage of individuals using paid preparers for their 2020 taxes: 93.1%
Here:
93%
State:
93%
(% for various income ranges: 90.5% for AGIs below $25k, 94.9% for AGIs $25k-50k, 92.6% for AGIs $50k-75k, 93.8% for AGIs $75k-100k, 100.0% for AGIs $100k-200k)
Averages for the 2012 tax year for zip code 29692, filed in 2013:
Average Adjusted Gross Income (AGI) in 2012: $36,751 (Individual Income Tax Returns)
Here:
$36,751
State:
$51,133
Salary/wage: $33,243 (reported on 85.9% of returns)
Here:
$33,243
State:
$42,173
(% of AGI for various income ranges: 76.3% for AGIs below $25k, 83.7% for AGIs $25k-50k, 80.1% for AGIs $50k-75k, 79.4% for AGIs $75k-100k, 66.9% for AGIs $100k-200k)
Taxable interest for individuals: $716 (reported on 19.8% of returns)
This zip code:
$716
South Carolina:
$1,468
(% of AGI for various income ranges: 0.9% for AGIs below $25k, 0.4% for AGIs $25k-50k, 0.2% for AGIs $50k-75k, 0.4% for AGIs $75k-100k, 0.2% for AGIs $100k-200k)
Ordinary dividends: $1,433 (reported on 9.4% of returns)
Here:
$1,433
State:
$6,511
(% of AGI for various income ranges: 0.2% for AGIs below $25k, 0.6% for AGIs $25k-50k, 0.1% for AGIs $50k-75k, 0.3% for AGIs $75k-100k, 0.5% for AGIs $100k-200k)
Net capital gain/loss in AGI: +$2,008 (reported on 6.2% of returns)
Here:
+$2,008
State:
+$13,061
(% of AGI for various income ranges: 2.2% for AGIs $75k-100k)
Profit/loss from business: +$4,479 (reported on 12.5% of returns)
Here:
+$4,479
State:
+$10,167
(% of AGI for various income ranges: 6.5% for AGIs below $25k, 0.6% for AGIs $50k-75k, 1.8% for AGIs $75k-100k)
Taxable individual retirement arrangement distribution: $11,829 (reported on 8.9% of returns)
29692:
$11,829
South Carolina:
$17,019
(% of AGI for various income ranges: 2.5% for AGIs below $25k, 2.8% for AGIs $25k-50k, 3.1% for AGIs $50k-75k, 6.5% for AGIs $75k-100k)
Total itemized deductions: $17,706 (24% of AGI, reported on 16.1% of returns)
Here:
$17,706
State:
$22,890
Here:
24.1% of AGI
State:
21.4% of AGI
(% of AGI for various income ranges: 3.4% for AGIs below $25k, 7.3% for AGIs $25k-50k, 8.2% for AGIs $50k-75k, 7.9% for AGIs $75k-100k, 11.9% for AGIs $100k-200k)
Charity contributions: $4,504 (reported on 13.5% of returns)
Here:
$4,504
State:
$5,169
(% of AGI for various income ranges: 0.4% for AGIs below $25k, 1.9% for AGIs $25k-50k, 1.6% for AGIs $50k-75k, 2.0% for AGIs $75k-100k, 2.4% for AGIs $100k-200k)
Taxes paid: $5,110 (reported on 15.6% of returns)
29692:
$5,110
State:
$7,644
(% of AGI for various income ranges: 0.4% for AGIs below $25k, 1.2% for AGIs $25k-50k, 2.0% for AGIs $50k-75k, 2.9% for AGIs $75k-100k, 4.7% for AGIs $100k-200k)
Earned income credit: $2,558 (reported on 29.7% of returns)
Here:
$2,558
State:
$2,418
(% of AGI for various income ranges: 9.8% for AGIs below $25k, 1.3% for AGIs $25k-50k)
Percentage of individuals using paid preparers for their 2012 taxes: 60.4%
Here:
60%
State:
57%
(% for various income ranges: 60.0% for AGIs below $25k, 59.2% for AGIs $25k-50k, 65.4% for AGIs $50k-75k, 61.5% for AGIs $75k-100k, 55.6% for AGIs $100k-200k)
Averages for the 2004 tax year for zip code 29692, filed in 2005:
Average Adjusted Gross Income (AGI) in 2004: $31,564 (Individual Income Tax Returns)
Here:
$31,564
State:
$41,965
Salary/wage: $29,565 (reported on 86.5% of returns)
Here:
$29,565
State:
$35,695
(% of AGI for various income ranges: 73.2% for AGIs below $10k, 78.2% for AGIs $10k-25k, 83.7% for AGIs $25k-50k, 82.7% for AGIs $50k-75k, 88.7% for AGIs $75k-100k, 67.8% for AGIs over 100k)
Taxable interest for individuals: $1,500 (reported on 27.5% of returns)
This zip code:
$1,500
South Carolina:
$1,623
(% of AGI for various income ranges: 4.8% for AGIs below $10k, 1.9% for AGIs $10k-25k, 0.7% for AGIs $25k-50k, 1.9% for AGIs $50k-75k, 0.2% for AGIs $75k-100k, 0.8% for AGIs over 100k)
Taxable dividends: $992 (reported on 12.7% of returns)
Here:
$992
State:
$3,999
(% of AGI for various income ranges: 0.5% for AGIs below $10k, 0.5% for AGIs $10k-25k, 0.2% for AGIs $25k-50k, 0.5% for AGIs $50k-75k, 0.4% for AGIs $75k-100k, 0.6% for AGIs over 100k)
Net capital gain/loss: +$2,147 (reported on 9.7% of returns)
Here:
+$2,147
State:
+$13,100
(% of AGI for various income ranges: -0.2% for AGIs below $10k, 0.2% for AGIs $10k-25k, 1.4% for AGIs $25k-50k, 0.0% for AGIs $50k-75k, 0.0% for AGIs $75k-100k, 1.6% for AGIs over 100k)
Profit/loss from business: +$3,695 (reported on 12.6% of returns)
Here:
+$3,695
State:
+$9,144
(% of AGI for various income ranges: 11.9% for AGIs below $10k, 3.8% for AGIs $10k-25k, 1.3% for AGIs $25k-50k, 0.3% for AGIs $50k-75k, -0.4% for AGIs $75k-100k)
Total itemized deductions: $14,560 (23% of AGI, reported on 21.7% of returns)
Here:
$14,560
State:
$19,039
Here:
23.3% of AGI
State:
22.8% of AGI
(% of AGI for various income ranges: 5.5% for AGIs $10k-25k, 9.2% for AGIs $25k-50k, 12.5% for AGIs $50k-75k, 13.9% for AGIs $75k-100k, 12.3% for AGIs over 100k)
Charity contributions deductions: $3,360 (5% of AGI, reported on 19.8% of returns)
Here:
$3,360
State:
$4,305
Here:
5.2% of AGI
State:
5.0% of AGI
(% of AGI for various income ranges: 1.1% for AGIs $10k-25k, 1.8% for AGIs $25k-50k, 2.7% for AGIs $50k-75k, 3.0% for AGIs $75k-100k, 2.8% for AGIs over 100k)
Total tax: $3,673 (reported on 66.8% of returns)
29692:
$3,673
State:
$6,497
(% of AGI for various income ranges: 2.6% for AGIs below $10k, 3.1% for AGIs $10k-25k, 5.9% for AGIs $25k-50k, 8.3% for AGIs $50k-75k, 9.7% for AGIs $75k-100k, 18.1% for AGIs over 100k)
Earned income credit: $1,783 (reported on 28.0% of returns)
Here:
$1,783
State:
$1,882
Percentage of individuals using paid preparers for their 2004 taxes: 62.5%
Here:
63%
State:
66%
(% for various income ranges: 55.7% for AGIs below $10k, 64.5% for AGIs $10k-25k, 66.1% for AGIs $25k-50k, 63.4% for AGIs $50k-75k, 55.2% for AGIs $75k-100k, 69.8% for AGIs over 100k)
Likely homosexual households (counted as self-reported same-sex unmarried-partner households)
Lesbian couples: 0.4% of all households
Gay men: 0.0% of all households
Household received Food Stamps/SNAP in the past 12 months: 266 Household did not receive Food Stamps/SNAP in the past 12 months: 1,689
Women who had a birth in the past 12 months: 98 (20 now married, 72 unmarried) Women who did not have a birth in the past 12 months: 848 (423 now married, 426 unmarried)
Housing units in zip code 29692 with a mortgage: 703 (14 second mortgage, 14 both second mortgage and home equity loan) Houses without a mortgage: 10
Median monthly owner costs for units with a mortgage: $900 Median monthly owner costs for units without a mortgage: $321
Residents with income below the poverty level in 2022:
This zip code:
32.1%
Whole state:
14.0%
Residents with income below 50% of the poverty level in 2022:
This zip code:
26.7%
Whole state:
7.3%
Median number of rooms in houses and condos:
Here:
5.7
State:
6.4
Median number of rooms in apartments:
Here:
5.3
State:
4.5
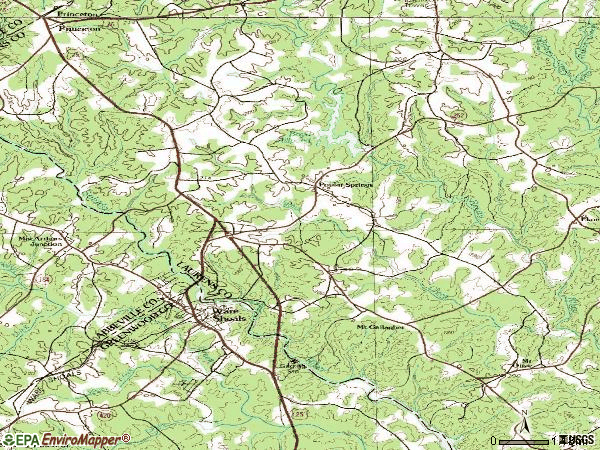
Notable locations in this zip code not listed on our city pages
Notable locations in zip code 29692: Ware Shaols Golf Course (A), Ware Shoals Fire Department Station 45 (B), Laurens County Fire Department Western Laurens (C), Laurens County Fire Department Western Laurens Station 2 (D). Display/hide their locations on the map
Churches in zip code 29692 include: Walnut Grove Church (A), Bethel Church (B), First Presbyterian Church (C), Ware Shoals First Baptist Church (D), Mount Bethel Church (E), Ware Shoals Pentecostal Holiness Church (F), Ware Shoals United Methodist Church (G), West Main Church of God (H), Mount Athen Church (I). Display/hide their locations on the map
Cemeteries: Turkey Creek Cemetery (1), Dunns Creek Cemetery (2), Kings Chapel Cemetery (3), Mount Bethel Cemetery (4), Mount Galliger Cemetery (5), Poplar Springs Cemetery (6). Display/hide their locations on the map
Reservoirs: Ware Shoals Reservoir (A), Hendricks Pond (B), Boyd Millpond (C), Ziegenfuss Pond (D), Knights Pond (E). Display/hide their locations on the map
In group quarters: 104 (-1 institutionalized population)
Size of family households: 623 2-persons, 349 3-persons, 102 4-persons, 67 5-persons, 93 6-persons, 10 7-or-more-persons
Size of nonfamily households: 642 1-person, 63 2-persons, 6 5-persons
484 married couples with children.
521 single-parent households (367 men, 154 women).
95.1% of residents of 29692 zip code speak English at home.
2.4% of residents speak Spanish at home (73% very well, 11% well, 16% not well).
0.5% of residents speak other Indo-European language at home (96% very well, 4% not well).
1.9% of residents speak Asian or Pacific Island language at home (93% very well, 7% not well).
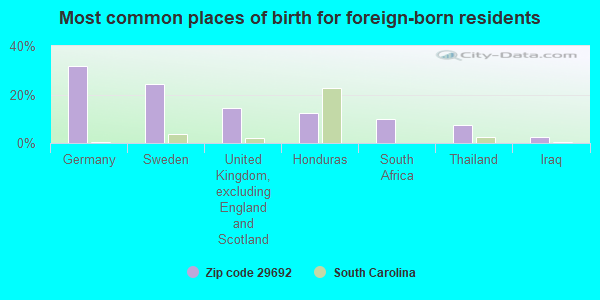
Foreign born population: 44 (0.9%) (89.3% of them are naturalized citizens)
This zip code:
0.9%
Whole state:
5.2%
32%Germany
24%Sweden
15%United Kingdom, excluding England and Scotland
12%Honduras
10%South Africa
7%Thailand
2%Iraq
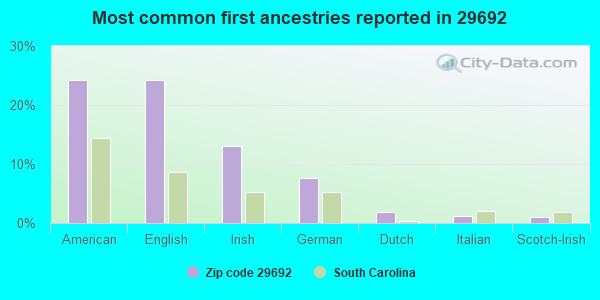
24%American
24%English
13%Irish
8%German
2%Dutch
1%Italian
1%Scotch-Irish
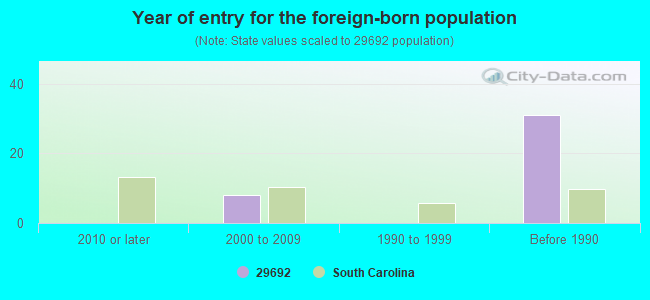
Year of entry for the foreign-born population
02010 or later
82000 to 2009
01990 to 1999
31Before 1990
Facilities with environmental interests located in this zip code:
CORONET INDUSTRIES (HIGHWAY 25 SOUTH in WARE SHOALS, SC)
AIR MINOR (AIRS/AFS) (Resource Conservation and Recovery Act (tracking hazardous waste)) STATE MASTER (South Carolina database) - AIR PROGRAM, HAZARDOUS WASTE PROGRAM Business SIC classification: YARN SPINNING MILLS Organizations: OPERNAME (CONTACT/OPERATOR)
Alternative names: CORONET - CLOSED
DAIRY STREET WASTEWATER TREATMENT PLANT (100 DAIRY STREET in WARE SHOALS, SC)
CRITERIA AND HAZARDOUS AIR POLLUTANT INVENTORY (Inventory of air pollution sources) National Pollutant Discharge Elimination System MAJOR (Tracking pollutant discharge elimination systems) - permit STATE MASTER (South Carolina database) - LABORATORY CERTIFICATION COMMUNITY WATER SYSTEM (SDWIS) Business SIC classification: SEWERAGE SYSTEMS Organizations: WARE SHOALS/DAIRY STREET (CONTACT/OWNER)
Alternative names: WARE SHOALS/DAIRY STREET, WARE SHOALS WASTEWATER PLANT
ACKERSON STEVENS INCORPORATED (5 PONDEROSA DR in WARE SHOALS, SC)
AIR MINOR (AIRS/AFS) STATE MASTER (South Carolina database) - AIR PROGRAM, Business SIC classification: HARDWOOD DIMENSION AND FLOORING MILLS; MILLWORK; LUMBER AND OTHER BUILDING MATERIALS DEALERS
CAROLINA DYE WORKS (2924 NATION ROAD in WARE SHOALS, SC)
AIR MINOR (AIRS/AFS) STATE MASTER (South Carolina database) - AIR PROGRAM, Business SIC classification: FINISHERS OF BROADWOVEN FABRICS OF COTTON; FINISHERS OF TEXTILES; TEXTILE GOODS
BAXTER TUBE COMPANY WARE SHOALS (# 1 QUALITY WAY in WARE SHOALS, SC)
Conditionally Exempt Small Quantity Generators, less than 100 kg/month of hazardous waste (Resource Conservation and Recovery Act (tracking hazardous waste)) - notification STATE MASTER (South Carolina database) - HAZARDOUS WASTE PROGRAM Organizations: GEM INC (CONTACT/OWNER)
ACKERSON STEVENS, INC. (2930 NATION RD. in WARE SHOALS, SC)
AIR MINOR (AIRS/AFS) Business SIC classification: LUMBER AND OTHER BUILDING MATERIALS DEALERS
Housing units lacking complete plumbing facilities: 5.7% Housing units lacking complete kitchen facilities: 6.7%
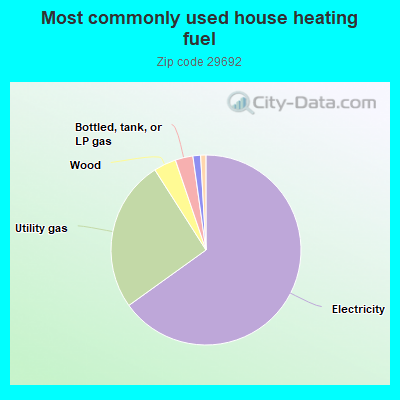
64.9%Electricity
25.8%Utility gas
3.8%Wood
3.0%Bottled, tank, or LP gas
1.3%Solar energy
0.9%No fuel used
Population in 1990: 4,442. Population change in the 1990s: +498 (+11.2%).
Place of birth for U.S.-born residents:
This state: 3,742
Northeast: 148
Midwest: 125
South: 720
West: 69
65% of the 29692 zip code residents lived in the same house 5 years ago. Out of people who lived in different houses, 43% lived in this county. Out of people who lived in different counties, 50% lived in South Carolina.
87% of the 29692 zip code residents lived in the same house 1 year ago. Out of people who lived in different houses, 14% moved from this county. Out of people who lived in different houses, 72% moved from different county within same state. Out of people who lived in different houses, 17% moved from different state.
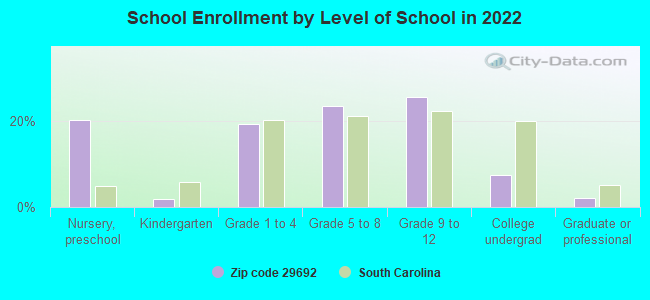
Private vs. public school enrollment:
Students in private schools in grades 1 to 8 (elementary and middle school): 16
Here:
4.7%
South Carolina:
14.4%
Students in private schools in grades 9 to 12 (high school):
Here:
0.0%
South Carolina:
11.1%
Students in private undergraduate colleges: 12
Here:
19.7%
South Carolina:
21.9%
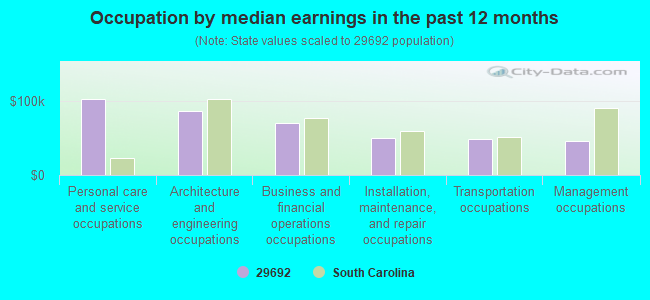
Occupation by median earnings in the past 12 months ($)
102,696Personal care and service occupations
86,534Architecture and engineering occupations
69,712Business and financial operations occupations
50,263Installation, maintenance, and repair occupations
49,141Transportation occupations
46,376Management occupations
Top industries in this zip code by the number of employees in 2005:
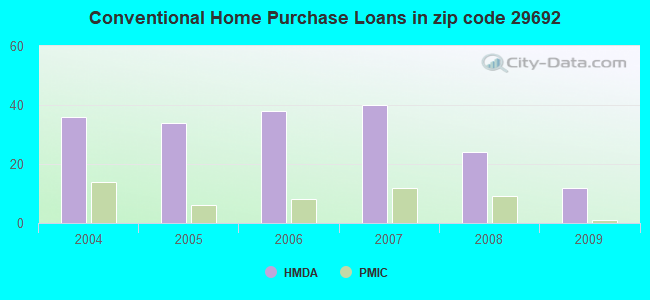
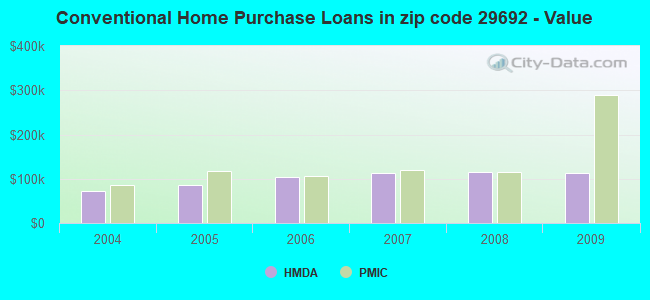
Detailed PMIC statistics for the following Tracts:9802.00
2002 - 2018 National Fire Incident Reporting System (NFIRS) incidents
According to the data from the years 2002 - 2018 the average number of fire incidents per year is 38. The highest number of reported fire incidents - 82 took place in 2016, and the least - 11 in 2009. The data has an increasing trend.
When looking into fire subcategories, the most incidents belonged to: Outside Fires (42.0%), and Structure Fires (41.8%).
Fire incident types reported to NFIRS in Zip Code 29692


 Nearest zip codes: 29653, 29638, 29384, 29654, 29360, 29649.
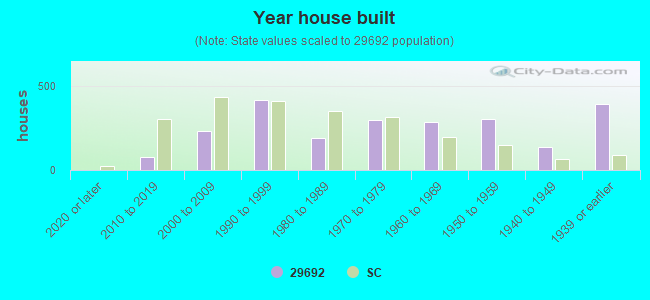


 According to the data from the years 2002 - 2018 the average number of fire incidents per year is 38. The highest number of reported fire incidents - 82 took place in 2016, and the least - 11 in 2009. The data has an increasing trend.
 When looking into fire subcategories, the most incidents belonged to: Outside Fires (42.0%), and Structure Fires (41.8%).