Estimated zip code population in 2022: 5,960 Zip code population in 2010: 6,498 Zip code population in 2000: 6,048
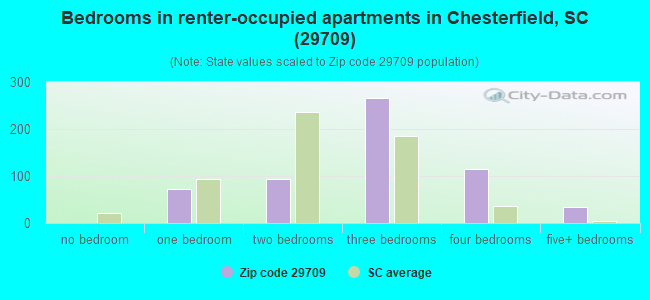
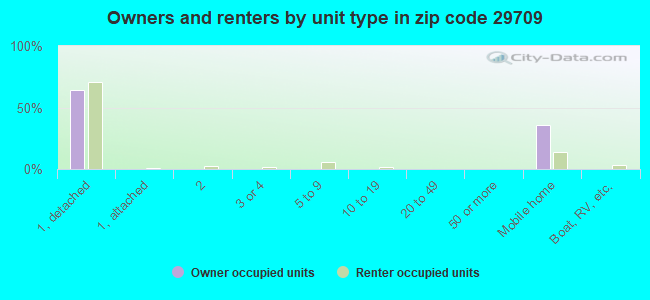
Houses and condos: 2,879 Renter-occupied apartments: 583
% of renters here:
23%
State:
28%
March 2022 cost of living index in zip code 29709: 79.1 (low, U.S. average is 100)
Land area: 97.7 sq. mi. Water area: 0.4 sq. mi.
Population density: 61 people per square mile
(very low).
OSM Map
General Map
Google Map
MSN Map
OSM Map
General Map
Google Map
MSN Map
OSM Map
General Map
Google Map
MSN Map
OSM Map
General Map
Google Map
MSN Map
Please wait while loading the map...
Real estate property taxes paid for housing units in 2022:
This zip code:
0.5% ($590)
South Carolina:
0.5% ($1,185)
Median real estate property taxes paid for housing units with mortgages in 2022: $809 (0.7%) Median real estate property taxes paid for housing units with no mortgage in 2022: $485 (0.5%)
Business Search- 14 Million verified businesses
Males: 2,929
(49.1%)
Females: 3,031
(50.9%)
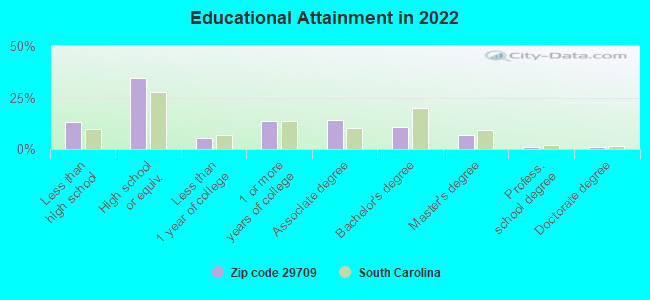
For population 25 years and over in 29709:
High school or higher: 85.3%
Bachelor's degree or higher: 19.1%
Graduate or professional degree: 8.7%
Unemployed: 4.3%
Mean travel time to work (commute): 23.4 minutes
For population 15 years and over in 29709:
Never married: 23.2%
Now married: 52.0%
Separated: 1.7%
Widowed: 11.6%
Divorced: 11.5%
Zip code 29709 compared to state average:
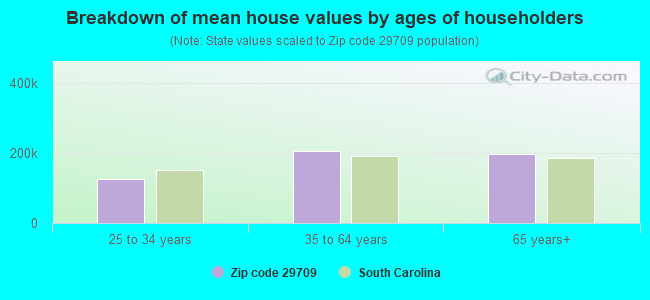
Median house value significantly below state average.
Hispanic race population percentage below state average.
Foreign-born population percentage significantly below state average.
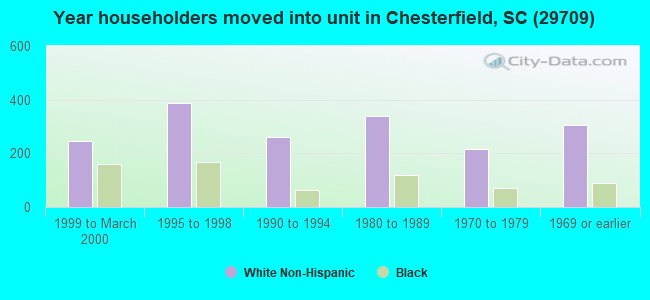
Length of stay since moving in significantly above state average.
Percentage of population with a bachelor's degree or higher below state average.
Estimated median house/condo value in 2022: $110,696
29709:
$110,696
South Carolina:
$254,600
According to our research of South Carolina and other state lists, there were 5 registered sex offenders living in 29709 zip code as of April 27, 2024. The ratio of all residents to sex offenders in zip code 29709 is 1,244 to 1. The ratio of registered sex offenders to all residents in this zip code is near the state average.
Median resident age:
This zip code:
43.1 years
South Carolina median age:
40.5 years
Average household size:
This zip code:
2.3 people
South Carolina:
2.4 people
Averages for the 2020 tax year for zip code 29709, filed in 2021:
Average Adjusted Gross Income (AGI) in 2020: $48,688 (Individual Income Tax Returns)
Here:
$48,688
State:
$65,754
Salary/wage: $41,348 (reported on 83.8% of returns)
Here:
$41,348
State:
$52,566
(% of AGI for various income ranges: 1241.9% for AGIs below $25k, 3987.9% for AGIs $25k-50k, 7729.2% for AGIs $50k-75k, 10140.7% for AGIs $75k-100k, 16757.9% for AGIs $100k-200k)
Taxable interest for individuals: $1,089 (reported on 20.7% of returns)
This zip code:
$1,089
South Carolina:
$1,749
(% of AGI for various income ranges: 14.8% for AGIs below $25k, 32.6% for AGIs $25k-50k, 38.3% for AGIs $50k-75k, 50.7% for AGIs $75k-100k, 68.6% for AGIs $100k-200k)
Ordinary dividends: $3,904 (reported on 9.8% of returns)
Here:
$3,904
State:
$8,783
(% of AGI for various income ranges: 9.2% for AGIs below $25k, 18.6% for AGIs $25k-50k, 65.4% for AGIs $50k-75k, 52.7% for AGIs $75k-100k, 432.9% for AGIs $100k-200k)
Net capital gain/loss in AGI: +$9,719 (reported on 9.8% of returns)
Here:
+$9,719
State:
+$24,194
(% of AGI for various income ranges: 0.4% for AGIs below $25k, 7.7% for AGIs $25k-50k, 141.7% for AGIs $50k-75k, 81.3% for AGIs $75k-100k, 1441.4% for AGIs $100k-200k)
Profit/loss from business: +$11,319 (reported on 13.5% of returns)
Here:
+$11,319
State:
+$11,253
(% of AGI for various income ranges: 93.2% for AGIs below $25k, 44.7% for AGIs $25k-50k, 50.8% for AGIs $50k-75k, 371.3% for AGIs $75k-100k, 1757.9% for AGIs $100k-200k)
Taxable individual retirement arrangement distribution: $14,630 (reported on 8.6% of returns)
29709:
$14,630
South Carolina:
$21,604
(% of AGI for various income ranges: 59.2% for AGIs below $25k, 90.4% for AGIs $25k-50k, 155.0% for AGIs $50k-75k, 551.3% for AGIs $75k-100k, 870.7% for AGIs $100k-200k)
Total itemized deductions: $25,657 (reported on 2.6% of returns)
Here:
$25,657
State:
$35,199
(% of AGI for various income ranges: 335.4% for AGIs $50k-75k, 707.9% for AGIs $100k-200k)
Charity contributions: $9,350 (reported on 2.3% of returns)
Here:
$9,350
State:
$14,319
(% of AGI for various income ranges: 104.2% for AGIs $50k-75k, 222.1% for AGIs $100k-200k)
Taxes paid: $6,171 (reported on 2.6% of returns)
29709:
$6,171
State:
$7,486
(% of AGI for various income ranges: 66.7% for AGIs $50k-75k, 194.3% for AGIs $100k-200k)
Earned income credit: $2,532 (reported on 22.2% of returns)
Here:
$2,532
State:
$2,397
(% of AGI for various income ranges: 138.9% for AGIs below $25k, 84.2% for AGIs $25k-50k)
Percentage of individuals using paid preparers for their 2020 taxes: 94.7%
Here:
95%
State:
93%
(% for various income ranges: 93.9% for AGIs below $25k, 94.8% for AGIs $25k-50k, 94.6% for AGIs $50k-75k, 96.0% for AGIs $75k-100k, 96.0% for AGIs $100k-200k, 100.0% for AGIs over 200k)
Averages for the 2012 tax year for zip code 29709, filed in 2013:
Average Adjusted Gross Income (AGI) in 2012: $42,544 (Individual Income Tax Returns)
Here:
$42,544
State:
$51,133
Salary/wage: $36,178 (reported on 84.2% of returns)
Here:
$36,178
State:
$42,173
(% of AGI for various income ranges: 77.6% for AGIs below $25k, 83.6% for AGIs $25k-50k, 81.7% for AGIs $50k-75k, 75.3% for AGIs $75k-100k, 72.0% for AGIs $100k-200k, 26.7% for AGIs over 200k)
Taxable interest for individuals: $1,325 (reported on 24.9% of returns)
This zip code:
$1,325
South Carolina:
$1,468
(% of AGI for various income ranges: 1.0% for AGIs below $25k, 0.8% for AGIs $25k-50k, 0.7% for AGIs $50k-75k, 0.6% for AGIs $75k-100k, 0.4% for AGIs $100k-200k, 1.1% for AGIs over 200k)
Ordinary dividends: $2,554 (reported on 11.1% of returns)
Here:
$2,554
State:
$6,511
(% of AGI for various income ranges: 0.4% for AGIs below $25k, 0.4% for AGIs $25k-50k, 0.9% for AGIs $50k-75k, 0.8% for AGIs $75k-100k, 1.4% for AGIs $100k-200k)
Net capital gain/loss in AGI: +$13,488 (reported on 10.3% of returns)
Here:
+$13,488
State:
+$13,061
(% of AGI for various income ranges: 0.3% for AGIs below $25k, 0.4% for AGIs $25k-50k, 0.6% for AGIs $50k-75k, 1.7% for AGIs $75k-100k, 1.8% for AGIs $100k-200k, 17.9% for AGIs over 200k)
Profit/loss from business: +$7,522 (reported on 15.8% of returns)
Here:
+$7,522
State:
+$10,167
(% of AGI for various income ranges: 4.9% for AGIs below $25k, 1.2% for AGIs $25k-50k, 1.3% for AGIs $50k-75k, 2.5% for AGIs $75k-100k, 8.6% for AGIs $100k-200k)
Taxable individual retirement arrangement distribution: $10,652 (reported on 8.3% of returns)
29709:
$10,652
South Carolina:
$17,019
(% of AGI for various income ranges: 3.5% for AGIs below $25k, 1.6% for AGIs $25k-50k, 2.0% for AGIs $50k-75k, 2.4% for AGIs $75k-100k, 3.4% for AGIs $100k-200k)
Total itemized deductions: $18,800 (22% of AGI, reported on 18.6% of returns)
Here:
$18,800
State:
$22,890
Here:
21.9% of AGI
State:
21.4% of AGI
(% of AGI for various income ranges: 4.5% for AGIs below $25k, 6.7% for AGIs $25k-50k, 8.5% for AGIs $50k-75k, 8.9% for AGIs $75k-100k, 12.5% for AGIs $100k-200k, 8.5% for AGIs over 200k)
Charity contributions: $5,166 (reported on 15.0% of returns)
Here:
$5,166
State:
$5,169
(% of AGI for various income ranges: 0.6% for AGIs below $25k, 1.2% for AGIs $25k-50k, 2.0% for AGIs $50k-75k, 2.4% for AGIs $75k-100k, 3.3% for AGIs $100k-200k, 1.5% for AGIs over 200k)
Taxes paid: $5,938 (reported on 18.6% of returns)
29709:
$5,938
State:
$7,644
(% of AGI for various income ranges: 0.7% for AGIs below $25k, 1.2% for AGIs $25k-50k, 2.5% for AGIs $50k-75k, 3.0% for AGIs $75k-100k, 5.2% for AGIs $100k-200k, 3.7% for AGIs over 200k)
Earned income credit: $2,343 (reported on 29.2% of returns)
Here:
$2,343
State:
$2,418
(% of AGI for various income ranges: 9.7% for AGIs below $25k, 1.6% for AGIs $25k-50k)
Percentage of individuals using paid preparers for their 2012 taxes: 74.7%
Here:
75%
State:
57%
(% for various income ranges: 71.2% for AGIs below $25k, 76.7% for AGIs $25k-50k, 71.9% for AGIs $50k-75k, 81.0% for AGIs $75k-100k, 84.6% for AGIs $100k-200k, 100.0% for AGIs over 200k)
Averages for the 2004 tax year for zip code 29709, filed in 2005:
Average Adjusted Gross Income (AGI) in 2004: $32,278 (Individual Income Tax Returns)
Here:
$32,278
State:
$41,965
Salary/wage: $29,987 (reported on 86.7% of returns)
Here:
$29,987
State:
$35,695
(% of AGI for various income ranges: 79.8% for AGIs below $10k, 83.4% for AGIs $10k-25k, 87.2% for AGIs $25k-50k, 81.3% for AGIs $50k-75k, 85.9% for AGIs $75k-100k, 52.5% for AGIs over 100k)
Taxable interest for individuals: $1,419 (reported on 31.8% of returns)
This zip code:
$1,419
South Carolina:
$1,623
(% of AGI for various income ranges: 2.8% for AGIs below $10k, 1.4% for AGIs $10k-25k, 1.0% for AGIs $25k-50k, 1.3% for AGIs $50k-75k, 1.7% for AGIs $75k-100k, 2.0% for AGIs over 100k)
Taxable dividends: $3,441 (reported on 11.8% of returns)
Here:
$3,441
State:
$3,999
(% of AGI for various income ranges: 0.6% for AGIs below $10k, 0.4% for AGIs $10k-25k, 0.6% for AGIs $25k-50k, 0.4% for AGIs $50k-75k, 1.0% for AGIs $75k-100k, 6.1% for AGIs over 100k)
Net capital gain/loss: +$4,498 (reported on 10.0% of returns)
Here:
+$4,498
State:
+$13,100
(% of AGI for various income ranges: -0.7% for AGIs below $10k, 0.6% for AGIs $10k-25k, 0.7% for AGIs $25k-50k, 1.2% for AGIs $50k-75k, 0.9% for AGIs $75k-100k, 5.7% for AGIs over 100k)
Profit/loss from business: +$8,595 (reported on 13.4% of returns)
Here:
+$8,595
State:
+$9,144
(% of AGI for various income ranges: 2.3% for AGIs below $10k, 2.2% for AGIs $10k-25k, 1.5% for AGIs $25k-50k, 1.5% for AGIs $50k-75k, 2.1% for AGIs $75k-100k, 16.7% for AGIs over 100k)
IRA payment deduction: $2,854 (reported on 1.6% of returns)
29709:
$2,854
South Carolina:
$2,972
Total itemized deductions: $14,776 (24% of AGI, reported on 19.9% of returns)
Here:
$14,776
State:
$19,039
Here:
23.5% of AGI
State:
22.8% of AGI
(% of AGI for various income ranges: 6.1% for AGIs below $10k, 4.4% for AGIs $10k-25k, 8.1% for AGIs $25k-50k, 9.3% for AGIs $50k-75k, 12.2% for AGIs $75k-100k, 15.3% for AGIs over 100k)
Charity contributions deductions: $4,363 (7% of AGI, reported on 17.4% of returns)
Here:
$4,363
State:
$4,305
Here:
6.8% of AGI
State:
5.0% of AGI
(% of AGI for various income ranges: 0.9% for AGIs below $10k, 0.7% for AGIs $10k-25k, 1.9% for AGIs $25k-50k, 2.5% for AGIs $50k-75k, 3.3% for AGIs $75k-100k, 4.9% for AGIs over 100k)
Total tax: $3,787 (reported on 68.4% of returns)
29709:
$3,787
State:
$6,497
(% of AGI for various income ranges: 2.4% for AGIs below $10k, 3.2% for AGIs $10k-25k, 5.9% for AGIs $25k-50k, 9.0% for AGIs $50k-75k, 10.6% for AGIs $75k-100k, 16.8% for AGIs over 100k)
Earned income credit: $1,876 (reported on 27.6% of returns)
Here:
$1,876
State:
$1,882
Percentage of individuals using paid preparers for their 2004 taxes: 80.3%
Here:
80%
State:
66%
(% for various income ranges: 78.3% for AGIs below $10k, 83.2% for AGIs $10k-25k, 78.3% for AGIs $25k-50k, 79.8% for AGIs $50k-75k, 76.1% for AGIs $75k-100k, 89.4% for AGIs over 100k)
Likely homosexual households (counted as self-reported same-sex unmarried-partner households)
Lesbian couples: 0.4% of all households
Gay men: 0.0% of all households
Household received Food Stamps/SNAP in the past 12 months: 313 Household did not receive Food Stamps/SNAP in the past 12 months: 2,194
Women who had a birth in the past 12 months: 33 (35 now married, 0 unmarried) Women who did not have a birth in the past 12 months: 1,094 (535 now married, 562 unmarried)
Housing units in zip code 29709 with a mortgage: 769 (31 second mortgage, 13 both second mortgage and home equity loan) Houses without a mortgage: 28
Median monthly owner costs for units with a mortgage: $1,132 Median monthly owner costs for units without a mortgage: $375
Residents with income below the poverty level in 2022:
This zip code:
12.3%
Whole state:
14.0%
Residents with income below 50% of the poverty level in 2022:
This zip code:
5.6%
Whole state:
7.3%
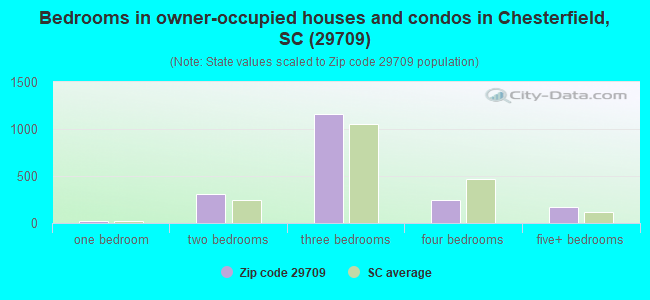
Median number of rooms in houses and condos:
Here:
6.0
State:
6.4
Median number of rooms in apartments:
Here:
5.4
State:
4.5
Notable locations in this zip code not listed on our city pages
Notable locations in zip code 29709: Green River Country Club (A), Chesterfield Fire Department (B), Teals Mill Rural Volunteer Fire Department (C). Display/hide their locations on the map
Churches in zip code 29709 include: Pine Grove Baptist Church (A), Streater Church (B), Peniel Church (C), Oakland Baptist Church (D), Mount Olive Missionary Baptist Church (E), Mount Mary Baptist Church (F), Mount Level Baptist Church (G), Cross Branch Church (H), Douglas Mill Church (I). Display/hide their locations on the map
Cemeteries: Friendship Cemetery (1), Griggs Cemetery (2), Fannie Cemetery (3), Thompsons Creek Cemetery (4), Shiloh Cemetery (5), Pine Grove Cemetery (6), Oakland Cemetery (7). Display/hide their locations on the map
Streams, rivers, and creeks: Crews Branch (A), Deep Creek (B), Big Bear Creek (C), Strickland Branch (D), Smarsh Branch (E), Mount Prong Creek (F), Rocky Prong (G), Polecat Branch (H), Jimmies Creek (I). Display/hide their locations on the map
In group quarters: 139 (-1 institutionalized population)
Size of family households: 812 2-persons, 313 3-persons, 375 4-persons, 74 5-persons, 54 6-persons, 18 7-or-more-persons
Size of nonfamily households: 813 1-person, 38 2-persons, 4 4-persons
719 married couples with children.
396 single-parent households (156 men, 240 women).
96.7% of residents of 29709 zip code speak English at home.
3.0% of residents speak Spanish at home (74% very well, 26% well).
0.1% of residents speak other Indo-European language at home (100% very well).
0.2% of residents speak Asian or Pacific Island language at home (100% very well).
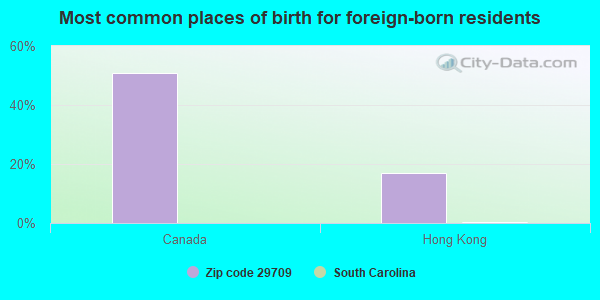
Foreign born population: 58 (1.0%) (100.0% of them are naturalized citizens)
This zip code:
1.0%
Whole state:
5.2%
51%Canada
17%Hong Kong
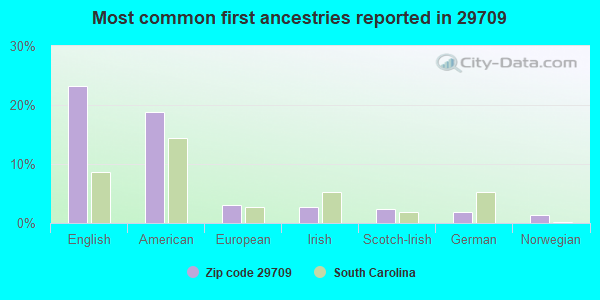
23%English
19%American
3%European
3%Irish
2%Scotch-Irish
2%German
1%Norwegian
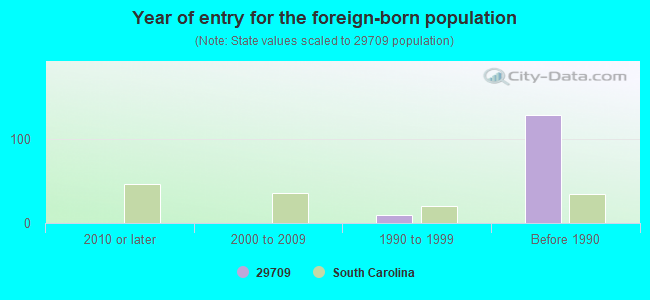
Year of entry for the foreign-born population
02010 or later
02000 to 2009
91990 to 1999
129Before 1990
Facilities with environmental interests located in this zip code:
CHESTERFIELD SCHOOL BUS SHOP (HIGHWAY 9 AND 265 in CHESTERFIELD, SC)
(Resource Conservation and Recovery Act (tracking hazardous waste)) STATE MASTER (South Carolina database) - HAZARDOUS WASTE PROGRAM Organizations: OPERNAME (CONTACT/OPERATOR)
, SC DEPT OF EDUCATION (CONTACT/OWNER)
Alternative names: CHESTERFIELD SCHOOL BUS SHOP DEACTIVATED
CHESTERFIELD COUNTY CLAY PIT (200 WEST MAIN STREET in CHESTERFIELD, SC)
National Pollutant Discharge Elimination System NON-MAJOR (Tracking pollutant discharge elimination systems) - permit STATE MASTER (South Carolina database) - National Pollutant Discharge Elimination System Permit Business SIC classification: KAOLIN AND BALL CLAY Organizations: CHESTERFIELD CTY/CTY CLAY PIT (CONTACT/OWNER)
Alternative names: CHESTERFIELD CTY/CTY CLAY PIT
ARC TECHNOLOGY (600 WINDMILL ROAD in CHESTERFIELD, SC)
AIR MINOR (AIRS/AFS) STATE MASTER (South Carolina database) - AIR PROGRAM, REFUSE DISPOSAL Business SIC classification: SERVICES
CHESTERFIELD COUNTY MINE (N/A in CHESTERFIELD, SC)
AIR MINOR (AIRS/AFS) STATE MASTER (South Carolina database) - AIR PROGRAM Business SIC classification: SERVICES
CHESTERFIELD COUNTY SCHOOL DISTRICT (401 WEST BOULEVARD in CHESTERFIELD, SC)
COMPLIANCE ACTIVITY (Tracking inspections of insecticide, fungicide, and rodenticide, and toxic substances) STATE MASTER (South Carolina database) - DRINKING WATER PROGRAM Business SIC classification: GENERAL CONTRACTORS-NONRESIDENTIAL BUILDINGS, OTHER THAN INDUSTRIAL BUILDINGS AND WAREHOUSES
CHESTERFIELD HIGH SCHOOL (ROUTE 1 BOX 2 in CHESTERFIELD, SC)
(Geographic Names Information System) (National Center for Education Statistics) - STATE ID-1301002 Organizations: CHESTERFIELD COUNTY SCHOOL DISTRICT (SCHOOL DISTRICT)
CHESTERFIELD MIDDLE SCHOOL (344 EAST BOULEVARD in CHESTERFIELD, SC)
(Geographic Names Information System) (National Center for Education Statistics) - STATE ID-1301013 Organizations: CHESTERFIELD COUNTY SCHOOL DISTRICT (SCHOOL DISTRICT)
FLOYDS OF SOUTH CAROLINA INCORPORATED (200 COMMERCE DR in CHESTERFIELD, SC)
TRANSPORTER (Resource Conservation and Recovery Act (tracking hazardous waste)) STATE MASTER (South Carolina database) - TRANSPORTER, HAZARDOUS WASTE PROGRAM Organizations: FLOYD EDICK (CONTACT/OWNER)
EDWARDS ELEMENTARY SCHOOL (ROUTE 3 BOX 7 in CHESTERFIELD, SC)
(National Center for Education Statistics) - STATE ID-1301014 Organizations: CHESTERFIELD COUNTY SCHOOL DISTRICT (SCHOOL DISTRICT)
CHESTERFIELD THOMPSON CREEK (TOWN OF CHESTERFIELD PO BOX 350 in CHESTERFIELD, SC)
CRITERIA AND HAZARDOUS AIR POLLUTANT INVENTORY (Inventory of air pollution sources) National Pollutant Discharge Elimination System NON-MAJOR (Tracking pollutant discharge elimination systems) - permit Business SIC classification: SEWERAGE SYSTEMS Organizations: CHESTERFIELD/THOMPSON CREEK (CONTACT/OWNER)
Housing units lacking complete plumbing facilities: 6.7% Housing units lacking complete kitchen facilities: 6.3%
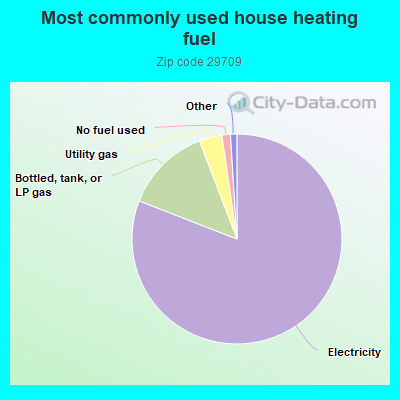
81.0%Electricity
13.3%Bottled, tank, or LP gas
3.5%Utility gas
1.3%No fuel used
0.5%Wood
0.5%Fuel oil, kerosene, etc.
Population in 1990: 6,286.
Place of birth for U.S.-born residents:
This state: 3,749
Northeast: 69
Midwest: 32
South: 1,776
West: 116
65% of the 29709 zip code residents lived in the same house 5 years ago. Out of people who lived in different houses, 72% lived in this county. Out of people who lived in different counties, 50% lived in South Carolina.
91% of the 29709 zip code residents lived in the same house 1 year ago. Out of people who lived in different houses, 71% moved from this county. Out of people who lived in different houses, 6% moved from different county within same state. Out of people who lived in different houses, 13% moved from different state.
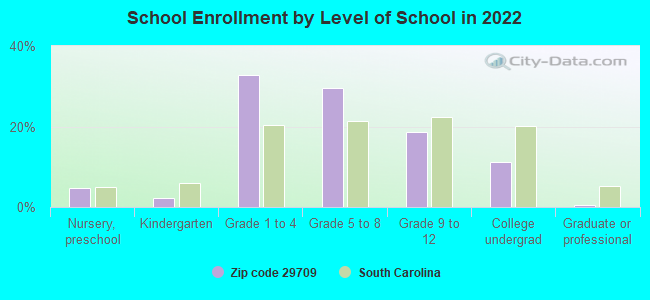
Private vs. public school enrollment:
Students in private schools in grades 1 to 8 (elementary and middle school): 86
Here:
9.3%
South Carolina:
14.4%
Students in private schools in grades 9 to 12 (high school):
Here:
0.0%
South Carolina:
11.1%
Students in private undergraduate colleges: 61
Here:
37.0%
South Carolina:
21.9%
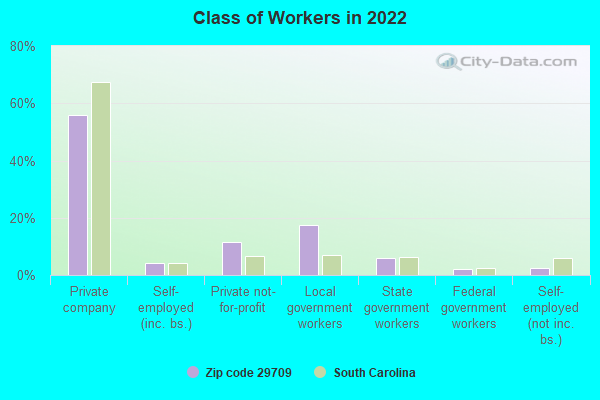
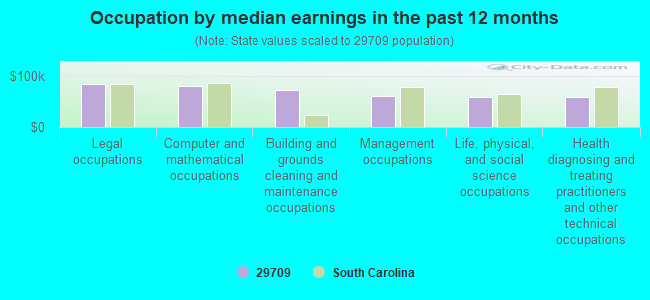
Occupation by median earnings in the past 12 months ($)
83,320Legal occupations
79,477Computer and mathematical occupations
72,714Building and grounds cleaning and maintenance occupations
60,632Management occupations
58,329Life, physical, and social science occupations
57,787Health diagnosing and treating practitioners and other technical occupations
Top industries in this zip code by the number of employees in 2005:
Health Care and Social Assistance: Residential Mental Retardation Facilities (250-499 employees: 1 establishment)
Health Care and Social Assistance: Other Individual and Family Services (20-49: 1, 1-4: 2)
Construction: Poured Concrete Foundation and Structure Contractors (20-49: 1, 1-4: 1)
Health Care and Social Assistance: Home Health Care Services (20-49: 1)
People in group quarters in 2010:
113 people in local jails and other municipal confinement facilities
33 people in group homes intended for adults
4 people in residential treatment centers for adults
2 people in workers' group living quarters and job corps centers
People in group quarters in 2000:
56 people in local jails and other confinement facilities (including police lockups)
13 people in homes for the mentally retarded
Fatal accident statistics in 2013:
Fatal accident count: 1
Vehicles involved in fatal accidents: 2
Fatal accidents caused by drunken drivers: 1
Fatalities: 1
Persons involved in fatal accidents: 5
Pedestrians involved in fatal accidents: 0
Fatal accident statistics in 2012:
Fatal accident count: 2
Vehicles involved in fatal accidents: 3
Fatal accidents caused by drunken drivers: 0
Fatalities: 2
Persons involved in fatal accidents: 6
Pedestrians involved in fatal accidents: 1
2003 - 2018 National Fire Incident Reporting System (NFIRS) incidents
According to the data from the years 2003 - 2018 the average number of fire incidents per year is 12. The highest number of reported fire incidents - 31 took place in 2017, and the least - 3 in 2003. The data has an increasing trend.
When looking into fire subcategories, the most incidents belonged to: Outside Fires (59.6%), and Structure Fires (33.0%).
Fire incident types reported to NFIRS in Zip Code 29709

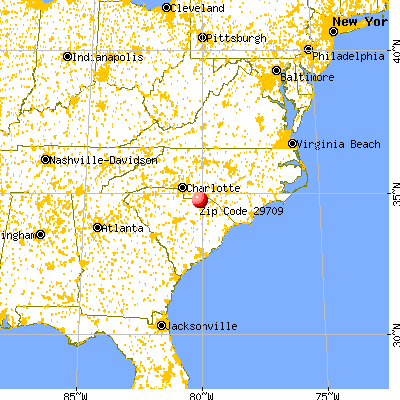


 Nearest zip codes: 29741, 29584, 28119, 28102, 29727, 29520.


 According to the data from the years 2003 - 2018 the average number of fire incidents per year is 12. The highest number of reported fire incidents - 31 took place in 2017, and the least - 3 in 2003. The data has an increasing trend.
 When looking into fire subcategories, the most incidents belonged to: Outside Fires (59.6%), and Structure Fires (33.0%).