Estimated zip code population in 2022: 3,750 Zip code population in 2010: 4,990 Zip code population in 2000: 5,530
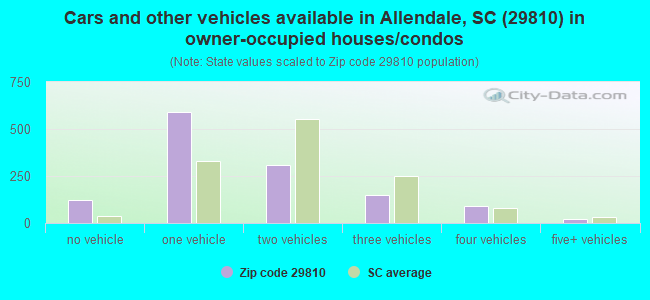
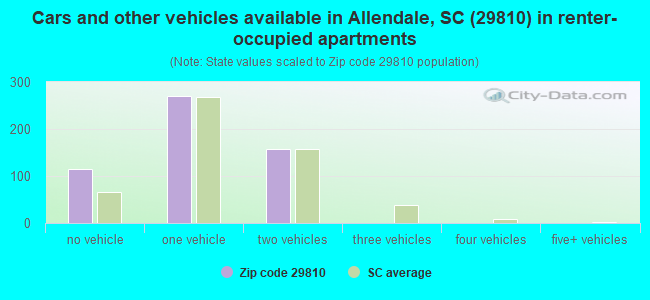
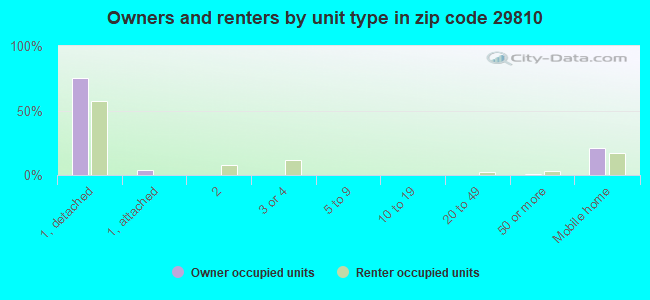
Houses and condos: 2,310 Renter-occupied apartments: 540
% of renters here:
29%
State:
28%
March 2022 cost of living index in zip code 29810: 77.7 (low, U.S. average is 100)
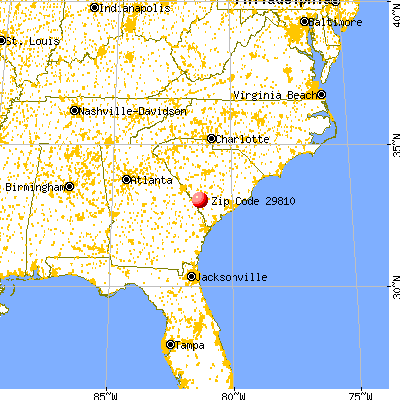
Land area: 121.8 sq. mi. Water area: 1.4 sq. mi.
Population density: 31 people per square mile
(very low).
OSM Map
General Map
Google Map
MSN Map
OSM Map
General Map
Google Map
MSN Map
OSM Map
General Map
Google Map
MSN Map
OSM Map
General Map
Google Map
MSN Map
Please wait while loading the map...
Real estate property taxes paid for housing units in 2022:
This zip code:
0.8% ($585)
South Carolina:
0.5% ($1,185)
Median real estate property taxes paid for housing units with mortgages in 2022: $577 (0.7%) Median real estate property taxes paid for housing units with no mortgage in 2022: $600 (1.2%)
Business Search- 14 Million verified businesses
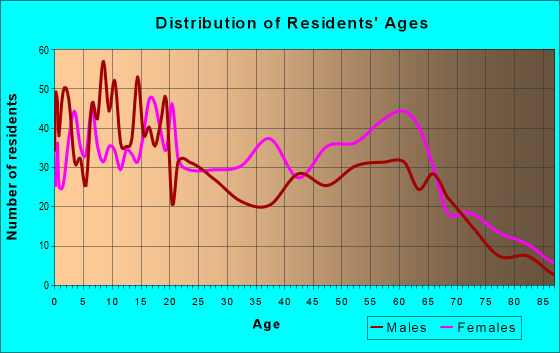
Males: 1,853
(49.4%)
Females: 1,896
(50.6%)
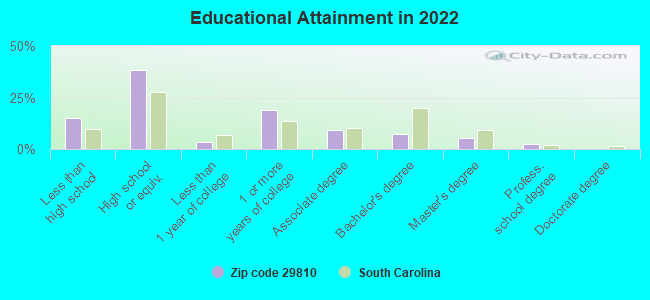
For population 25 years and over in 29810:
High school or higher: 82.9%
Bachelor's degree or higher: 14.9%
Graduate or professional degree: 7.6%
Unemployed: 13.2%
Mean travel time to work (commute): 31.5 minutes
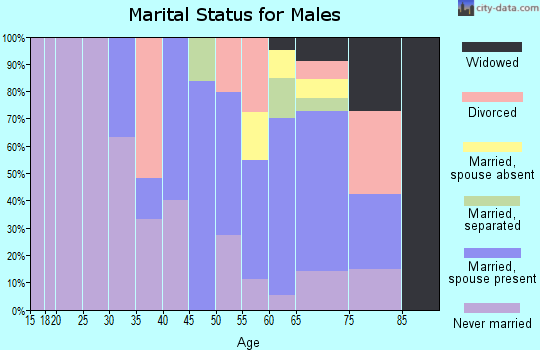
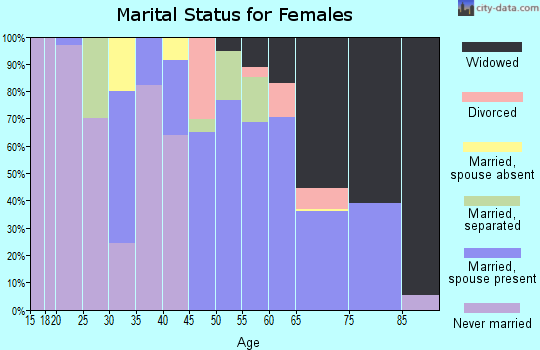
For population 15 years and over in 29810:
Never married: 34.1%
Now married: 32.6%
Separated: 7.9%
Widowed: 12.4%
Divorced: 13.0%
Zip code 29810 compared to state average:
Median household income significantly below state average.
Median house value significantly below state average.
Unemployed percentage significantly above state average.
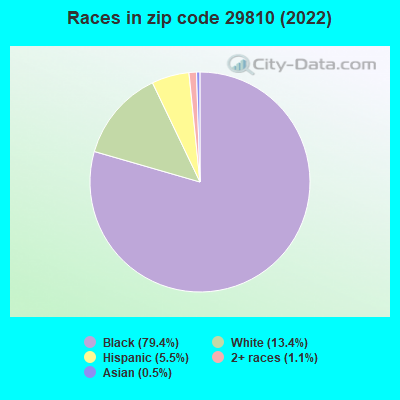
Black race population percentage significantly above state average.
Median age above state average.
Foreign-born population percentage significantly below state average.
Length of stay since moving in significantly above state average.
Number of college students below state average.
Percentage of population with a bachelor's degree or higher below state average.
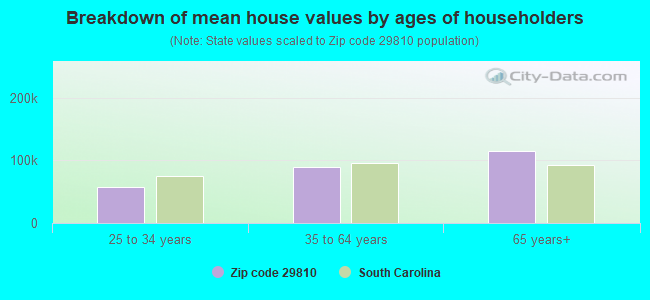
Estimated median house/condo value in 2022: $72,423
29810:
$72,423
South Carolina:
$254,600
According to our research of South Carolina and other state lists, there were 2 registered sex offenders living in 29810 zip code as of April 27, 2024. The ratio of all residents to sex offenders in zip code 29810 is 2,393 to 1. The ratio of registered sex offenders to all residents in this zip code is lower than the state average.
Median resident age:
This zip code:
47.1 years
South Carolina median age:
40.5 years
Average household size:
This zip code:
2.0 people
South Carolina:
2.4 people
Averages for the 2020 tax year for zip code 29810, filed in 2021:
Average Adjusted Gross Income (AGI) in 2020: $35,258 (Individual Income Tax Returns)
Here:
$35,258
State:
$65,754
Salary/wage: $26,555 (reported on 84.9% of returns)
Here:
$26,555
State:
$52,566
(% of AGI for various income ranges: 1365.5% for AGIs below $25k, 4089.7% for AGIs $25k-50k, 7375.6% for AGIs $50k-75k, 10616.7% for AGIs $75k-100k, 32470.0% for AGIs $100k-200k)
Taxable interest for individuals: $857 (reported on 11.4% of returns)
This zip code:
$857
South Carolina:
$1,749
(% of AGI for various income ranges: 2.8% for AGIs below $25k, 2.8% for AGIs $25k-50k, 14.4% for AGIs $50k-75k, 675.0% for AGIs $100k-200k)
Ordinary dividends: $4,283 (reported on 3.2% of returns)
Here:
$4,283
State:
$8,783
(% of AGI for various income ranges: 20.8% for AGIs $25k-50k, 910.0% for AGIs $100k-200k)
Net capital gain/loss in AGI: +$15,980 (reported on 2.7% of returns)
Here:
+$15,980
State:
+$24,194
(% of AGI for various income ranges: 10.3% for AGIs $25k-50k, 3810.0% for AGIs $100k-200k)
Profit/loss from business: +$4,397 (reported on 15.7% of returns)
Here:
+$4,397
State:
+$11,253
(% of AGI for various income ranges: 94.7% for AGIs below $25k, 67.8% for AGIs $50k-75k, 1616.7% for AGIs $75k-100k)
Taxable individual retirement arrangement distribution: $11,700 (reported on 3.8% of returns)
29810:
$11,700
South Carolina:
$21,604
(% of AGI for various income ranges: 16.3% for AGIs below $25k, 107.2% for AGIs $25k-50k, 1020.0% for AGIs $75k-100k)
Total itemized deductions: $28,450 (reported on 2.2% of returns)
Here:
$28,450
State:
$35,199
(% of AGI for various income ranges: 1264.4% for AGIs $50k-75k)
Charity contributions: $11,733 (reported on 1.6% of returns)
Here:
$11,733
State:
$14,319
(% of AGI for various income ranges: 391.1% for AGIs $50k-75k)
Taxes paid: $6,200 (reported on 2.2% of returns)
29810:
$6,200
State:
$7,486
(% of AGI for various income ranges: 275.6% for AGIs $50k-75k)
Earned income credit: $2,752 (reported on 39.5% of returns)
Here:
$2,752
State:
$2,397
(% of AGI for various income ranges: 192.2% for AGIs below $25k, 141.7% for AGIs $25k-50k)
Percentage of individuals using paid preparers for their 2020 taxes: 91.9%
Here:
92%
State:
93%
(% for various income ranges: 92.5% for AGIs below $25k, 90.2% for AGIs $25k-50k, 93.3% for AGIs $50k-75k, 83.3% for AGIs $75k-100k, 100.0% for AGIs $100k-200k)
Averages for the 2012 tax year for zip code 29810, filed in 2013:
Average Adjusted Gross Income (AGI) in 2012: $33,316 (Individual Income Tax Returns)
Here:
$33,316
State:
$51,133
Salary/wage: $24,880 (reported on 87.4% of returns)
Here:
$24,880
State:
$42,173
(% of AGI for various income ranges: 77.0% for AGIs below $25k, 85.5% for AGIs $25k-50k, 75.9% for AGIs $50k-75k, 72.2% for AGIs $75k-100k, 32.2% for AGIs $100k-200k)
Taxable interest for individuals: $1,105 (reported on 11.5% of returns)
This zip code:
$1,105
South Carolina:
$1,468
(% of AGI for various income ranges: 0.2% for AGIs below $25k, 0.2% for AGIs $25k-50k, 0.7% for AGIs $50k-75k, 0.6% for AGIs $100k-200k)
Ordinary dividends: $9,029 (reported on 4.0% of returns)
Here:
$9,029
State:
$6,511
(% of AGI for various income ranges: 0.3% for AGIs below $25k, 0.5% for AGIs $50k-75k, 3.2% for AGIs $100k-200k)
Net capital gain/loss in AGI: +$16,025 (reported on 2.3% of returns)
Here:
+$16,025
State:
+$13,061
Profit/loss from business: +$6,038 (reported on 16.7% of returns)
Here:
+$6,038
State:
+$10,167
(% of AGI for various income ranges: 10.2% for AGIs below $25k, 1.2% for AGIs $25k-50k, 1.8% for AGIs $50k-75k)
Taxable individual retirement arrangement distribution: $14,917 (reported on 3.4% of returns)
29810:
$14,917
South Carolina:
$17,019
Total itemized deductions: $22,725 (19% of AGI, reported on 11.5% of returns)
Here:
$22,725
State:
$22,890
Here:
19.4% of AGI
State:
21.4% of AGI
(% of AGI for various income ranges: 2.0% for AGIs below $25k, 6.4% for AGIs $25k-50k, 9.6% for AGIs $50k-75k, 14.1% for AGIs $75k-100k, 11.5% for AGIs $100k-200k)
Charity contributions: $5,961 (reported on 10.3% of returns)
Here:
$5,961
State:
$5,169
(% of AGI for various income ranges: 1.6% for AGIs $25k-50k, 2.0% for AGIs $50k-75k, 4.3% for AGIs $75k-100k, 2.9% for AGIs $100k-200k)
Taxes paid: $6,350 (reported on 11.5% of returns)
29810:
$6,350
State:
$7,644
(% of AGI for various income ranges: 0.4% for AGIs below $25k, 1.0% for AGIs $25k-50k, 3.0% for AGIs $50k-75k, 4.0% for AGIs $75k-100k, 3.9% for AGIs $100k-200k)
Earned income credit: $2,786 (reported on 51.7% of returns)
Here:
$2,786
State:
$2,418
(% of AGI for various income ranges: 15.4% for AGIs below $25k, 2.3% for AGIs $25k-50k)
Percentage of individuals using paid preparers for their 2012 taxes: 70.7%
Here:
71%
State:
57%
(% for various income ranges: 68.5% for AGIs below $25k, 69.8% for AGIs $25k-50k, 83.3% for AGIs $50k-75k, 80.0% for AGIs $75k-100k, 83.3% for AGIs $100k-200k)
Averages for the 2004 tax year for zip code 29810, filed in 2005:
Average Adjusted Gross Income (AGI) in 2004: $24,747 (Individual Income Tax Returns)
Here:
$24,747
State:
$41,965
Salary/wage: $22,299 (reported on 89.7% of returns)
Here:
$22,299
State:
$35,695
(% of AGI for various income ranges: 103.2% for AGIs below $10k, 89.5% for AGIs $10k-25k, 86.7% for AGIs $25k-50k, 78.4% for AGIs $50k-75k, 77.1% for AGIs $75k-100k, 54.4% for AGIs over 100k)
Taxable interest for individuals: $1,948 (reported on 16.8% of returns)
This zip code:
$1,948
South Carolina:
$1,623
(% of AGI for various income ranges: 2.0% for AGIs below $10k, 0.7% for AGIs $10k-25k, 0.6% for AGIs $25k-50k, 1.9% for AGIs $50k-75k, 2.6% for AGIs $75k-100k, 2.4% for AGIs over 100k)
Taxable dividends: $4,070 (reported on 5.8% of returns)
Here:
$4,070
State:
$3,999
(% of AGI for various income ranges: 0.4% for AGIs below $10k, 0.3% for AGIs $10k-25k, 0.2% for AGIs $25k-50k, 0.8% for AGIs $50k-75k, 0.8% for AGIs $75k-100k, 3.7% for AGIs over 100k)
Net capital gain/loss: +$5,143 (reported on 4.6% of returns)
Here:
+$5,143
State:
+$13,100
(% of AGI for various income ranges: -0.7% for AGIs below $10k, 0.1% for AGIs $10k-25k, 0.2% for AGIs $25k-50k, 1.0% for AGIs $50k-75k, 4.3% for AGIs over 100k)
Profit/loss from business: +$944 (reported on 9.2% of returns)
Here:
+$944
State:
+$9,144
(% of AGI for various income ranges: -3.3% for AGIs below $10k, 1.1% for AGIs $10k-25k, 0.6% for AGIs $25k-50k, 0.8% for AGIs $50k-75k, -1.2% for AGIs $75k-100k)
Total itemized deductions: $17,728 (25% of AGI, reported on 13.0% of returns)
Here:
$17,728
State:
$19,039
Here:
25.3% of AGI
State:
22.8% of AGI
(% of AGI for various income ranges: 3.8% for AGIs $10k-25k, 7.5% for AGIs $25k-50k, 14.7% for AGIs $50k-75k, 16.8% for AGIs $75k-100k, 17.0% for AGIs over 100k)
Charity contributions deductions: $4,377 (6% of AGI, reported on 12.1% of returns)
Here:
$4,377
State:
$4,305
Here:
6.1% of AGI
State:
5.0% of AGI
(% of AGI for various income ranges: 0.7% for AGIs $10k-25k, 1.6% for AGIs $25k-50k, 2.7% for AGIs $50k-75k, 3.4% for AGIs $75k-100k, 5.0% for AGIs over 100k)
Total tax: $3,930 (reported on 45.3% of returns)
29810:
$3,930
State:
$6,497
(% of AGI for various income ranges: 2.2% for AGIs below $10k, 1.8% for AGIs $10k-25k, 5.1% for AGIs $25k-50k, 8.2% for AGIs $50k-75k, 10.6% for AGIs $75k-100k, 18.7% for AGIs over 100k)
Earned income credit: $2,259 (reported on 52.3% of returns)
Here:
$2,259
State:
$1,882
Percentage of individuals using paid preparers for their 2004 taxes: 79.5%
Here:
79%
State:
66%
(% for various income ranges: 82.0% for AGIs below $10k, 81.5% for AGIs $10k-25k, 73.3% for AGIs $25k-50k, 79.8% for AGIs $50k-75k, 68.4% for AGIs $75k-100k, 82.5% for AGIs over 100k)
Household received Food Stamps/SNAP in the past 12 months: 375 Household did not receive Food Stamps/SNAP in the past 12 months: 1,466
Women who had a birth in the past 12 months: 60 (0 now married, 54 unmarried) Women who did not have a birth in the past 12 months: 700 (198 now married, 498 unmarried)
Housing units in zip code 29810 with a mortgage: 494 (37 second mortgage, 14 both second mortgage and home equity loan) Median monthly owner costs for units with a mortgage: $786 Median monthly owner costs for units without a mortgage: $400
Residents with income below the poverty level in 2022:
This zip code:
33.1%
Whole state:
14.0%
Residents with income below 50% of the poverty level in 2022:
This zip code:
22.3%
Whole state:
7.3%
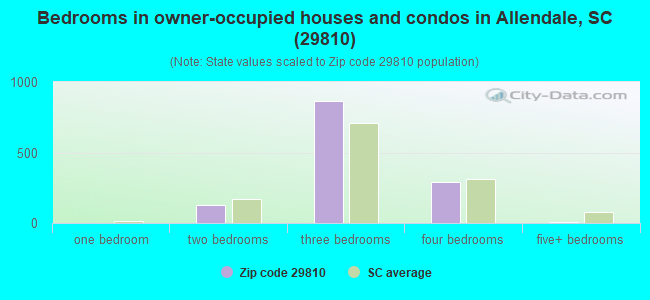
Median number of rooms in houses and condos:
Here:
5.7
State:
6.4
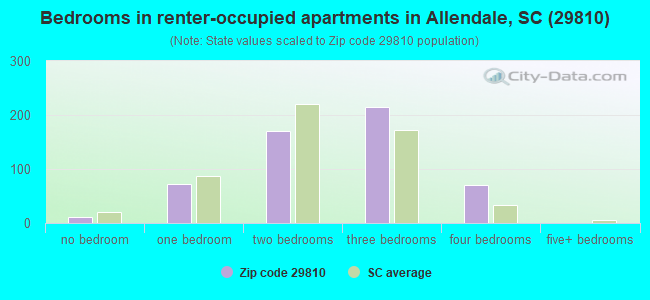
Median number of rooms in apartments:
Here:
5.5
State:
4.5
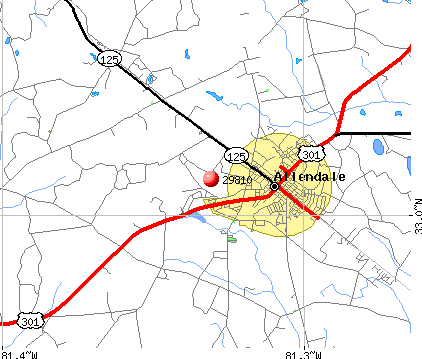
Notable locations in this zip code not listed on our city pages
Notable locations in zip code 29810: Erwinton Plantation (A), Allendale Wastewater Treatment Facility (B), Gill Crossroads (C), Gravel Hill Plantation (D), Willingham Plantation (E), Allendale County Library (F), University of South Carolina Salkehatchie West Library Building (G), Allendale Fire Department (H), Allendale County Emergency Management Office (I), Allendale Police Department (J), Allendale County African-American Cultural Center (K), Allendale War Memorial Building (L), Allendale County Museum (M), Allendale County Courthouse (N). Display/hide their locations on the map
Churches in zip code 29810 include: Saint Marks Church (A), Second Calvary Church (B), Smyrna Church (C), Sweet Bethel Church (D), Virgin Mary Church (E), Beautiful Gate Church (F), Erwinton Church (G), Beulah Church (H), Magdalene Church (I). Display/hide their locations on the map
Cemeteries: Flowers Cemetery (1), Folger Cemetery (2), Allen Chapel Cemetery (3), New Home Cemetery (4), Magdalene Cemetery (5), Brown Cemetery (6), Saint Pauls Cemetery (7). Display/hide their locations on the map
Lakes and swamps: Dead River Lake (A), Mount Lake (B), Ferguson Lake (C), Spring Run (D), Mars Branch (E), Warren Branch (F), Bull Pond (G). Display/hide their locations on the map
Streams, rivers, and creeks: Fiddle Pond Creek (A), Stony Creek (B), Spring Run (C), Log Branch (D), Brier Creek (E), Watchcaw Creek (F), Bentley Branch (G). Display/hide their locations on the map
In group quarters: 64 (-1 institutionalized population)
Size of family households: 425 2-persons, 147 3-persons, 124 4-persons, 23 5-persons, 98 6-persons, 69 7-or-more-persons
Size of nonfamily households: 837 1-person, 90 2-persons, 26 3-persons
145 married couples with children.
464 single-parent households (5 men, 459 women).
99.5% of residents of 29810 zip code speak English at home.
0.5% of residents speak Asian or Pacific Island language at home (100% very well).
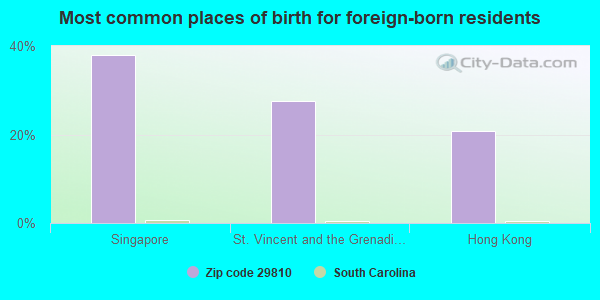
Foreign born population: 29 (0.8%) (45.1% of them are naturalized citizens)
This zip code:
0.8%
Whole state:
5.2%
38%Singapore
28%St. Vincent and the Grenadines
21%Hong Kong
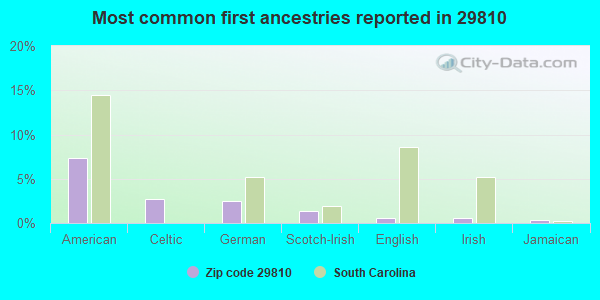
7%American
3%Celtic
2%German
1%Scotch-Irish
1%English
1%Irish
0%Jamaican
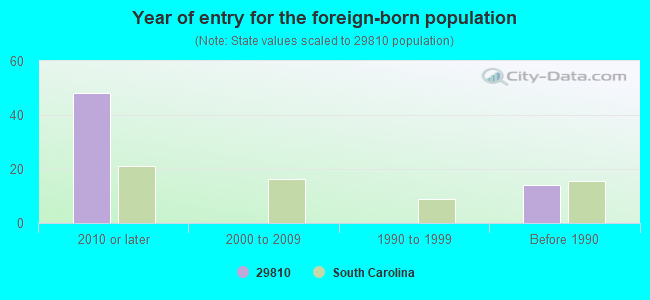
Year of entry for the foreign-born population
482010 or later
02000 to 2009
01990 to 1999
14Before 1990
Facilities with environmental interests located in this zip code:
COLLUMS LUMBER MILL INCORPORATED (1723 BARNWELL ROAD in ALLENDALE, SC)
AIR MAJOR (AIRS/AFS) CRITERIA AND HAZARDOUS AIR POLLUTANT INVENTORY (Inventory of air pollution sources) National Pollutant Discharge Elimination System NON-MAJOR (Tracking pollutant discharge elimination systems) - permit AIR MAJOR ("Best Available" air pollution technologies tracking) Small Quantity Generators, between 100 kg and 1000 kg of hazardous waste/month (Resource Conservation and Recovery Act (tracking hazardous waste)) - notification STATE MASTER (South Carolina database) - AIR MAJOR, UNDERGROUND STORAGE TANK PROGRAM, AIR PROGRAM, UNDERGROUND STORAGE TANK PROGRAM, TRI REPORTER, National Pollutant Discharge Elimination System Permit, HAZARDOUS WASTE PROGRAM, DAM SITE TRI REPORTER (Tracking of toxic chemicals releasing facilities) Business SIC classification: SAWMILLS AND PLANING MILLS, GENERAL; WOOD PRESERVING Business NAICS classification: ALL OTHER MISCELLANEOUS WOOD PRODUCT MANUFACTURING. Organizations: OPERNAME (CONTACT/OPERATOR)
, OWNERNAME (CONTACT/OWNER)
Alternative names: COLLUM'S LUMBER MILL INC., COLLUM'S LUMBER MILL
ALLENDALE GRAIN CO INCORPORATED (500 ESTER ST in ALLENDALE, SC)
AIR MINOR (AIRS/AFS) STATE MASTER (South Carolina database) - AIR MAJOR, AIR PROGRAM Business SIC classification: CROP PREPARATION SERVICES FOR MARKET, EXCEPT COTTON GINNING; VEGETABLE OIL MILLS, EXCEPT CORN, COTTONSEED, AND SOYBEAN; PREPARED FRESH OR FROZEN FISH AND SEAFOODS; GRAIN AND FIELD BEANS Alternative names: ALLENDALE GRAIN-CLOSED
BARKER & BARKER GIN (BLUFF RD in ALLENDALE, SC)
AIR MINOR (AIRS/AFS) STATE MASTER (South Carolina database) - AIR PROGRAM, Business SIC classification: COTTON GINNING; SPECIAL INDUSTRY MACHINERY Organizations: EMERALD INC (CONTACT/ENGINEERING/CONSULTING FIRM)
ALLENDALE WWTF (HIGHWAY 301 SOUTH in ALLENDALE, SC)
CRITERIA AND HAZARDOUS AIR POLLUTANT INVENTORY (Inventory of air pollution sources) National Pollutant Discharge Elimination System MAJOR (Tracking pollutant discharge elimination systems) - permit STATE MASTER (South Carolina database) - National Pollutant Discharge Elimination System Permit Business SIC classification: SEWERAGE SYSTEMS
ALLENDALE ELEMENTARY (HIGHWAY 278 EAST in ALLENDALE, SC)
(National Center for Education Statistics) - STATE ID-0301004 Organizations: ALLENDALE COUNTY SCHOOL DISTRICT (SCHOOL DISTRICT)
CLIMAX GLOBAL ENERGY INC (RTE 278Z @ AIRPORT RD in ALLENDALE, SC)
AIR MINOR (AIRS/AFS) Business SIC classification: SERVICES
ALLENDALE COUNTY SCHOOL DISTRICT (HIGHWAY 278 in ALLENDALE, SC)
COMPLIANCE ACTIVITY (Tracking inspections of insecticide, fungicide, and rodenticide, and toxic substances)
APPLETON LANDFILL / WASTEMASTER (HWY. 125 in APPLETON, SC)
SUPERFUND (Superfund database)
Housing units lacking complete plumbing facilities: 11.6% Housing units lacking complete kitchen facilities: 9.7%
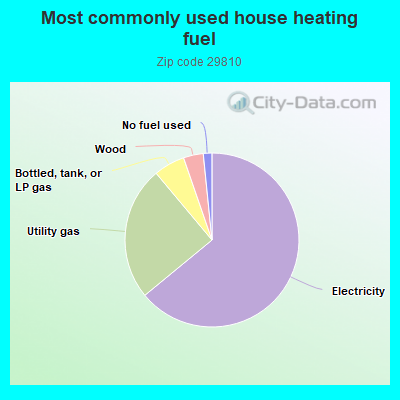
64.1%Electricity
24.9%Utility gas
5.8%Bottled, tank, or LP gas
3.7%Wood
1.6%No fuel used
Population in 1990: 5,704.
Place of birth for U.S.-born residents:
This state: 2,897
Northeast: 110
Midwest: 185
South: 438
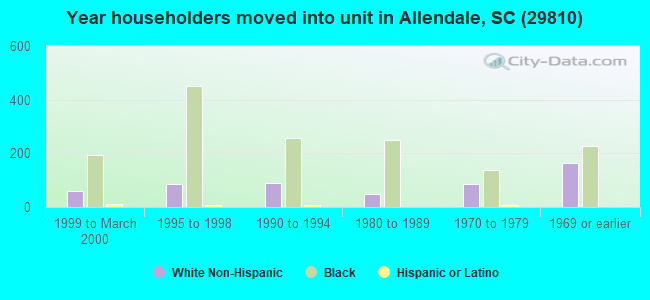
72% of the 29810 zip code residents lived in the same house 5 years ago. Out of people who lived in different houses, 72% lived in this county. Out of people who lived in different counties, 50% lived in South Carolina.
92% of the 29810 zip code residents lived in the same house 1 year ago. Out of people who lived in different houses, 34% moved from this county. Out of people who lived in different houses, 59% moved from different county within same state. Out of people who lived in different houses, 4% moved from abroad.
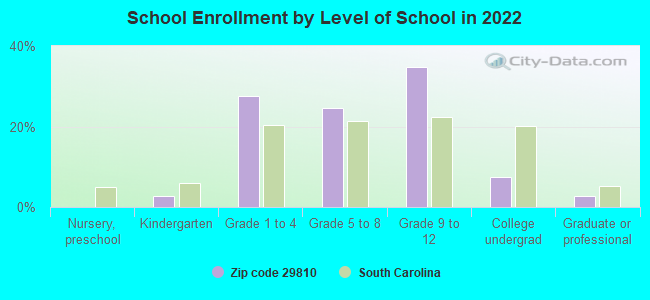
Private vs. public school enrollment:
Students in private schools in grades 1 to 8 (elementary and middle school): 46
Here:
10.2%
South Carolina:
14.4%
Students in private schools in grades 9 to 12 (high school): 29
Here:
9.3%
South Carolina:
11.1%
Students in private undergraduate colleges: 23
Here:
36.3%
South Carolina:
21.9%
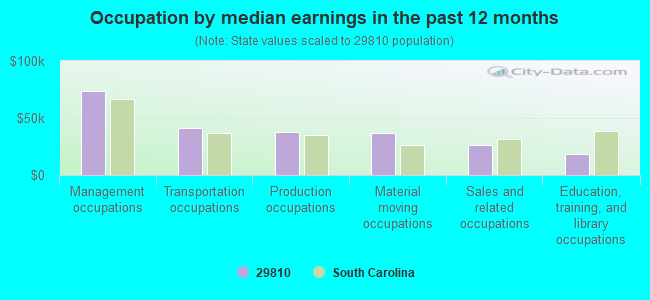
Occupation by median earnings in the past 12 months ($)
73,461Management occupations
41,210Transportation occupations
37,607Production occupations
36,643Material moving occupations
26,360Sales and related occupations
18,763Education, training, and library occupations
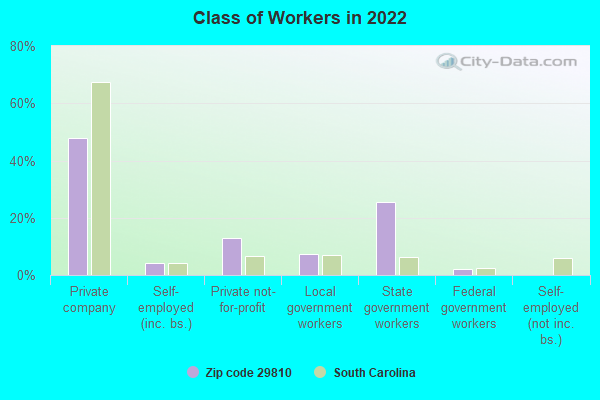
Top industries in this zip code by the number of employees in 2005:
Professional, Scientific, and Technical Services: Offices of Lawyers (10-19: 1, 5-9: 1, 1-4: 2)
Finance and Insurance: Commercial Banking (5-9: 2, 1-4: 1)
People in group quarters in 2010:
22 people in emergency and transitional shelters (with sleeping facilities) for people experiencing homelessness
17 people in group homes intended for adults
People in group quarters in 2000:
19 people in local jails and other confinement facilities (including police lockups)
15 people in nursing homes
10 people in other noninstitutional group quarters
Fatal accident statistics in 2014:
Fatal accident count: 1
Vehicles involved in fatal accidents: 1
Fatal accidents caused by drunken drivers: 0
Fatalities: 1
Persons involved in fatal accidents: 1
Pedestrians involved in fatal accidents: 1
Fatal accident statistics in 2013:
Fatal accident count: 1
Vehicles involved in fatal accidents: 1
Fatal accidents caused by drunken drivers: 1
Fatalities: 1
Persons involved in fatal accidents: 4
Pedestrians involved in fatal accidents: 0
2004 - 2018 National Fire Incident Reporting System (NFIRS) incidents
According to the data from the years 2004 - 2018 the average number of fire incidents per year is 57. The highest number of reported fire incidents - 95 took place in 2007, and the least - 1 in 2005. The data has a growing trend.
When looking into fire subcategories, the most incidents belonged to: Structure Fires (47.4%), and Outside Fires (38.3%).
Fire incident types reported to NFIRS in Zip Code 29810


 Nearest zip codes: 29827, 29932, 29923, 29849, 29836, 29911.
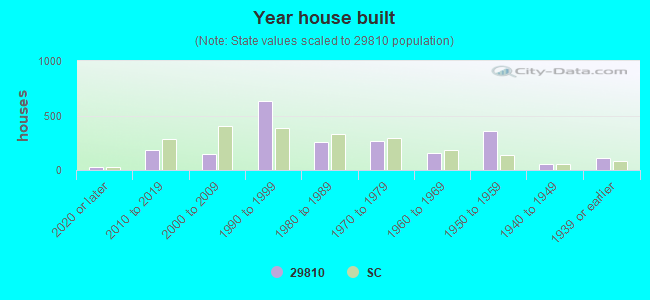


 According to the data from the years 2004 - 2018 the average number of fire incidents per year is 57. The highest number of reported fire incidents - 95 took place in 2007, and the least - 1 in 2005. The data has a growing trend.
 When looking into fire subcategories, the most incidents belonged to: Structure Fires (47.4%), and Outside Fires (38.3%).