Estimated zip code population in 2022: 42,372 Zip code population in 2010: 37,233 Zip code population in 2000: 23,693
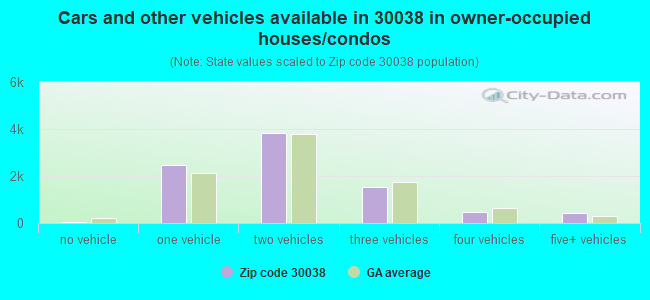
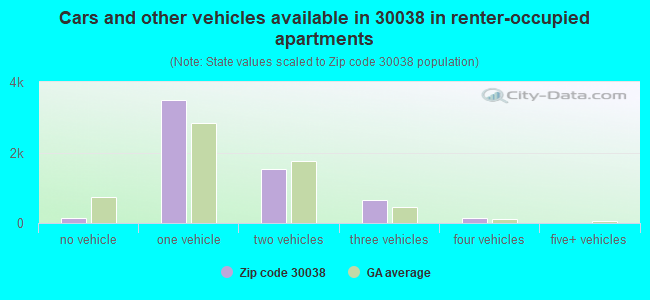
Houses and condos: 17,296 Renter-occupied apartments: 5,932
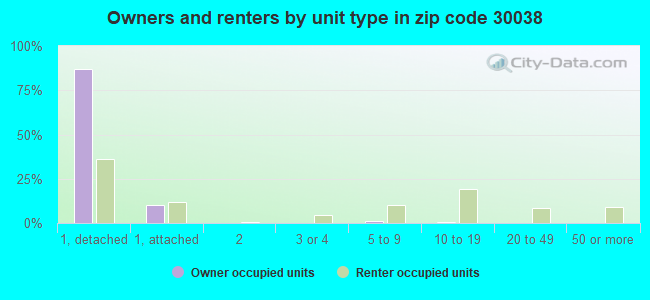
% of renters here:
40%
State:
34%
March 2022 cost of living index in zip code 30038: 101.0 (near average, U.S. average is 100)
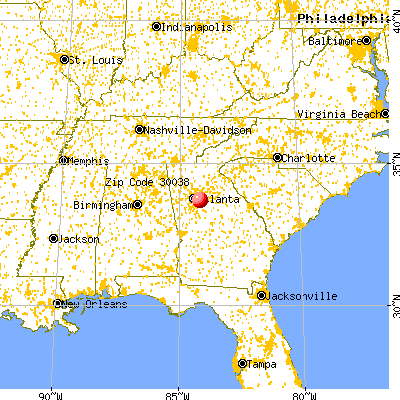
Land area: 29.1 sq. mi. Water area: 0.4 sq. mi.
Population density: 1,458 people per square mile
(low).
OSM Map
General Map
Google Map
MSN Map
OSM Map
General Map
Google Map
MSN Map
OSM Map
General Map
Google Map
MSN Map
OSM Map
General Map
Google Map
MSN Map
Please wait while loading the map...
Real estate property taxes paid for housing units in 2022:
This zip code:
0.8% ($1,983)
Georgia:
0.7% ($2,160)
Median real estate property taxes paid for housing units with mortgages in 2022: $2,064 (0.8%) Median real estate property taxes paid for housing units with no mortgage in 2022: $1,205 (0.7%)
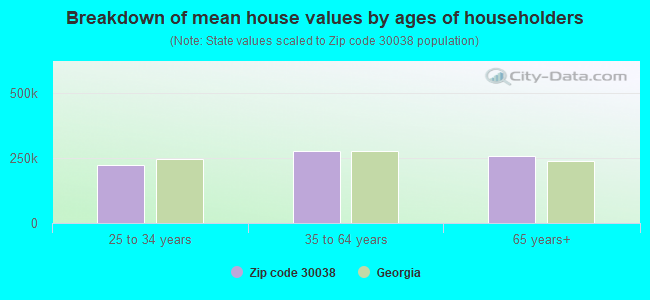
Estimated median house/condo value in 2022: $246,362
30038:
$246,362
Georgia:
$297,400
According to our research of Georgia and other state lists, there were 90 registered sex offenders living in 30038 zip code as of April 26, 2024. The ratio of all residents to sex offenders in zip code 30038 is 478 to 1. The ratio of registered sex offenders to all residents in this zip code is near the state average.
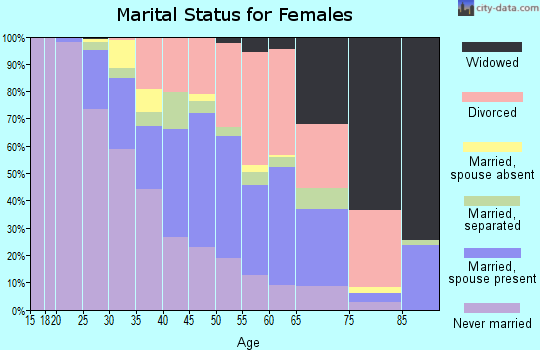
Median resident age:
This zip code:
37.8 years
Georgia median age:
37.6 years
Average household size:
This zip code:
2.9 people
Georgia:
2.6 people
Averages for the 2020 tax year for zip code 30038, filed in 2021:
Average Adjusted Gross Income (AGI) in 2020: $43,166 (Individual Income Tax Returns)
Here:
$43,166
State:
$70,847
Salary/wage: $41,173 (reported on 85.0% of returns)
Here:
$41,173
State:
$59,126
(% of AGI for various income ranges: 1232.2% for AGIs below $25k, 4038.3% for AGIs $25k-50k, 7769.2% for AGIs $50k-75k, 11246.6% for AGIs $75k-100k, 20960.3% for AGIs $100k-200k, 100806.0% for AGIs over 200k)
Taxable interest for individuals: $485 (reported on 11.0% of returns)
This zip code:
$485
Georgia:
$2,011
(% of AGI for various income ranges: 2.7% for AGIs below $25k, 3.1% for AGIs $25k-50k, 8.8% for AGIs $50k-75k, 12.3% for AGIs $75k-100k, 52.5% for AGIs $100k-200k, 264.0% for AGIs over 200k)
Ordinary dividends: $2,416 (reported on 5.6% of returns)
Here:
$2,416
State:
$8,996
(% of AGI for various income ranges: 1.5% for AGIs below $25k, 3.1% for AGIs $25k-50k, 9.2% for AGIs $50k-75k, 39.4% for AGIs $75k-100k, 90.0% for AGIs $100k-200k, 2850.0% for AGIs over 200k)
Net capital gain/loss in AGI: +$9,757 (reported on 4.9% of returns)
Here:
+$9,757
State:
+$28,402
(% of AGI for various income ranges: 0.8% for AGIs below $25k, 3.3% for AGIs $25k-50k, 24.4% for AGIs $50k-75k, 39.9% for AGIs $75k-100k, 229.9% for AGIs $100k-200k, 15034.0% for AGIs over 200k)
Taxable individual retirement arrangement distribution: $14,618 (reported on 3.7% of returns)
30038:
$14,618
Georgia:
$20,525
(% of AGI for various income ranges: 12.0% for AGIs below $25k, 26.4% for AGIs $25k-50k, 105.0% for AGIs $50k-75k, 250.2% for AGIs $75k-100k, 517.0% for AGIs $100k-200k, 2650.0% for AGIs over 200k)
Total itemized deductions: $26,218 (reported on 12.7% of returns)
Here:
$26,218
State:
$34,001
(% of AGI for various income ranges: 44.8% for AGIs below $25k, 222.9% for AGIs $25k-50k, 800.2% for AGIs $50k-75k, 1509.2% for AGIs $75k-100k, 2850.3% for AGIs $100k-200k, 15322.0% for AGIs over 200k)
Charity contributions: $9,898 (reported on 11.5% of returns)
Here:
$9,898
State:
$14,164
(% of AGI for various income ranges: 7.9% for AGIs below $25k, 60.0% for AGIs $25k-50k, 256.6% for AGIs $50k-75k, 508.3% for AGIs $75k-100k, 1099.1% for AGIs $100k-200k, 6678.0% for AGIs over 200k)
Taxes paid: $6,296 (reported on 12.6% of returns)
30038:
$6,296
State:
$7,540
(% of AGI for various income ranges: 7.2% for AGIs below $25k, 44.1% for AGIs $25k-50k, 185.2% for AGIs $50k-75k, 405.8% for AGIs $75k-100k, 778.4% for AGIs $100k-200k, 3036.0% for AGIs over 200k)
Earned income credit: $2,592 (reported on 30.7% of returns)
Here:
$2,592
State:
$2,530
(% of AGI for various income ranges: 159.7% for AGIs below $25k, 103.0% for AGIs $25k-50k, 0.5% for AGIs $50k-75k)
Percentage of individuals using paid preparers for their 2020 taxes: 91.4%
Here:
91%
State:
93%
(% for various income ranges: 92.7% for AGIs below $25k, 91.8% for AGIs $25k-50k, 89.9% for AGIs $50k-75k, 88.3% for AGIs $75k-100k, 88.2% for AGIs $100k-200k, 86.4% for AGIs over 200k)
Averages for the 2012 tax year for zip code 30038, filed in 2013:
Average Adjusted Gross Income (AGI) in 2012: $38,334 (Individual Income Tax Returns)
Here:
$38,334
State:
$56,131
Salary/wage: $37,351 (reported on 87.6% of returns)
Here:
$37,351
State:
$47,942
(% of AGI for various income ranges: 85.9% for AGIs below $25k, 92.5% for AGIs $25k-50k, 86.2% for AGIs $50k-75k, 81.4% for AGIs $75k-100k, 80.4% for AGIs $100k-200k, 73.9% for AGIs over 200k)
Taxable interest for individuals: $634 (reported on 12.6% of returns)
This zip code:
$634
Georgia:
$1,706
(% of AGI for various income ranges: 0.3% for AGIs below $25k, 0.2% for AGIs $25k-50k, 0.2% for AGIs $50k-75k, 0.1% for AGIs $75k-100k, 0.2% for AGIs $100k-200k, 0.2% for AGIs over 200k)
Ordinary dividends: $2,042 (reported on 6.1% of returns)
Here:
$2,042
State:
$7,265
(% of AGI for various income ranges: 0.3% for AGIs below $25k, 0.2% for AGIs $25k-50k, 0.2% for AGIs $50k-75k, 0.3% for AGIs $75k-100k, 0.5% for AGIs $100k-200k, 0.9% for AGIs over 200k)
Net capital gain/loss in AGI: +$1,154 (reported on 3.8% of returns)
Here:
+$1,154
State:
+$16,323
(% of AGI for various income ranges: 0.2% for AGIs $75k-100k, 0.3% for AGIs $100k-200k, 0.6% for AGIs over 200k)
Taxable individual retirement arrangement distribution: $13,103 (reported on 4.5% of returns)
30038:
$13,103
Georgia:
$17,199
(% of AGI for various income ranges: 1.0% for AGIs below $25k, 0.9% for AGIs $25k-50k, 1.4% for AGIs $50k-75k, 2.3% for AGIs $75k-100k, 3.0% for AGIs $100k-200k)
Total itemized deductions: $19,679 (31% of AGI, reported on 38.4% of returns)
Here:
$19,679
State:
$23,886
Here:
30.6% of AGI
State:
21.5% of AGI
(% of AGI for various income ranges: 11.4% for AGIs below $25k, 19.2% for AGIs $25k-50k, 23.0% for AGIs $50k-75k, 23.4% for AGIs $75k-100k, 22.0% for AGIs $100k-200k, 19.0% for AGIs over 200k)
Charity contributions: $5,114 (reported on 34.2% of returns)
Here:
$5,114
State:
$5,507
(% of AGI for various income ranges: 1.8% for AGIs below $25k, 4.1% for AGIs $25k-50k, 5.3% for AGIs $50k-75k, 5.5% for AGIs $75k-100k, 5.7% for AGIs $100k-200k, 6.3% for AGIs over 200k)
Taxes paid: $4,611 (reported on 38.1% of returns)
30038:
$4,611
State:
$7,838
(% of AGI for various income ranges: 1.7% for AGIs below $25k, 3.5% for AGIs $25k-50k, 5.2% for AGIs $50k-75k, 6.0% for AGIs $75k-100k, 6.5% for AGIs $100k-200k, 6.2% for AGIs over 200k)
Earned income credit: $2,685 (reported on 35.6% of returns)
Here:
$2,685
State:
$2,589
(% of AGI for various income ranges: 12.9% for AGIs below $25k, 1.4% for AGIs $25k-50k)
Percentage of individuals using paid preparers for their 2012 taxes: 53.4%
Here:
53%
State:
55%
(% for various income ranges: 52.7% for AGIs below $25k, 52.3% for AGIs $25k-50k, 56.2% for AGIs $50k-75k, 53.5% for AGIs $75k-100k, 57.4% for AGIs $100k-200k, 64.3% for AGIs over 200k)
Averages for the 2004 tax year for zip code 30038, filed in 2005:
Average Adjusted Gross Income (AGI) in 2004: $37,476 (Individual Income Tax Returns)
Here:
$37,476
State:
$47,553
Salary/wage: $37,219 (reported on 91.3% of returns)
Here:
$37,219
State:
$42,178
(% of AGI for various income ranges: 121.2% for AGIs below $10k, 92.9% for AGIs $10k-25k, 94.7% for AGIs $25k-50k, 91.0% for AGIs $50k-75k, 90.2% for AGIs $75k-100k, 80.4% for AGIs over 100k)
Taxable interest for individuals: $704 (reported on 21.6% of returns)
This zip code:
$704
Georgia:
$1,772
(% of AGI for various income ranges: 1.3% for AGIs below $10k, 0.4% for AGIs $10k-25k, 0.3% for AGIs $25k-50k, 0.5% for AGIs $50k-75k, 0.4% for AGIs $75k-100k, 0.4% for AGIs over 100k)
Taxable dividends: $867 (reported on 9.7% of returns)
Here:
$867
State:
$4,283
(% of AGI for various income ranges: 0.8% for AGIs below $10k, 0.2% for AGIs $10k-25k, 0.2% for AGIs $25k-50k, 0.2% for AGIs $50k-75k, 0.2% for AGIs $75k-100k, 0.4% for AGIs over 100k)
Net capital gain/loss: +$6,629 (reported on 6.9% of returns)
Here:
+$6,629
State:
+$16,461
(% of AGI for various income ranges: -0.8% for AGIs below $10k, -0.1% for AGIs $10k-25k, 0.1% for AGIs $25k-50k, 0.2% for AGIs $50k-75k, 0.8% for AGIs $75k-100k, 5.4% for AGIs over 100k)
IRA payment deduction: $2,214 (reported on 1.5% of returns)
30038:
$2,214
Georgia:
$2,969
(% of AGI for various income ranges: 0.3% for AGIs below $10k, 0.1% for AGIs $10k-25k, 0.1% for AGIs $25k-50k, 0.1% for AGIs $50k-75k, 0.0% for AGIs $75k-100k, 0.0% for AGIs over 100k)
Self-employed pension: $7,419 (reported on 0.2% of returns)
Here:
$7,419
Georgia:
$16,203
Total itemized deductions: $18,924 (34% of AGI, reported on 51.3% of returns)
Here:
$18,924
State:
$19,944
Here:
34.2% of AGI
State:
22.6% of AGI
(% of AGI for various income ranges: 19.1% for AGIs below $10k, 17.5% for AGIs $10k-25k, 27.8% for AGIs $25k-50k, 29.2% for AGIs $50k-75k, 26.5% for AGIs $75k-100k, 24.4% for AGIs over 100k)
Charity contributions deductions: $4,544 (8% of AGI, reported on 47.5% of returns)
Here:
$4,544
State:
$4,354
Here:
8.0% of AGI
State:
4.7% of AGI
(% of AGI for various income ranges: 1.8% for AGIs below $10k, 3.1% for AGIs $10k-25k, 5.8% for AGIs $25k-50k, 6.4% for AGIs $50k-75k, 6.7% for AGIs $75k-100k, 6.4% for AGIs over 100k)
Total tax: $4,201 (reported on 66.6% of returns)
30038:
$4,201
State:
$8,223
(% of AGI for various income ranges: 3.8% for AGIs below $10k, 2.8% for AGIs $10k-25k, 4.8% for AGIs $25k-50k, 7.5% for AGIs $50k-75k, 8.8% for AGIs $75k-100k, 14.0% for AGIs over 100k)
Earned income credit: $1,976 (reported on 28.0% of returns)
Here:
$1,976
State:
$1,986
Percentage of individuals using paid preparers for their 2004 taxes: 58.5%
Here:
59%
State:
62%
(% for various income ranges: 51.9% for AGIs below $10k, 63.5% for AGIs $10k-25k, 57.7% for AGIs $25k-50k, 59.9% for AGIs $50k-75k, 58.5% for AGIs $75k-100k, 57.3% for AGIs over 100k)
Likely homosexual households (counted as self-reported same-sex unmarried-partner households)
Lesbian couples: 0.2% of all households
Gay men: 0.0% of all households
Household received Food Stamps/SNAP in the past 12 months: 2,455 Household did not receive Food Stamps/SNAP in the past 12 months: 12,325
Women who had a birth in the past 12 months: 442 (202 now married, 240 unmarried) Women who did not have a birth in the past 12 months: 11,353 (2,117 now married, 9,260 unmarried)
Housing units in zip code 30038 with a mortgage: 7,082 (606 second mortgage, 148 home equity loan, 274 both second mortgage and home equity loan) Houses without a mortgage: 230
Median monthly owner costs for units with a mortgage: $1,439 Median monthly owner costs for units without a mortgage: $516
Residents with income below the poverty level in 2022:
This zip code:
11.8%
Whole state:
12.7%
Residents with income below 50% of the poverty level in 2022:
This zip code:
4.5%
Whole state:
6.3%
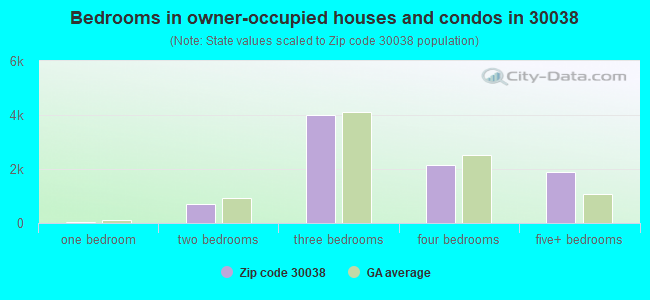
Median number of rooms in houses and condos:
Here:
7.4
State:
6.8
Median number of rooms in apartments:
Here:
5.2
State:
4.6
Notable locations in this zip code not listed on our city pages
Notable locations in zip code 30038: Fairington Golf Course (A), DeKalb County Fire and Rescue Department Station 17 (B). Display/hide their locations on the map
Shopping Centers: Evanswood Shopping Center (1), Tiburon Shopping Center (2), The Mall at Stonecrest (3), The Mall at Stonecrest Shopping Center (4). Display/hide their locations on the map
Churches in zip code 30038 include: Flat Rock Church (A), Macedonia Church (B), Philadelphia Church (C), Rock Springs Church (D), Rockland Church (E), Salem Church (F), Turner Hill Church (G), Decatur African Methodist Episcopal Zion Church (H), New Birth Missionary Baptist Church (I). Display/hide their locations on the map
Reservoirs: Arabia Lake (A), Forest Lake (B), Stewart Lake (C), Browns Mill Lake (D), Joels Lake (E), Kelly Lake (F). Display/hide their locations on the map
Streams, rivers, and creeks: Stephenson Creek (A), Snapfinger Creek (B), Pole Bridge Creek (C), Panthers Branch (D), Crooked Creek (E). Display/hide their locations on the map
3,009 married couples with children.
4,504 single-parent households (900 men, 3,604 women).
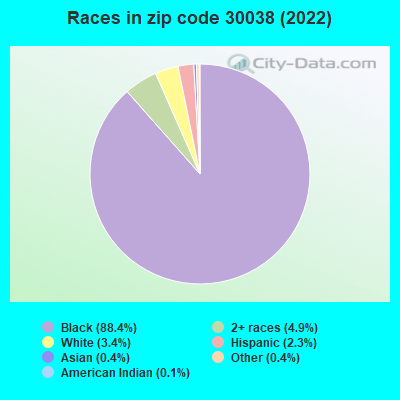
91.9% of residents of 30038 zip code speak English at home.
3.4% of residents speak Spanish at home (78% very well, 19% well, 1% not well, 2% not at all).
1.4% of residents speak other Indo-European language at home (90% very well, 10% well).
3.2% of residents speak other language at home (70% very well, 10% well, 20% not well).
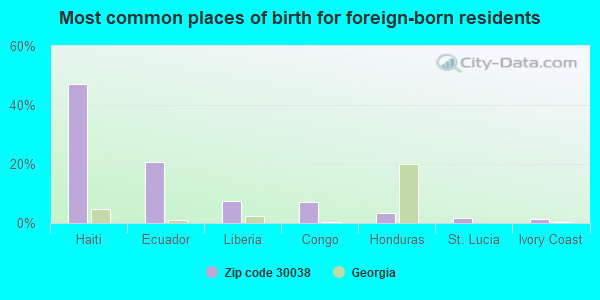
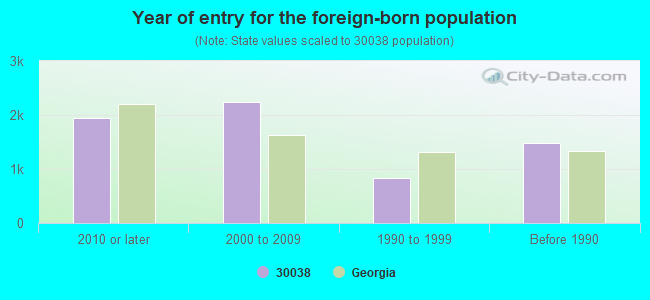
Foreign born population: 5,887 (13.9%) (67.6% of them are naturalized citizens)
Facilities with environmental interests located in this zip code:
MEADOWBROOK GLEN SUBDIVISION (DOGWOOD FARMS ROAD in LITHONIA, GA)
ENFORCEMENT/COMPLIANCE ACTIVITY (Integrated Compliance Information System) - ICIS-04-2005-4752, FORMAL ENFORCEMENT ACTION (Integrated Compliance Information System) - ICIS-04-2005-4752, FORMAL ENFORCEMENT ACTION
OMNI OXIDE CORPORATION (5174 MINOLA DRIVE in LITHONIA, GA)
AIR MINOR (AIRS/AFS) CRITERIA AND HAZARDOUS AIR POLLUTANT INVENTORY (Inventory of air pollution sources) Small Quantity Generators, between 100 kg and 1000 kg of hazardous waste/month (Resource Conservation and Recovery Act (tracking hazardous waste)) - notification TRI REPORTER (Tracking of toxic chemicals releasing facilities) Business SIC classification: PRIMARY METAL PRODUCTS Organizations: GEORGIA OXIDE (CONTACT/OPERATOR)
, ARCADIA ENTERPRISES (CONTACT/OWNER)
Alternative names: GEORGIA OXIDE, GEORGIA OXIDE DIV. OF OMNI OXIDE
FAIRINGTON ELEMENTARY SCHOOL (5505 PHILIP BRADLEY DRIVE in DECATUR, GA)
(Geographic Names Information System) (National Center for Education Statistics) - STATE ID-0375 Organizations: DEKALB COUNTY (SCHOOL DISTRICT)
MARTIN LUTHER KING, JR. HIGH SCHOOL (3991 SNAPFINGER ROAD in LITHONIA, GA)
(National Center for Education Statistics) - STATE ID-0103 Organizations: DEKALB COUNTY (SCHOOL DISTRICT)
MURPHY CANDLER ELEMENTARY SCHOOL (6775 SOUTH GODDARD ROAD in LITHONIA, GA)
(National Center for Education Statistics) - STATE ID-4052 Organizations: DEKALB COUNTY (SCHOOL DISTRICT)
PROCOATERS INC (5259 MINOLA DRIVE in LITHONIA, GA)
AIR MINOR (AIRS/AFS) Conditionally Exempt Small Quantity Generators, less than 100 kg/month of hazardous waste (Resource Conservation and Recovery Act (tracking hazardous waste)) - notification Business SIC classification: SHEET METALWORK Business NAICS classification: PLASTICS MATERIAL AND RESIN MANUFACTURING.; ELECTROPLATING, PLATING, POLISHING, ANODIZING, AND COLORING.; SWITCHGEAR AND SWITCHBOARD APPARATUS MANUFACTURING. Organizations: OPERNAME (CONTACT/OPERATOR)
, JAMES G HAMILTON (CONTACT/OWNER)
Alternative names: PCI PROCOATERS INC
CENTRE AT PANOLA/KRG PANOLA I LLC (3055 PANOLA RD in LITHONIA, GA)
(Resource Conservation and Recovery Act (tracking hazardous waste)) Business NAICS classification: RESIDENTIAL PROPERTY MANAGERS. Alternative names: CENTRE AT PANOLE/KRG PANOLA I LLC
OLDCASTLE MATERIALS SOUTHEAST (7262 GODDARD RD in LITHONIA, GA)
AIR MINOR (AIRS/AFS) Business SIC classification: CRUSHED AND BROKEN GRANITE Alternative names: HOUSWORTH ROCK QUARRY, OLDCASTLE (SRM AGGREGATES)
BP FACILITY #70704 (2944 PANOLA RD in LITHONIA, GA)
Conditionally Exempt Small Quantity Generators, less than 100 kg/month of hazardous waste (Resource Conservation and Recovery Act (tracking hazardous waste)) Organizations: BP PRODUCTS NORTH AMERICA INC (CONTACT/OPERATOR)
Alternative names: BP OIL CO #70704
MECHANICAL JOBBERS MARKETING INC (7625 MALL PKWY in LITHONIA, GA)
Small Quantity Generators, between 100 kg and 1000 kg of hazardous waste/month (Resource Conservation and Recovery Act (tracking hazardous waste)) Organizations: MIKE KING (CONTACT/OWNER)
AMTICO INTERNATIONAL INC (5079 CHATOOGA DR in LITHONIA, GA)
Conditionally Exempt Small Quantity Generators, less than 100 kg/month of hazardous waste (Resource Conservation and Recovery Act (tracking hazardous waste)) - notification Organizations: THE AMTICO CO LIMITED (CONTACT/OWNER)
Housing units lacking complete plumbing facilities: 0.2% Housing units lacking complete kitchen facilities: 1.0%
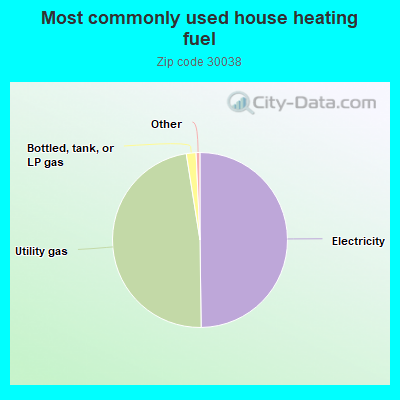
49.8%Electricity
47.7%Utility gas
1.8%Bottled, tank, or LP gas
Population in 1990: 15,583. Population change in the 1990s: +8,110 (+52.0%).
Place of birth for U.S.-born residents:
This state: 21,395
Northeast: 4,017
Midwest: 1,788
South: 7,927
West: 716
46% of the 30038 zip code residents lived in the same house 5 years ago. Out of people who lived in different houses, 52% lived in this county. Out of people who lived in different counties, 50% lived in Georgia.
84% of the 30038 zip code residents lived in the same house 1 year ago. Out of people who lived in different houses, 47% moved from this county. Out of people who lived in different houses, 20% moved from different county within same state. Out of people who lived in different houses, 30% moved from different state. Out of people who lived in different houses, 1% moved from abroad.
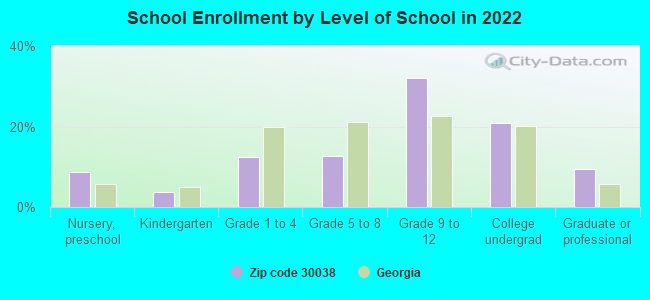
Private vs. public school enrollment:
Students in private schools in grades 1 to 8 (elementary and middle school): 209
Here:
6.4%
Georgia:
12.1%
Students in private schools in grades 9 to 12 (high school): 344
Here:
8.2%
Georgia:
10.8%
Students in private undergraduate colleges: 95
Here:
3.5%
Georgia:
17.1%
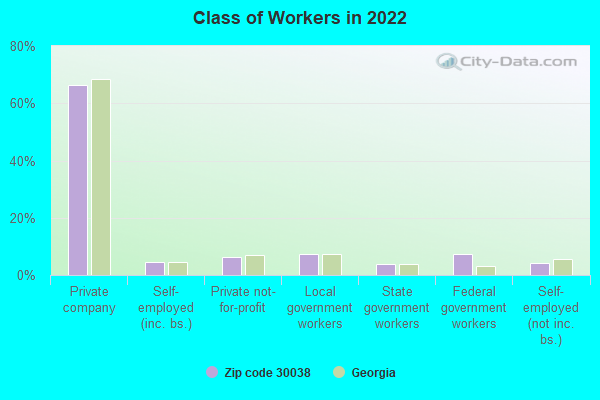
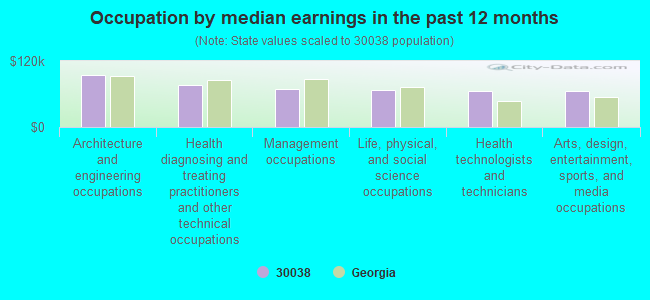
Occupation by median earnings in the past 12 months ($)
95,332Architecture and engineering occupations
75,874Health diagnosing and treating practitioners and other technical occupations
69,986Management occupations
67,502Life, physical, and social science occupations
64,808Health technologists and technicians
64,768Arts, design, entertainment, sports, and media occupations
Companies with federal contracts located in this zip code:
FLORENCE B SHAFIQ MD (3178 ROSENHEATH in LITHONIA, GA; small business) : $89,416 in 6 contractsfrom 1999 to 2002
Contracts for Internal Medicine Services by SOCIAL SECURITY ADMINISTRATION Signed by year:2000: $32,000; 2001: $49,000; 2002: $4,416; 2003: $0; 2004: $0; 2005: $0; 2006: $0.
Biggest contracts:
$32,000 with SOCIAL SECURITY ADMINISTRATION for Internal Medicine Services. Signed on 2000-07-15. Completion date: 2000-12-15.
$25,000, same as above.Signed on 2001-01-15. Completion date: 2001-12-15.
$20,000, same as above.Signed on 2001-05-15. Completion date: 2001-06-15.
$4,416, same as above.Signed on 2002-12-15. Completion date: 2007-12-15.
T W ENTERPRISES (11 RUE FONTAINE in LITHONIA, GA; small business) : $40,028 in 4 contractsfrom 2003 to 2005
$38,820 with Army for Lease or Rental of Equipment -- Miscellaneous. Taking place in KY. Signed on 2005-04-29. Completion date: 2006-04-30.
$24,189 with Army for Lease or Rental of Equipment -- Miscellaneous. Signed on 2005-02-28. Completion date: 2005-05-01.
$6,134 with Army for Boxes, Cartons, and Crates. Signed on 2003-04-11. Completion date: 2003-04-09.
-$29,115 with Army for Lease or Rental of Equipment -- Miscellaneous. Taking place in KY. Signed on 2005-08-05. Completion date: 2006-04-30.
Top industries in this zip code by the number of employees in 2005:
2002 - 2018 National Fire Incident Reporting System (NFIRS) incidents
Based on the data from the years 2002 - 2018 the average number of fire incidents per year is 26. The highest number of reported fires - 77 took place in 2018, and the least - 0 in 2004. The data has a growing trend.
When looking into fire subcategories, the most incidents belonged to: Structure Fires (35.8%), and Outside Fires (30.8%).
Fire incident types reported to NFIRS in Zip Code 30038


 Nearest zip codes: 30058, 30035, 30088, 30094, 30034, 30281.
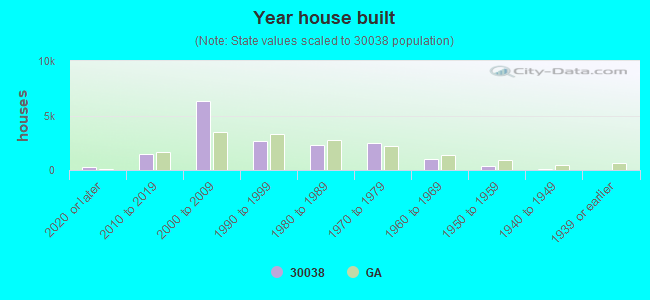


 Based on the data from the years 2002 - 2018 the average number of fire incidents per year is 26. The highest number of reported fires - 77 took place in 2018, and the least - 0 in 2004. The data has a growing trend.
 When looking into fire subcategories, the most incidents belonged to: Structure Fires (35.8%), and Outside Fires (30.8%).