Estimated zip code population in 2022: 51,903 Zip code population in 2010: 46,076 Zip code population in 2000: 42,244
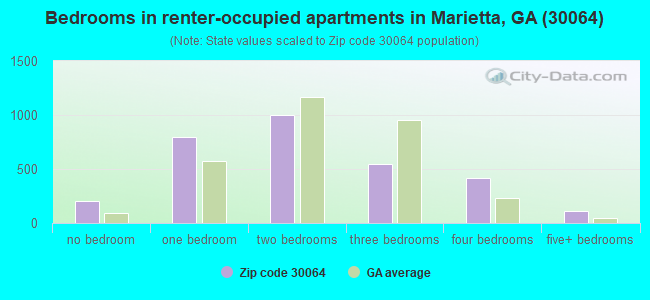
Houses and condos: 19,501 Renter-occupied apartments: 3,103
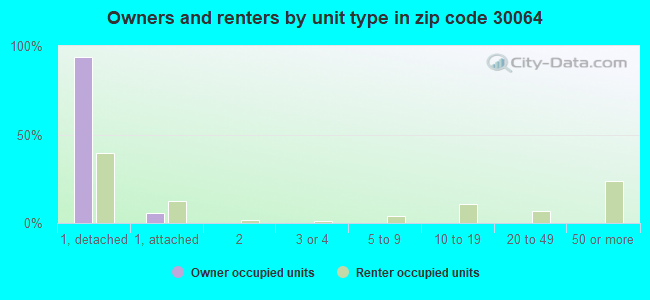
% of renters here:
16%
State:
34%
March 2022 cost of living index in zip code 30064: 101.9 (near average, U.S. average is 100)
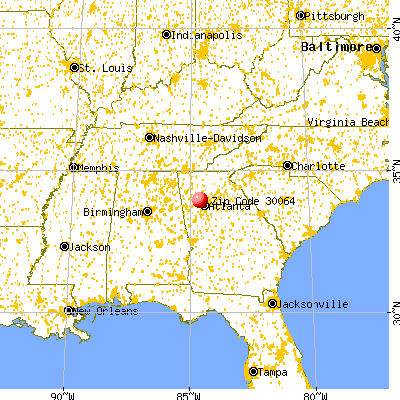
Land area: 31.9 sq. mi. Water area: 0.2 sq. mi.
Population density: 1,629 people per square mile
(low).
OSM Map
General Map
Google Map
MSN Map
OSM Map
General Map
Google Map
MSN Map
OSM Map
General Map
Google Map
MSN Map
OSM Map
General Map
Google Map
MSN Map
Please wait while loading the map...
Real estate property taxes paid for housing units in 2022:
This zip code:
0.6% ($2,702)
Georgia:
0.7% ($2,160)
Median real estate property taxes paid for housing units with mortgages in 2022: $2,952 (0.6%) Median real estate property taxes paid for housing units with no mortgage in 2022: $1,758 (0.4%)
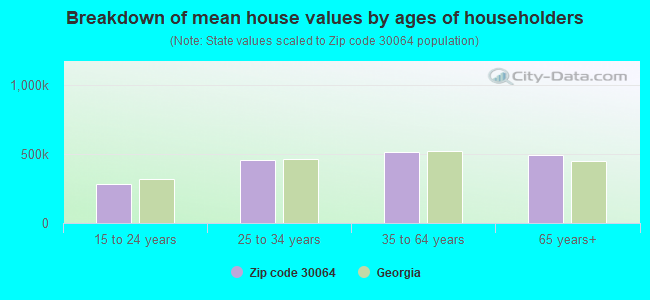
Estimated median house/condo value in 2022: $467,688
30064:
$467,688
Georgia:
$297,400
According to our research of Georgia and other state lists, there were 32 registered sex offenders living in 30064 zip code as of April 27, 2024. The ratio of all residents to sex offenders in zip code 30064 is 1,520 to 1. The ratio of registered sex offenders to all residents in this zip code is much lower than the state average.
Median resident age:
This zip code:
41.0 years
Georgia median age:
37.6 years
Average household size:
This zip code:
2.7 people
Georgia:
2.6 people
Averages for the 2020 tax year for zip code 30064, filed in 2021:
Average Adjusted Gross Income (AGI) in 2020: $106,563 (Individual Income Tax Returns)
Here:
$106,563
State:
$70,847
Salary/wage: $89,895 (reported on 78.5% of returns)
Here:
$89,895
State:
$59,126
(% of AGI for various income ranges: 1120.8% for AGIs below $25k, 3593.3% for AGIs $25k-50k, 6837.8% for AGIs $50k-75k, 9671.9% for AGIs $75k-100k, 19930.5% for AGIs $100k-200k, 84427.5% for AGIs over 200k)
Taxable interest for individuals: $2,204 (reported on 36.0% of returns)
This zip code:
$2,204
Georgia:
$2,011
(% of AGI for various income ranges: 16.3% for AGIs below $25k, 27.0% for AGIs $25k-50k, 59.4% for AGIs $50k-75k, 104.2% for AGIs $75k-100k, 162.2% for AGIs $100k-200k, 1217.3% for AGIs over 200k)
Ordinary dividends: $8,067 (reported on 29.7% of returns)
Here:
$8,067
State:
$8,996
(% of AGI for various income ranges: 48.0% for AGIs below $25k, 66.9% for AGIs $25k-50k, 165.5% for AGIs $50k-75k, 310.6% for AGIs $75k-100k, 513.4% for AGIs $100k-200k, 3690.6% for AGIs over 200k)
Net capital gain/loss in AGI: +$22,412 (reported on 26.6% of returns)
Here:
+$22,412
State:
+$28,402
(% of AGI for various income ranges: 23.5% for AGIs below $25k, 49.5% for AGIs $25k-50k, 112.5% for AGIs $50k-75k, 297.0% for AGIs $75k-100k, 655.1% for AGIs $100k-200k, 13457.2% for AGIs over 200k)
Profit/loss from business: +$11,453 (reported on 23.0% of returns)
Here:
+$11,453
State:
+$6,707
(% of AGI for various income ranges: 171.6% for AGIs below $25k, 233.5% for AGIs $25k-50k, 213.1% for AGIs $50k-75k, 351.8% for AGIs $75k-100k, 602.2% for AGIs $100k-200k, 2702.4% for AGIs over 200k)
Taxable individual retirement arrangement distribution: $25,086 (reported on 11.1% of returns)
30064:
$25,086
Georgia:
$20,525
(% of AGI for various income ranges: 57.1% for AGIs below $25k, 138.6% for AGIs $25k-50k, 309.2% for AGIs $50k-75k, 556.7% for AGIs $75k-100k, 968.7% for AGIs $100k-200k, 2381.2% for AGIs over 200k)
Self-employed (Keogh) retirement plans: $26,552 (reported on 0.9% of returns)
30064:
$26,552
Georgia:
$27,751
(% of AGI for various income ranges: 40.4% for AGIs $100k-200k, 502.0% for AGIs over 200k)
Total itemized deductions: $37,467 (reported on 19.3% of returns)
Here:
$37,467
State:
$34,001
(% of AGI for various income ranges: 78.3% for AGIs below $25k, 227.8% for AGIs $25k-50k, 586.6% for AGIs $50k-75k, 969.4% for AGIs $75k-100k, 1858.7% for AGIs $100k-200k, 10256.2% for AGIs over 200k)
Charity contributions: $17,333 (reported on 17.3% of returns)
Here:
$17,333
State:
$14,164
(% of AGI for various income ranges: 7.7% for AGIs below $25k, 42.9% for AGIs $25k-50k, 122.4% for AGIs $50k-75k, 232.0% for AGIs $75k-100k, 552.3% for AGIs $100k-200k, 5742.7% for AGIs over 200k)
Taxes paid: $8,063 (reported on 19.2% of returns)
30064:
$8,063
State:
$7,540
(% of AGI for various income ranges: 11.0% for AGIs below $25k, 37.3% for AGIs $25k-50k, 117.8% for AGIs $50k-75k, 250.1% for AGIs $75k-100k, 541.7% for AGIs $100k-200k, 1759.2% for AGIs over 200k)
Earned income credit: $2,205 (reported on 10.8% of returns)
Here:
$2,205
State:
$2,530
(% of AGI for various income ranges: 83.3% for AGIs below $25k, 65.0% for AGIs $25k-50k, 0.7% for AGIs $50k-75k)
Percentage of individuals using paid preparers for their 2020 taxes: 91.8%
Here:
92%
State:
93%
(% for various income ranges: 90.3% for AGIs below $25k, 90.9% for AGIs $25k-50k, 91.8% for AGIs $50k-75k, 92.0% for AGIs $75k-100k, 93.1% for AGIs $100k-200k, 94.4% for AGIs over 200k)
Averages for the 2012 tax year for zip code 30064, filed in 2013:
Average Adjusted Gross Income (AGI) in 2012: $89,061 (Individual Income Tax Returns)
Here:
$89,061
State:
$56,131
Salary/wage: $70,909 (reported on 82.4% of returns)
Here:
$70,909
State:
$47,942
(% of AGI for various income ranges: 72.3% for AGIs below $25k, 77.7% for AGIs $25k-50k, 71.1% for AGIs $50k-75k, 72.6% for AGIs $75k-100k, 76.9% for AGIs $100k-200k, 51.1% for AGIs over 200k)
Taxable interest for individuals: $1,896 (reported on 39.6% of returns)
This zip code:
$1,896
Georgia:
$1,706
(% of AGI for various income ranges: 1.5% for AGIs below $25k, 0.8% for AGIs $25k-50k, 0.9% for AGIs $50k-75k, 0.7% for AGIs $75k-100k, 0.7% for AGIs $100k-200k, 0.9% for AGIs over 200k)
Ordinary dividends: $6,975 (reported on 28.8% of returns)
Here:
$6,975
State:
$7,265
(% of AGI for various income ranges: 2.0% for AGIs below $25k, 1.4% for AGIs $25k-50k, 1.7% for AGIs $50k-75k, 1.7% for AGIs $75k-100k, 1.6% for AGIs $100k-200k, 3.2% for AGIs over 200k)
Net capital gain/loss in AGI: +$14,967 (reported on 22.6% of returns)
Here:
+$14,967
State:
+$16,323
(% of AGI for various income ranges: 0.3% for AGIs $25k-50k, 0.6% for AGIs $50k-75k, 0.6% for AGIs $75k-100k, 1.0% for AGIs $100k-200k, 8.5% for AGIs over 200k)
Profit/loss from business: +$11,312 (reported on 21.1% of returns)
Here:
+$11,312
State:
+$7,583
(% of AGI for various income ranges: 9.9% for AGIs below $25k, 2.8% for AGIs $25k-50k, 2.9% for AGIs $50k-75k, 2.6% for AGIs $75k-100k, 2.2% for AGIs $100k-200k, 2.2% for AGIs over 200k)
Taxable individual retirement arrangement distribution: $19,512 (reported on 12.4% of returns)
30064:
$19,512
Georgia:
$17,199
(% of AGI for various income ranges: 3.4% for AGIs below $25k, 3.1% for AGIs $25k-50k, 3.3% for AGIs $50k-75k, 4.0% for AGIs $75k-100k, 3.2% for AGIs $100k-200k, 1.7% for AGIs over 200k)
Self-employment retirement plans: $21,690 (reported on 0.9% of returns)
30064:
$21,690
Georgia:
$23,277
(% of AGI for various income ranges: 0.1% for AGIs $50k-75k, 0.1% for AGIs $100k-200k, 0.4% for AGIs over 200k)
Total itemized deductions: $28,304 (19% of AGI, reported on 50.1% of returns)
Here:
$28,304
State:
$23,886
Here:
19.2% of AGI
State:
21.5% of AGI
(% of AGI for various income ranges: 13.5% for AGIs below $25k, 16.6% for AGIs $25k-50k, 18.4% for AGIs $50k-75k, 17.6% for AGIs $75k-100k, 17.0% for AGIs $100k-200k, 14.3% for AGIs over 200k)
Charity contributions: $8,033 (reported on 44.7% of returns)
Here:
$8,033
State:
$5,507
(% of AGI for various income ranges: 1.3% for AGIs below $25k, 2.3% for AGIs $25k-50k, 3.0% for AGIs $50k-75k, 3.2% for AGIs $75k-100k, 3.2% for AGIs $100k-200k, 5.7% for AGIs over 200k)
Taxes paid: $9,289 (reported on 50.0% of returns)
30064:
$9,289
State:
$7,838
(% of AGI for various income ranges: 1.7% for AGIs below $25k, 3.3% for AGIs $25k-50k, 4.5% for AGIs $50k-75k, 5.1% for AGIs $75k-100k, 6.2% for AGIs $100k-200k, 5.4% for AGIs over 200k)
Earned income credit: $2,350 (reported on 13.3% of returns)
Here:
$2,350
State:
$2,589
(% of AGI for various income ranges: 6.7% for AGIs below $25k, 1.0% for AGIs $25k-50k)
Percentage of individuals using paid preparers for their 2012 taxes: 51.3%
Here:
51%
State:
55%
(% for various income ranges: 47.3% for AGIs below $25k, 50.1% for AGIs $25k-50k, 53.3% for AGIs $50k-75k, 51.6% for AGIs $75k-100k, 51.3% for AGIs $100k-200k, 68.0% for AGIs over 200k)
Averages for the 2004 tax year for zip code 30064, filed in 2005:
Average Adjusted Gross Income (AGI) in 2004: $72,515 (Individual Income Tax Returns)
Here:
$72,515
State:
$47,553
Salary/wage: $62,116 (reported on 84.0% of returns)
Here:
$62,116
State:
$42,178
(% of AGI for various income ranges: 135.4% for AGIs below $10k, 76.1% for AGIs $10k-25k, 80.2% for AGIs $25k-50k, 78.1% for AGIs $50k-75k, 81.2% for AGIs $75k-100k, 66.2% for AGIs over 100k)
Taxable interest for individuals: $2,116 (reported on 52.2% of returns)
This zip code:
$2,116
Georgia:
$1,772
(% of AGI for various income ranges: 7.2% for AGIs below $10k, 2.6% for AGIs $10k-25k, 1.6% for AGIs $25k-50k, 1.5% for AGIs $50k-75k, 1.1% for AGIs $75k-100k, 1.5% for AGIs over 100k)
Taxable dividends: $3,650 (reported on 35.3% of returns)
Here:
$3,650
State:
$4,283
(% of AGI for various income ranges: 7.6% for AGIs below $10k, 1.8% for AGIs $10k-25k, 1.5% for AGIs $25k-50k, 1.4% for AGIs $50k-75k, 1.1% for AGIs $75k-100k, 2.0% for AGIs over 100k)
Net capital gain/loss: +$16,481 (reported on 27.1% of returns)
Here:
+$16,481
State:
+$16,461
(% of AGI for various income ranges: -3.0% for AGIs below $10k, 1.1% for AGIs $10k-25k, 0.5% for AGIs $25k-50k, 0.9% for AGIs $50k-75k, 1.6% for AGIs $75k-100k, 9.6% for AGIs over 100k)
Profit/loss from business: +$12,497 (reported on 19.1% of returns)
Here:
+$12,497
State:
+$8,201
(% of AGI for various income ranges: 2.1% for AGIs below $10k, 6.3% for AGIs $10k-25k, 3.1% for AGIs $25k-50k, 2.4% for AGIs $50k-75k, 2.8% for AGIs $75k-100k, 3.4% for AGIs over 100k)
IRA payment deduction: $3,236 (reported on 3.0% of returns)
30064:
$3,236
Georgia:
$2,969
(% of AGI for various income ranges: 0.6% for AGIs below $10k, 0.2% for AGIs $10k-25k, 0.2% for AGIs $25k-50k, 0.2% for AGIs $50k-75k, 0.2% for AGIs $75k-100k, 0.1% for AGIs over 100k)
Self-employed pension: $14,531 (reported on 1.6% of returns)
Here:
$14,531
Georgia:
$16,203
(% of AGI for various income ranges: 0.1% for AGIs $10k-25k, 0.1% for AGIs $25k-50k, 0.1% for AGIs $50k-75k, 0.2% for AGIs $75k-100k, 0.4% for AGIs over 100k)
Total itemized deductions: $23,302 (21% of AGI, reported on 56.0% of returns)
Here:
$23,302
State:
$19,944
Here:
20.9% of AGI
State:
22.6% of AGI
(% of AGI for various income ranges: 27.0% for AGIs below $10k, 16.9% for AGIs $10k-25k, 20.2% for AGIs $25k-50k, 21.7% for AGIs $50k-75k, 25.1% for AGIs $75k-100k, 15.2% for AGIs over 100k)
Charity contributions deductions: $4,971 (4% of AGI, reported on 51.8% of returns)
Here:
$4,971
State:
$4,354
Here:
4.3% of AGI
State:
4.7% of AGI
(% of AGI for various income ranges: 1.8% for AGIs below $10k, 2.1% for AGIs $10k-25k, 3.2% for AGIs $25k-50k, 3.6% for AGIs $50k-75k, 3.7% for AGIs $75k-100k, 3.7% for AGIs over 100k)
Total tax: $13,023 (reported on 79.7% of returns)
30064:
$13,023
State:
$8,223
(% of AGI for various income ranges: 4.5% for AGIs below $10k, 4.3% for AGIs $10k-25k, 6.9% for AGIs $25k-50k, 8.9% for AGIs $50k-75k, 10.1% for AGIs $75k-100k, 18.4% for AGIs over 100k)
Earned income credit: $1,831 (reported on 9.8% of returns)
Here:
$1,831
State:
$1,986
Percentage of individuals using paid preparers for their 2004 taxes: 52.2%
Here:
52%
State:
62%
(% for various income ranges: 43.5% for AGIs below $10k, 55.0% for AGIs $10k-25k, 52.1% for AGIs $25k-50k, 53.6% for AGIs $50k-75k, 49.8% for AGIs $75k-100k, 57.6% for AGIs over 100k)
Likely homosexual households (counted as self-reported same-sex unmarried-partner households)
Lesbian couples: 0.1% of all households
Gay men: 0.1% of all households
Household received Food Stamps/SNAP in the past 12 months: 852 Household did not receive Food Stamps/SNAP in the past 12 months: 18,022
Women who had a birth in the past 12 months: 763 (644 now married, 120 unmarried) Women who did not have a birth in the past 12 months: 9,688 (5,238 now married, 4,437 unmarried)
Housing units in zip code 30064 with a mortgage: 11,425 (1,244 second mortgage, 7 home equity loan, 1,074 both second mortgage and home equity loan) Houses without a mortgage: 153
Median monthly owner costs for units with a mortgage: $1,996 Median monthly owner costs for units without a mortgage: $607
Residents with income below the poverty level in 2022:
This zip code:
4.0%
Whole state:
12.7%
Residents with income below 50% of the poverty level in 2022:
This zip code:
2.3%
Whole state:
6.3%
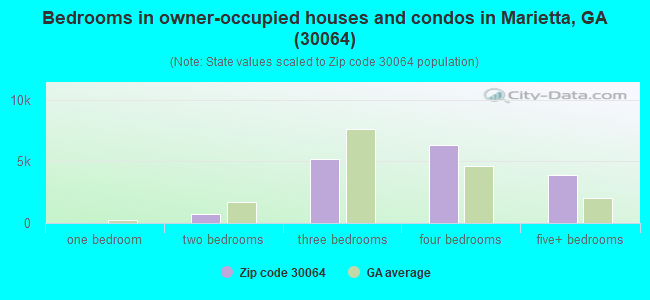
Median number of rooms in houses and condos:
Here:
8.1
State:
6.8
Median number of rooms in apartments:
Here:
4.4
State:
4.6
Notable locations in this zip code not listed on our city pages
Notable locations in zip code 30064: Cheatham Hill Community Club (A), Due West (B), Kolbs Farm (C), Marietta Country Club (D), Marietta Fire Department Station 4 (E), Cobb County Fire and Emergency Services Station 17 (F), Cobb County Fire and Emergency Services Station 13 (G), Marietta Fire Department Station 3 (H), Jo Ann Stratton Branch Cobb County Public Library (I), Boots Wards Recreational Center (J), Kemo Library (K). Display/hide their locations on the map
Shopping Centers: Horsebend Plaza Shopping Center (1), Westbrook Plaza Shopping Center (2), MacLand Pointe Shopping Center (3), Powder Springs Station Shopping Center (4), West Marietta Crossing Shopping Center (5), Westpark Plaza Shopping Center (6). Display/hide their locations on the map
Churches in zip code 30064 include: West Side Church (A), Pleasant Grove Church (B), Big Bethel Church (C), Bethel Church (D), Burnt Hickory Church (E), Due West Church (F), Cheatham Hills Church (G), Browns Chapel (H), Macland Road Church (I). Display/hide their locations on the map
Cemeteries: Saint James Cemetery (1), Cheatham Hills Memorial Park (2), Cheney Cemetery (3), Confederate Cemetery (4), Mountain View Park Cemetery (5), Big Bethel Cemetery (6), Cheatham Hill Cemetery (7). Display/hide their locations on the map
Reservoirs: Bearden Lake (A), Browns Lake (B), Corns Lake (C), Mud Creek Lake Dam (D), Corn Lake (E), Brammett Lake (F), Reeves Lake (G), McNeels Lake (H). Display/hide their locations on the map
Parks in zip code 30064 include: Kennesaw Mountain National Battlefield Park (1), Oregon Park (2), Wild Horse Creek Park (3), Wright Park (4), Hickory Hills Park (5), Laurel Park (6), Whitlock Avenue Historic District (7). Display/hide their locations on the map
10,029 married couples with children.
1,493 single-parent households (485 men, 1,008 women).
87.9% of residents of 30064 zip code speak English at home.
7.0% of residents speak Spanish at home (59% very well, 14% well, 18% not well, 9% not at all).
3.4% of residents speak other Indo-European language at home (78% very well, 17% well, 4% not well).
0.5% of residents speak Asian or Pacific Island language at home (85% very well, 15% well).
1.4% of residents speak other language at home (95% very well, 4% well, 1% not well).
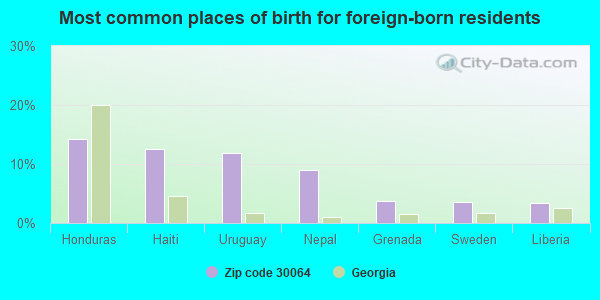
Foreign born population: 5,411 (10.4%) (59.8% of them are naturalized citizens)
Major facilities with environmental interests located in this zip code:
QUIKTRIP #727 (692 POWDER SPRINGS RD in MARIETTA, GA)
STATE MASTER (Georgia's Geographic Environmental Information) - UST-1, UNDERGROUND STORAGE TANK PROGRAM, UST-3, UST-2, Conditionally Exempt Small Quantity Generators, less than 100 kg/month of hazardous waste (Resource Conservation and Recovery Act (tracking hazardous waste)) - notification Organizations: QUIKTRIP CORP (CONTACT/OPERATOR)
, WATKINS SERVICE COMP (INSTALLER)
Alternative names: QUIKTRIP CORP STORE 727, QUIKTRIP STORE #727
MARIETTA HIGH SCHOOL (1171 WHITLOCK AVENUE in MARIETTA, GA)
(Geographic Names Information System) (National Center for Education Statistics) - STATE ID-0101 Organizations: MARIETTA CITY (SCHOOL DISTRICT)
BURRUSS ELEMENTARY SCHOOL (325 MANNING ROAD in MARIETTA, GA)
(National Center for Education Statistics) - STATE ID-0188 Organizations: MARIETTA CITY (SCHOOL DISTRICT)
CHEATHAM HILL ELEMENTARY SCHOOL (1350 JOHN WARD ROAD in MARIETTA, GA)
(National Center for Education Statistics) - STATE ID-0298 Organizations: COBB COUNTY (SCHOOL DISTRICT)
MARIETTA MIDDLE SCHOOL (121 WINN STREET in MARIETTA, GA)
(National Center for Education Statistics) - STATE ID-0203 Organizations: MARIETTA CITY (SCHOOL DISTRICT)
BST MRTTGAMA F5302 (37 POWDER SPRINGS ST in MARIETTA, GA)
(Resource Conservation and Recovery Act (tracking hazardous waste)) Organizations: ATKINS AUSTIN LEE (CONTACT/OWNER)
AUTO PM INC DBA VALVOLINE (1014 WHITLOCK AVE in MARIETTA, GA)
Large Quantity Generators, more that 1000 kg of hazardous waste/month (Resource Conservation and Recovery Act (tracking hazardous waste)) - notification
BP OIL CO (790 POWDER SPRINGS ROAD in MARIETTA, GA)
(Resource Conservation and Recovery Act (tracking hazardous waste))
Housing units lacking complete plumbing facilities: 0.4% Housing units lacking complete kitchen facilities: 1.0%
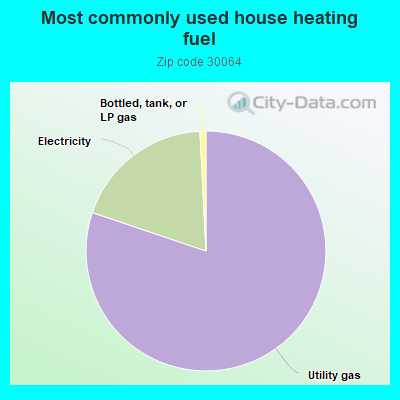
79.8%Utility gas
18.9%Electricity
0.8%Bottled, tank, or LP gas
Population in 1990: 30,260. Population change in the 1990s: +11,984 (+39.6%).
Place of birth for U.S.-born residents:
This state: 22,437
Northeast: 4,734
Midwest: 4,981
South: 11,621
West: 1,918
54% of the 30064 zip code residents lived in the same house 5 years ago. Out of people who lived in different houses, 51% lived in this county. Out of people who lived in different counties, 50% lived in Georgia.
90% of the 30064 zip code residents lived in the same house 1 year ago. Out of people who lived in different houses, 50% moved from this county. Out of people who lived in different houses, 23% moved from different county within same state. Out of people who lived in different houses, 21% moved from different state. Out of people who lived in different houses, 6% moved from abroad.
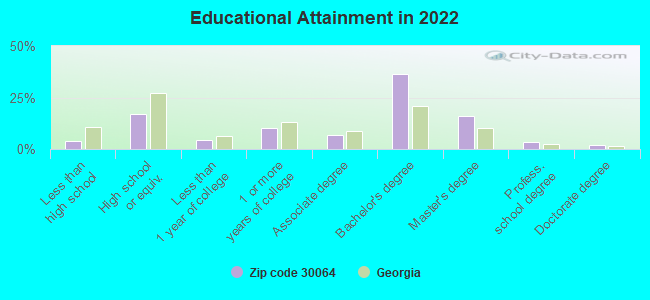
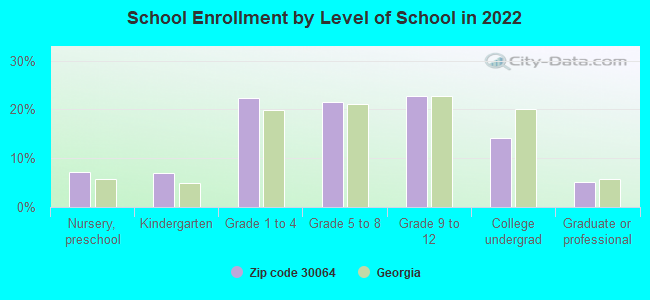
Private vs. public school enrollment:
Students in private schools in grades 1 to 8 (elementary and middle school): 1,171
Here:
20.1%
Georgia:
12.1%
Students in private schools in grades 9 to 12 (high school): 244
Here:
8.2%
Georgia:
10.8%
Students in private undergraduate colleges: 341
Here:
18.3%
Georgia:
17.1%
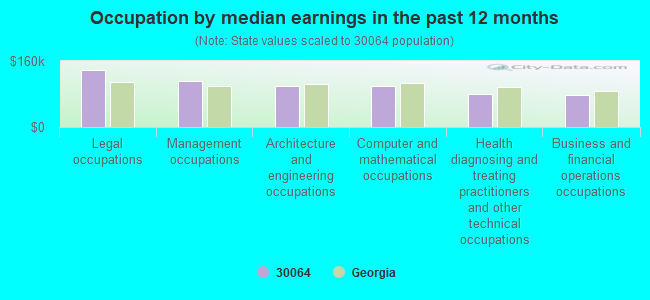
Occupation by median earnings in the past 12 months ($)
137,677Legal occupations
111,733Management occupations
99,754Architecture and engineering occupations
98,405Computer and mathematical occupations
79,816Health diagnosing and treating practitioners and other technical occupations
77,112Business and financial operations occupations
Companies with biggest federal contracts located in this zip code (MARIETTA, GA):
RADAR FLASHLIGHT, LLC (SUITE 410; small business) : $497,666 in 2 contractsfrom 2004 to 2006
$400,000 with Army for Other Defense -- Applied Research and Exploratory Development (R&D). Signed on 2006-03-10. Completion date: 2008-05-31.
$97,666, same as above.Signed on 2004-08-31. Completion date: 2005-04-30.
HEAT TRANSFER COMPONENTS INC (540 POWDER SPRINGS ST SE E; small business) : $356,585 in 4 contractsfrom 2000 to 2005
$155,000 with Defense Logistics Agency for Miscellaneous Maintenance and Repair Shop Specialized Equipment. Signed on 2005-03-10. Completion date: 2005-06-15.
$86,290 with Air Force for Air Conditioning Equipment. Signed on 2001-01-10. Completion date: 2001-04-30.
$80,673 with Air Force for Maintenance, Repair and Rebuilding of Equipment -- Miscellaneous. Signed on 2000-09-30. Completion date: 2000-11-30.
$34,622, same as above.Signed on 2001-07-13. Completion date: 2001-09-30.
$299,964 with Navy for Defense Ships -- Basic Research (R&D). Signed on 2000-01-13. Completion date: 2000-05-05.
SAFECO, INC (905 RANDALL COURT; small business)
$38,076 with Army for Safety and Rescue Equipment. Signed on 2003-07-22. Completion date: 2003-07-28.
HOLLY ENTERPRISES INC (361 N HILLCREST DR STE 100; small business)
$36,160 with Navy for Film/Video Tape Production Services. Signed on 2002-04-19. Completion date: 2002-05-13.
KITNER, SUSAN (380 WHITLOCK WILLOW WAY; small business)
$18,164 with Army for Fencing, Fences, Gates and Components. Signed on 2003-08-08. Completion date: 2003-10-31.
MARIETTA DRAPERY & WINDOW COVE (22 TRAMMELL STREET; small business)
$16,260 with Army for Draperies, Awnings, and Shades. Signed on 2003-07-15. Completion date: 2003-08-29.
NORTH GEORGIA AMATEUR SOFTBALL (281 SHERBROOK CT NW) : $6,728 in 7 contractsfrom 2005 to 2006
Contracts for Recreational Services by Air Force Signed by year:2000: $0; 2001: $0; 2002: $0; 2003: $0; 2004: $0; 2005: $5,131; 2006: $1,597.
Biggest contracts:
$4,000 with Air Force for Recreational Services. Signed on 2005-03-08. Completion date: 2005-06-30.
$3,960, same as above.Signed on 2006-03-13. Completion date: 2006-07-01.
$2,851, same as above.Signed on 2005-09-12. Completion date: 2005-11-18.
$0, same as above.Signed on 2006-02-28. Completion date: 2005-01-18.
CITY OF MARIETTA (500 POWDER SPRINGS ST SE)
$6,041 with Air Force for Maintenance, Repair and Rebuilding of Equipment -- Miscellaneous. Signed on 2005-11-02. Completion date: 2005-11-17.
CJNJ INC (260 MANNING RD SW #130; small business)
$6,000 with Navy for Other Professional Services. Signed on 2005-07-25. Completion date: 2005-09-30.
Top industries in this zip code by the number of employees in 2005:
2002 - 2018 National Fire Incident Reporting System (NFIRS) incidents
According to the data from the years 2002 - 2018 the average number of fires per year is 81. The highest number of reported fire incidents - 147 took place in 2006, and the least - 47 in 2018. The data has a decreasing trend.
When looking into fire subcategories, the most incidents belonged to: Outside Fires (41.7%), and Structure Fires (37.4%).
Fire incident types reported to NFIRS in Zip Code 30064


 Nearest zip codes: 30008, 30152, 30060, 30144, 30106, 30127.


 According to the data from the years 2002 - 2018 the average number of fires per year is 81. The highest number of reported fire incidents - 147 took place in 2006, and the least - 47 in 2018. The data has a decreasing trend.
 When looking into fire subcategories, the most incidents belonged to: Outside Fires (41.7%), and Structure Fires (37.4%).