Estimated zip code population in 2022: 44,649 Zip code population in 2010: 37,470 Zip code population in 2000: 33,051
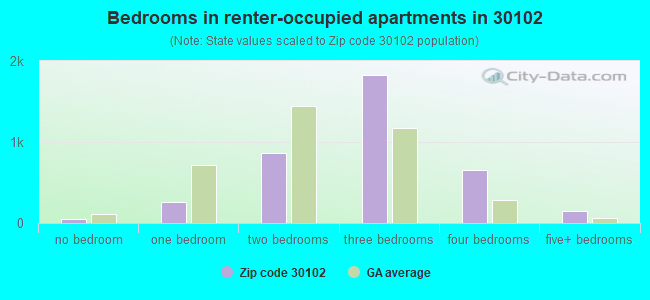
Houses and condos: 16,294 Renter-occupied apartments: 3,850
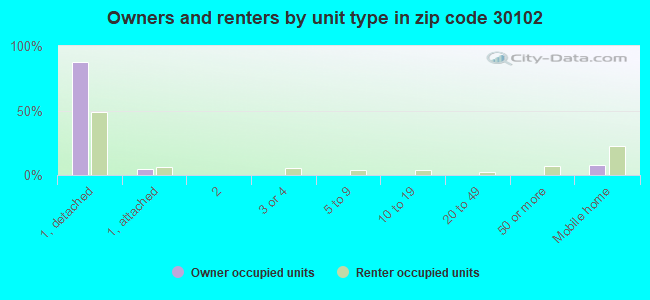
% of renters here:
25%
State:
34%
March 2022 cost of living index in zip code 30102: 100.9 (near average, U.S. average is 100)
Land area: 29.3 sq. mi. Water area: 4.3 sq. mi.
Population density: 1,524 people per square mile
(low).
OSM Map
General Map
Google Map
MSN Map
OSM Map
General Map
Google Map
MSN Map
OSM Map
General Map
Google Map
MSN Map
OSM Map
General Map
Google Map
MSN Map
Please wait while loading the map...
Real estate property taxes paid for housing units in 2022:
This zip code:
0.7% ($2,183)
Georgia:
0.7% ($2,160)
Median real estate property taxes paid for housing units with mortgages in 2022: $2,314 (0.7%) Median real estate property taxes paid for housing units with no mortgage in 2022: $1,541 (0.5%)
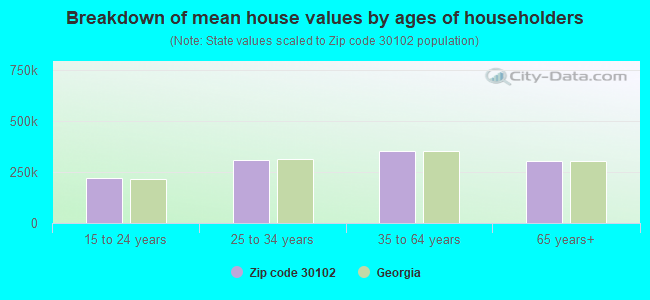
Estimated median house/condo value in 2022: $316,993
30102:
$316,993
Georgia:
$297,400
According to our research of Georgia and other state lists, there were 47 registered sex offenders living in 30102 zip code as of April 27, 2024. The ratio of all residents to sex offenders in zip code 30102 is 838 to 1. The ratio of registered sex offenders to all residents in this zip code is lower than the state average.
Median resident age:
This zip code:
35.5 years
Georgia median age:
37.6 years
Average household size:
This zip code:
2.9 people
Georgia:
2.6 people
Averages for the 2020 tax year for zip code 30102, filed in 2021:
Average Adjusted Gross Income (AGI) in 2020: $60,112 (Individual Income Tax Returns)
Here:
$60,112
State:
$70,847
Salary/wage: $56,227 (reported on 82.4% of returns)
Here:
$56,227
State:
$59,126
(% of AGI for various income ranges: 1127.1% for AGIs below $25k, 3759.6% for AGIs $25k-50k, 7110.9% for AGIs $50k-75k, 10587.8% for AGIs $75k-100k, 20108.4% for AGIs $100k-200k, 63281.9% for AGIs over 200k)
Taxable interest for individuals: $1,076 (reported on 20.2% of returns)
This zip code:
$1,076
Georgia:
$2,011
(% of AGI for various income ranges: 8.5% for AGIs below $25k, 11.9% for AGIs $25k-50k, 20.5% for AGIs $50k-75k, 43.8% for AGIs $75k-100k, 65.3% for AGIs $100k-200k, 735.2% for AGIs over 200k)
Ordinary dividends: $3,475 (reported on 14.5% of returns)
Here:
$3,475
State:
$8,996
(% of AGI for various income ranges: 13.9% for AGIs below $25k, 23.9% for AGIs $25k-50k, 41.2% for AGIs $50k-75k, 97.0% for AGIs $75k-100k, 152.0% for AGIs $100k-200k, 1996.7% for AGIs over 200k)
Net capital gain/loss in AGI: +$10,439 (reported on 13.4% of returns)
Here:
+$10,439
State:
+$28,402
(% of AGI for various income ranges: 6.9% for AGIs below $25k, 21.0% for AGIs $25k-50k, 61.0% for AGIs $50k-75k, 118.7% for AGIs $75k-100k, 472.6% for AGIs $100k-200k, 8296.7% for AGIs over 200k)
Profit/loss from business: +$8,979 (reported on 23.9% of returns)
Here:
+$8,979
State:
+$6,707
(% of AGI for various income ranges: 236.1% for AGIs below $25k, 285.9% for AGIs $25k-50k, 275.4% for AGIs $50k-75k, 211.2% for AGIs $75k-100k, 487.3% for AGIs $100k-200k, 2261.9% for AGIs over 200k)
Taxable individual retirement arrangement distribution: $20,013 (reported on 6.1% of returns)
30102:
$20,013
Georgia:
$20,525
(% of AGI for various income ranges: 31.6% for AGIs below $25k, 78.7% for AGIs $25k-50k, 153.3% for AGIs $50k-75k, 288.4% for AGIs $75k-100k, 550.5% for AGIs $100k-200k, 2038.1% for AGIs over 200k)
Self-employed (Keogh) retirement plans: $18,560 (reported on 0.2% of returns)
30102:
$18,560
Georgia:
$27,751
(% of AGI for various income ranges: 53.3% for AGIs $100k-200k)
Total itemized deductions: $26,992 (reported on 9.9% of returns)
Here:
$26,992
State:
$34,001
(% of AGI for various income ranges: 42.3% for AGIs below $25k, 135.6% for AGIs $25k-50k, 401.4% for AGIs $50k-75k, 635.5% for AGIs $75k-100k, 1217.0% for AGIs $100k-200k, 5223.8% for AGIs over 200k)
Charity contributions: $9,471 (reported on 8.1% of returns)
Here:
$9,471
State:
$14,164
(% of AGI for various income ranges: 3.3% for AGIs below $25k, 26.5% for AGIs $25k-50k, 83.5% for AGIs $50k-75k, 148.7% for AGIs $75k-100k, 358.3% for AGIs $100k-200k, 2440.0% for AGIs over 200k)
Taxes paid: $6,974 (reported on 9.9% of returns)
30102:
$6,974
State:
$7,540
(% of AGI for various income ranges: 5.4% for AGIs below $25k, 27.1% for AGIs $25k-50k, 99.7% for AGIs $50k-75k, 179.7% for AGIs $75k-100k, 357.0% for AGIs $100k-200k, 1192.4% for AGIs over 200k)
Earned income credit: $2,296 (reported on 16.5% of returns)
Here:
$2,296
State:
$2,530
(% of AGI for various income ranges: 99.2% for AGIs below $25k, 72.0% for AGIs $25k-50k, 0.9% for AGIs $50k-75k)
Percentage of individuals using paid preparers for their 2020 taxes: 92.6%
Here:
93%
State:
93%
(% for various income ranges: 90.6% for AGIs below $25k, 93.7% for AGIs $25k-50k, 93.2% for AGIs $50k-75k, 93.6% for AGIs $75k-100k, 93.7% for AGIs $100k-200k, 93.7% for AGIs over 200k)
Averages for the 2012 tax year for zip code 30102, filed in 2013:
Average Adjusted Gross Income (AGI) in 2012: $49,099 (Individual Income Tax Returns)
Here:
$49,099
State:
$56,131
Salary/wage: $46,500 (reported on 86.0% of returns)
Here:
$46,500
State:
$47,942
(% of AGI for various income ranges: 77.0% for AGIs below $25k, 83.6% for AGIs $25k-50k, 83.9% for AGIs $50k-75k, 83.6% for AGIs $75k-100k, 84.8% for AGIs $100k-200k, 63.3% for AGIs over 200k)
Taxable interest for individuals: $820 (reported on 23.5% of returns)
This zip code:
$820
Georgia:
$1,706
(% of AGI for various income ranges: 0.5% for AGIs below $25k, 0.4% for AGIs $25k-50k, 0.3% for AGIs $50k-75k, 0.3% for AGIs $75k-100k, 0.3% for AGIs $100k-200k, 1.0% for AGIs over 200k)
Ordinary dividends: $2,286 (reported on 14.3% of returns)
Here:
$2,286
State:
$7,265
(% of AGI for various income ranges: 0.7% for AGIs below $25k, 0.5% for AGIs $25k-50k, 0.6% for AGIs $50k-75k, 0.6% for AGIs $75k-100k, 0.7% for AGIs $100k-200k, 1.3% for AGIs over 200k)
Net capital gain/loss in AGI: +$2,796 (reported on 9.8% of returns)
Here:
+$2,796
State:
+$16,323
(% of AGI for various income ranges: 0.3% for AGIs $50k-75k, 0.3% for AGIs $75k-100k, 0.7% for AGIs $100k-200k, 2.6% for AGIs over 200k)
Profit/loss from business: +$7,813 (reported on 20.9% of returns)
Here:
+$7,813
State:
+$7,583
(% of AGI for various income ranges: 13.0% for AGIs below $25k, 3.9% for AGIs $25k-50k, 1.9% for AGIs $50k-75k, 1.5% for AGIs $75k-100k, 1.2% for AGIs $100k-200k, 4.3% for AGIs over 200k)
Taxable individual retirement arrangement distribution: $14,874 (reported on 7.1% of returns)
30102:
$14,874
Georgia:
$17,199
(% of AGI for various income ranges: 1.7% for AGIs below $25k, 2.0% for AGIs $25k-50k, 2.1% for AGIs $50k-75k, 2.3% for AGIs $75k-100k, 2.0% for AGIs $100k-200k, 3.2% for AGIs over 200k)
Self-employment retirement plans: $12,800 (reported on 0.2% of returns)
30102:
$12,800
Georgia:
$23,277
Total itemized deductions: $19,153 (22% of AGI, reported on 37.4% of returns)
Here:
$19,153
State:
$23,886
Here:
22.4% of AGI
State:
21.5% of AGI
(% of AGI for various income ranges: 9.3% for AGIs below $25k, 13.4% for AGIs $25k-50k, 15.9% for AGIs $50k-75k, 16.8% for AGIs $75k-100k, 15.6% for AGIs $100k-200k, 13.0% for AGIs over 200k)
Charity contributions: $3,511 (reported on 31.1% of returns)
Here:
$3,511
State:
$5,507
(% of AGI for various income ranges: 0.7% for AGIs below $25k, 1.7% for AGIs $25k-50k, 2.3% for AGIs $50k-75k, 2.5% for AGIs $75k-100k, 2.6% for AGIs $100k-200k, 3.0% for AGIs over 200k)
Taxes paid: $5,770 (reported on 37.2% of returns)
30102:
$5,770
State:
$7,838
(% of AGI for various income ranges: 1.2% for AGIs below $25k, 2.7% for AGIs $25k-50k, 4.0% for AGIs $50k-75k, 5.0% for AGIs $75k-100k, 5.8% for AGIs $100k-200k, 5.9% for AGIs over 200k)
Earned income credit: $2,364 (reported on 21.6% of returns)
Here:
$2,364
State:
$2,589
(% of AGI for various income ranges: 8.0% for AGIs below $25k, 1.3% for AGIs $25k-50k)
Percentage of individuals using paid preparers for their 2012 taxes: 46.4%
Here:
46%
State:
55%
(% for various income ranges: 45.5% for AGIs below $25k, 45.8% for AGIs $25k-50k, 49.0% for AGIs $50k-75k, 45.3% for AGIs $75k-100k, 47.1% for AGIs $100k-200k, 60.0% for AGIs over 200k)
Averages for the 2004 tax year for zip code 30102, filed in 2005:
Average Adjusted Gross Income (AGI) in 2004: $45,279 (Individual Income Tax Returns)
Here:
$45,279
State:
$47,553
Salary/wage: $43,612 (reported on 87.6% of returns)
Here:
$43,612
State:
$42,178
(% of AGI for various income ranges: 110.1% for AGIs below $10k, 81.5% for AGIs $10k-25k, 87.3% for AGIs $25k-50k, 88.2% for AGIs $50k-75k, 88.4% for AGIs $75k-100k, 77.1% for AGIs over 100k)
Taxable interest for individuals: $1,005 (reported on 34.8% of returns)
This zip code:
$1,005
Georgia:
$1,772
(% of AGI for various income ranges: 3.4% for AGIs below $10k, 1.1% for AGIs $10k-25k, 0.7% for AGIs $25k-50k, 0.5% for AGIs $50k-75k, 0.4% for AGIs $75k-100k, 1.0% for AGIs over 100k)
Taxable dividends: $1,497 (reported on 19.7% of returns)
Here:
$1,497
State:
$4,283
(% of AGI for various income ranges: 2.2% for AGIs below $10k, 0.5% for AGIs $10k-25k, 0.3% for AGIs $25k-50k, 0.4% for AGIs $50k-75k, 0.5% for AGIs $75k-100k, 1.1% for AGIs over 100k)
Net capital gain/loss: +$5,739 (reported on 14.4% of returns)
Here:
+$5,739
State:
+$16,461
(% of AGI for various income ranges: -0.9% for AGIs below $10k, -0.3% for AGIs $10k-25k, 0.2% for AGIs $25k-50k, 0.4% for AGIs $50k-75k, 0.6% for AGIs $75k-100k, 5.2% for AGIs over 100k)
Profit/loss from business: +$7,332 (reported on 18.5% of returns)
Here:
+$7,332
State:
+$8,201
(% of AGI for various income ranges: 10.7% for AGIs below $10k, 8.2% for AGIs $10k-25k, 3.1% for AGIs $25k-50k, 2.3% for AGIs $50k-75k, 1.9% for AGIs $75k-100k, 2.4% for AGIs over 100k)
IRA payment deduction: $2,922 (reported on 2.2% of returns)
30102:
$2,922
Georgia:
$2,969
(% of AGI for various income ranges: 0.2% for AGIs $10k-25k, 0.2% for AGIs $25k-50k, 0.2% for AGIs $50k-75k, 0.1% for AGIs $75k-100k, 0.1% for AGIs over 100k)
Self-employed pension: $11,536 (reported on 0.5% of returns)
Here:
$11,536
Georgia:
$16,203
(% of AGI for various income ranges: 0.1% for AGIs $10k-25k, 0.0% for AGIs $50k-75k, 0.1% for AGIs $75k-100k, 0.3% for AGIs over 100k)
Total itemized deductions: $17,048 (23% of AGI, reported on 46.3% of returns)
Here:
$17,048
State:
$19,944
Here:
23.5% of AGI
State:
22.6% of AGI
(% of AGI for various income ranges: 16.4% for AGIs below $10k, 11.6% for AGIs $10k-25k, 18.3% for AGIs $25k-50k, 20.1% for AGIs $50k-75k, 18.6% for AGIs $75k-100k, 16.0% for AGIs over 100k)
Charity contributions deductions: $2,869 (4% of AGI, reported on 40.4% of returns)
Here:
$2,869
State:
$4,354
Here:
3.8% of AGI
State:
4.7% of AGI
(% of AGI for various income ranges: 0.8% for AGIs below $10k, 1.3% for AGIs $10k-25k, 2.3% for AGIs $25k-50k, 2.6% for AGIs $50k-75k, 2.7% for AGIs $75k-100k, 3.0% for AGIs over 100k)
Total tax: $6,023 (reported on 75.9% of returns)
30102:
$6,023
State:
$8,223
(% of AGI for various income ranges: 4.4% for AGIs below $10k, 4.4% for AGIs $10k-25k, 6.2% for AGIs $25k-50k, 8.3% for AGIs $50k-75k, 9.7% for AGIs $75k-100k, 15.7% for AGIs over 100k)
Earned income credit: $1,809 (reported on 15.8% of returns)
Here:
$1,809
State:
$1,986
Percentage of individuals using paid preparers for their 2004 taxes: 51.6%
Here:
52%
State:
62%
(% for various income ranges: 42.7% for AGIs below $10k, 56.2% for AGIs $10k-25k, 53.8% for AGIs $25k-50k, 54.0% for AGIs $50k-75k, 48.4% for AGIs $75k-100k, 53.5% for AGIs over 100k)
Likely homosexual households (counted as self-reported same-sex unmarried-partner households)
Lesbian couples: 0.3% of all households
Gay men: 0.1% of all households
Household received Food Stamps/SNAP in the past 12 months: 1,338 Household did not receive Food Stamps/SNAP in the past 12 months: 14,212
Women who had a birth in the past 12 months: 740 (523 now married, 216 unmarried) Women who did not have a birth in the past 12 months: 10,614 (4,911 now married, 5,696 unmarried)
Housing units in zip code 30102 with a mortgage: 8,221 (456 second mortgage, 48 home equity loan, 302 both second mortgage and home equity loan) Houses without a mortgage: 206
Median monthly owner costs for units with a mortgage: $1,561 Median monthly owner costs for units without a mortgage: $496
Residents with income below the poverty level in 2022:
This zip code:
9.2%
Whole state:
12.7%
Residents with income below 50% of the poverty level in 2022:
This zip code:
3.9%
Whole state:
6.3%
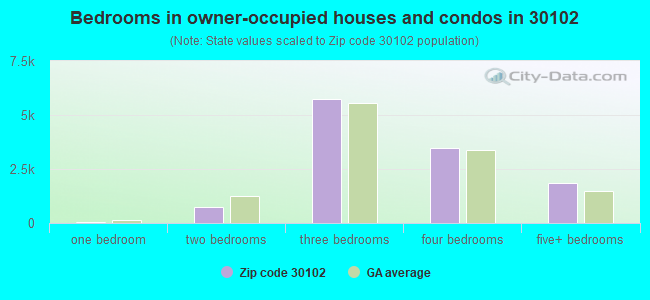
Median number of rooms in houses and condos:
Here:
7.0
State:
6.8
Median number of rooms in apartments:
Here:
5.6
State:
4.6
Notable locations in this zip code not listed on our city pages
Notable locations in zip code 30102: Etowah Yacht Club (A), Camp Kiwanis (B), Kellogg Creek Day Use Area (C), Payne Campground (D), Tanyard Creek Day Use Area (E), Old Hi-way 41 Campground Number 3 (F), Clark Creek Campground (G), Holiday Marina (H), Kings Camps (I), McKinney Campground (J), Iron Hill Campground (K), Atlantic Yacht Club (L), Webster Overlook (M), Galts Ferry Landing (N), Cherokee County Fire Department Station 19 (O), Cherokee County Station 1 Oak Grove Fire Station (P), Cherokee County EMS 4 Fire Station (Q). Display/hide their locations on the map
Churches in zip code 30102 include: New Zion Church (A), Victory Baptist Church (B), New Covenant Church (C), Wildwood Church (D), Oak Grove Baptist Church (E), Oak Grove United Methodist Church (F), New Liberty Church (G), Harvest Church (H), Northpointe Church (I). Display/hide their locations on the map
Cemeteries: Rolling Hills Memory Gardens Cemetery (1), McKinney Family Cemetery (2), New Hope Baptist Church Cemetery (3). Display/hide their locations on the map
Parks in zip code 30102 include: George Washington Carver State Park (1), Clark Creek South Public Use Area (2), Old Highway 41 Recreation Area (3). Display/hide their locations on the map
6,774 married couples with children.
2,062 single-parent households (789 men, 1,273 women).
83.8% of residents of 30102 zip code speak English at home.
9.3% of residents speak Spanish at home (57% very well, 15% well, 14% not well, 14% not at all).
3.4% of residents speak other Indo-European language at home (75% very well, 15% well, 5% not well, 6% not at all).
2.0% of residents speak Asian or Pacific Island language at home (71% very well, 23% well, 5% not well).
1.5% of residents speak other language at home (88% very well, 7% well, 4% not well).
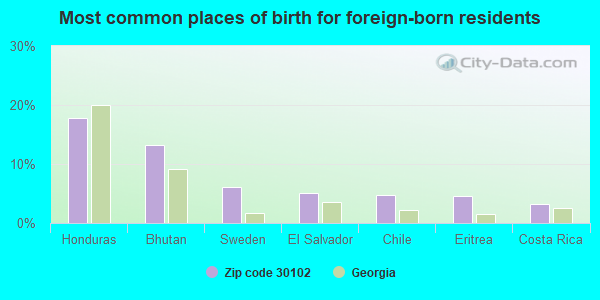
Foreign born population: 5,442 (12.2%) (48.7% of them are naturalized citizens)
This zip code:
12.2%
Whole state:
10.7%
18%Honduras
13%Bhutan
6%Sweden
5%El Salvador
5%Chile
5%Eritrea
3%Costa Rica
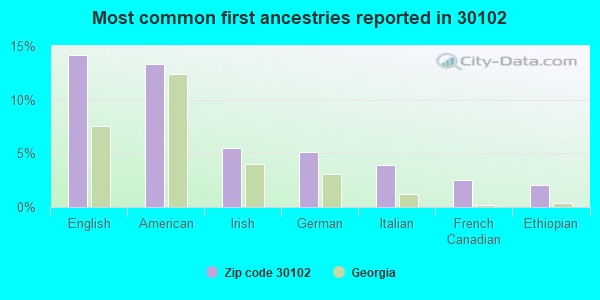
14%English
13%American
5%Irish
5%German
4%Italian
3%French Canadian
2%Ethiopian
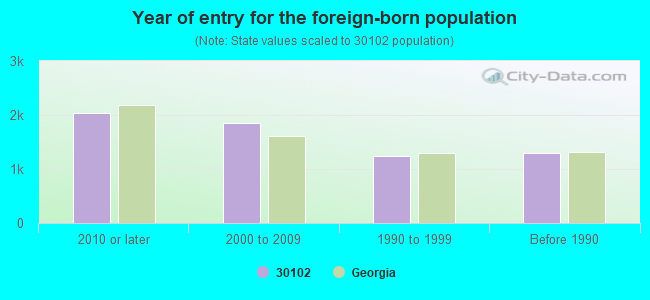
Year of entry for the foreign-born population
2,0432010 or later
1,8452000 to 2009
1,2321990 to 1999
1,302Before 1990
Facilities with environmental interests located in this zip code:
QUIKTRIP #793 (6090 HWY 92 in ACWORTH, GA)
STATE MASTER (Georgia's Geographic Environmental Information) - UST-1, UNDERGROUND STORAGE TANK PROGRAM, UST-2, UST-3, Conditionally Exempt Small Quantity Generators, less than 100 kg/month of hazardous waste (Resource Conservation and Recovery Act (tracking hazardous waste)) - notification Organizations: QUIKTRIP CORP (CONTACT/OPERATOR)
, QE (INSTALLER)
Alternative names: QUIKTRIP STORE #793
OAK GROVE ELEMENTARY SCHOOL (6118 WOODSTOCK ROAD in ACWORTH, GA)
(National Center for Education Statistics) - STATE ID-2054 Organizations: CHEROKEE COUNTY (SCHOOL DISTRICT)
CHEROKEE COMMONS SHOPPING CNTR (6199 HWY 92 in ACWORTH, GA)
Conditionally Exempt Small Quantity Generators, less than 100 kg/month of hazardous waste (Resource Conservation and Recovery Act (tracking hazardous waste)) Organizations: BP PRODUCTS NORTH AMERICA INC (CONTACT/OPERATOR)
Alternative names: BP OIL CO #70757
EXXON RAS 40502 (3523 CHEROKEE ROAD in ACWORTH, GA)
Conditionally Exempt Small Quantity Generators, less than 100 kg/month of hazardous waste (Resource Conservation and Recovery Act (tracking hazardous waste)) - notification Organizations: EXXON MOBIL (CONTACT/OWNER)
Alternative names: EXXON #40502
EXXON RAS 40516 (1151 ALABAMA ROAD in ACWORTH, GA)
Conditionally Exempt Small Quantity Generators, less than 100 kg/month of hazardous waste (Resource Conservation and Recovery Act (tracking hazardous waste)) - notification Organizations: EXXON MOBIL (CONTACT/OWNER)
POLYGARD INC ACWORTH (19 N DR in ACWORTH, GA)
TRI REPORTER (Tracking of toxic chemicals releasing facilities) Business SIC classification: PLASTICS MATERIALS, SYNTHETIC RESINS, AND NONVULCANIZABLE ELASTOMERS
Housing units lacking complete plumbing facilities: 0.8% Housing units lacking complete kitchen facilities: 0.6%
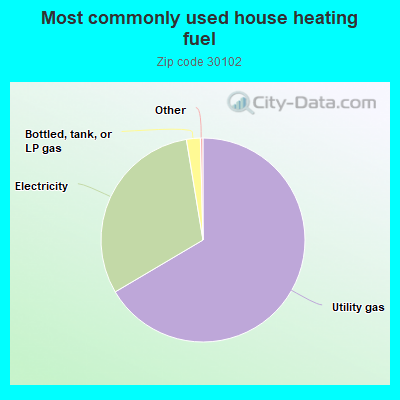
66.5%Utility gas
30.9%Electricity
2.2%Bottled, tank, or LP gas
Place of birth for U.S.-born residents:
This state: 20,816
Northeast: 4,188
Midwest: 3,397
South: 8,027
West: 1,863
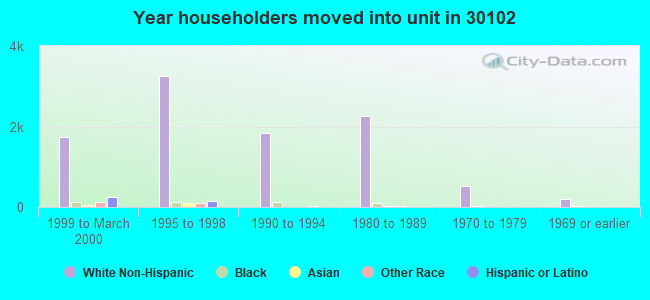
52% of the 30102 zip code residents lived in the same house 5 years ago. Out of people who lived in different houses, 29% lived in this county. Out of people who lived in different counties, 50% lived in Georgia.
89% of the 30102 zip code residents lived in the same house 1 year ago. Out of people who lived in different houses, 44% moved from this county. Out of people who lived in different houses, 36% moved from different county within same state. Out of people who lived in different houses, 10% moved from different state. Out of people who lived in different houses, 8% moved from abroad.
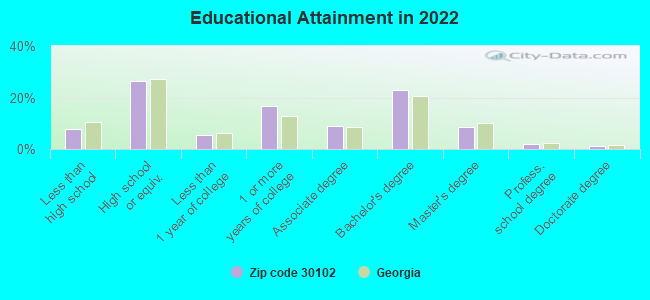
Private vs. public school enrollment:
Students in private schools in grades 1 to 8 (elementary and middle school): 225
Here:
5.1%
Georgia:
12.1%
Students in private schools in grades 9 to 12 (high school): 282
Here:
11.4%
Georgia:
10.8%
Students in private undergraduate colleges: 173
Here:
7.0%
Georgia:
17.1%
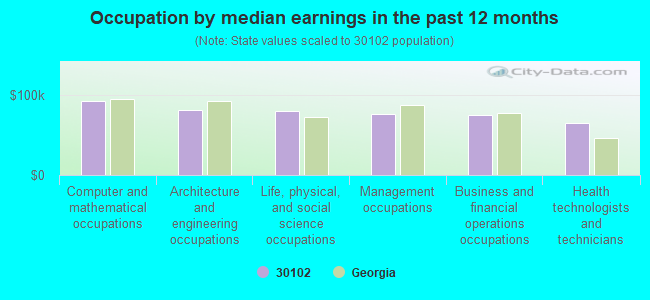
Occupation by median earnings in the past 12 months ($)
92,662Computer and mathematical occupations
82,255Architecture and engineering occupations
80,592Life, physical, and social science occupations
77,198Management occupations
75,145Business and financial operations occupations
65,766Health technologists and technicians
Companies with federal contracts located in this zip code (ACWORTH, GA):
JOHN HOLTMAN & SONS, INC (4650 HAMBY ROAD; small business) : $1,431,645 in 8 contractsfrom 2000 to 2001
Contracts for Construction of Structures and Facilities -- Other Administrative Facilities and Service Buildings, Construction of Structures and Facilities -- Office Buildings, Maintenance, Repair or Alteration of Real Property -- Other Airfield Structures by Army Signed by year:2000: $3,228,325; 2001: -$1,796,680; 2002: $0; 2003: $0; 2004: $0; 2005: $0; 2006: $0.
Biggest contracts:
$3,019,187 with Army for Construction of Structures and Facilities -- Other Administrative Facilities and Service Buildings. Taking place in AL. Signed on 2000-08-23. Completion date: 2001-09-07.
$92,663, same as above.Signed on 2000-12-21. Completion date: 2001-10-09.
$66,378 with Army for Construction of Structures and Facilities -- Office Buildings. Taking place in AL. Signed on 2001-05-10. Completion date: 2001-10-09.
$58,110 with Army for Maintenance, Repair or Alteration of Real Property -- Other Airfield Structures. Taking place in AL. Signed on 2000-08-16. Completion date: 2000-03-19.
CUSTOM DESIGN BUILDINGS (2625 RAMBLEWOOD CT; small business) : $130,460 in 2 contractsfrom 1999 to 2000
$65,230 with Air Force for Lease or Rental of Facilities -- Miscellaneous Buildings. Taking place in MS. Signed on 2000-10-24. Completion date: 2001-09-30.
$65,230, same as above.Signed on 1999-10-01. Completion date: 2000-09-30.
SPEARMAN MOVING SVCS (3425 SPINNAKER WAY; small business) : $63,120 in 7 contractsfrom 2001 to 2005
Contracts for Relocation Services, Warehousing and Storage Services by Public Buildings Service, Air Force Signed by year:2000: $0; 2001: $36,000; 2002: $0; 2003: $0; 2004: $2,295; 2005: $24,825; 2006: $0.
Biggest contracts:
$36,000 with Public Buildings Service for Relocation Services. Signed on 2001-08-15. Completion date: 2001-09-15.
$6,466 with Air Force for Warehousing and Storage Services. Signed on 2005-08-19. Completion date: 2005-08-22.
$5,519, same as above.Signed on 2005-07-26. Completion date: 2005-08-01.
$5,237, same as above.Signed on 2005-03-31. Completion date: 2005-04-08.
BRYANT, FRANCES (3506 TWIN PINES DR; small business) : $26,490 in 4 contractsfrom 2005 to 2006
$9,408 with Army for Recreation Site Maintenance Services (non-construction). Signed on 2006-03-08. Completion date: 2006-09-18.
$8,415 with U.S. Army Corps of Engineers - civil program financing only for Recreation Site Maintenance Services (non-construction). Signed on 2005-03-02. Completion date: 2005-09-19.
$8,415 with Army for Recreation Site Maintenance Services (non-construction). Signed on 2005-03-02. Completion date: 2005-09-19.
$252, same as above.Signed on 2006-03-13. Completion date: 2006-09-18.
PEARSON TECHNOLOGIES INC (4671 HICKORY BEND DR NW; small business)
$16,000 with Air Force for Vocational/Technical. Taking place in CA. Signed on 2006-03-16. Completion date: 2006-04-21.
DAY, JIMMIE (6452 TUPELO DR; small business) : $14,685 in 3 contractsfrom 2005 to 2006
$5,925 with Army for Recreation Site Maintenance Services (non-construction). Signed on 2006-03-24. Completion date: 2006-09-06.
$4,380, same as above.Signed on 2005-04-11. Completion date: 2006-09-07.
$4,380 with U.S. Army Corps of Engineers - civil program financing only for Recreation Site Maintenance Services (non-construction). Signed on 2005-04-11. Completion date: 2006-09-07.
CARLA AND WILLIE MARSHALL (6659 MCKINNY CG RD; small business) : $14,460 in 2 contractsfrom 2000 to 2001
$8,910 with U.S. Army Corps of Engineers - civil program financing only for Recreation Site Maintenance Services (non-construction). Signed on 2000-10-23. Completion date: 2001-03-30.
$5,550, same as above.Signed on 2001-05-17. Completion date: 2001-09-10.
Top industries in this zip code by the number of employees in 2005:
Administrative and Support and Waste Management and Remediation Services: Landscaping Services (100-249 employees: 1 establishment, 50-99 employees: 1 establishment, 5-9 employees: 1 establishment, 1-4 employees: 12 establishments)
2002 - 2018 National Fire Incident Reporting System (NFIRS) incidents
According to the data from the years 2002 - 2018 the average number of fires per year is 87. The highest number of reported fire incidents - 148 took place in 2011, and the least - 12 in 2004. The data has a decreasing trend.
When looking into fire subcategories, the most incidents belonged to: Outside Fires (45.2%), and Structure Fires (33.3%).
Fire incident types reported to NFIRS in Zip Code 30102

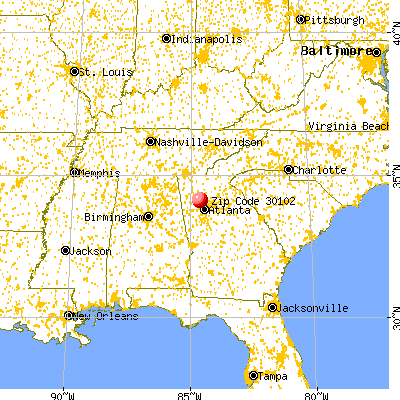


 Nearest zip codes: 30189, 30144, 30101, 30152, 30137, 30066.


 According to the data from the years 2002 - 2018 the average number of fires per year is 87. The highest number of reported fire incidents - 148 took place in 2011, and the least - 12 in 2004. The data has a decreasing trend.
 When looking into fire subcategories, the most incidents belonged to: Outside Fires (45.2%), and Structure Fires (33.3%).