Estimated zip code population in 2022: 17,780 Zip code population in 2010: 18,411 Zip code population in 2000: 14,571
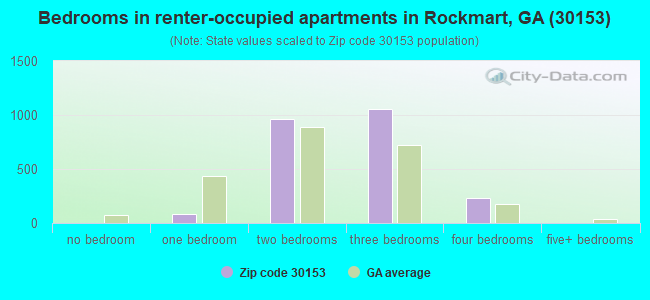
Houses and condos: 7,343 Renter-occupied apartments: 2,331
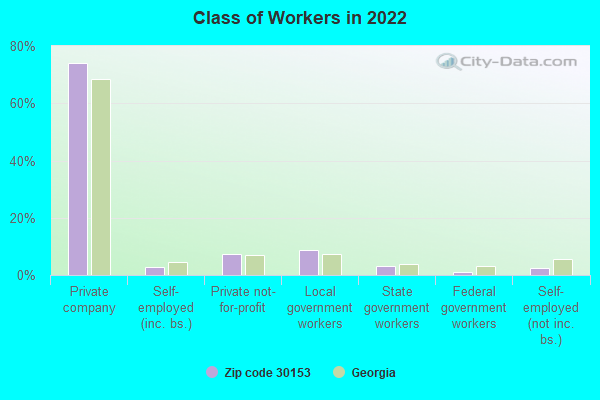
% of renters here:
36%
State:
34%
March 2022 cost of living index in zip code 30153: 81.7 (low, U.S. average is 100)
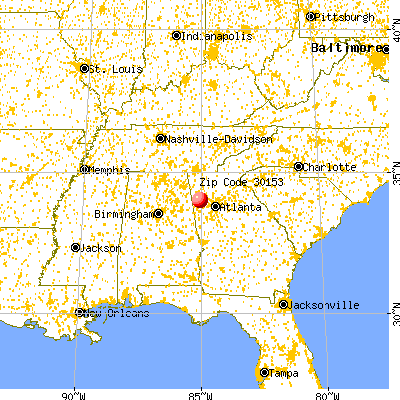
Land area: 119.1 sq. mi. Water area: 1.0 sq. mi.
Population density: 149 people per square mile
(very low).
OSM Map
General Map
Google Map
MSN Map
OSM Map
General Map
Google Map
MSN Map
OSM Map
General Map
Google Map
MSN Map
OSM Map
General Map
Google Map
MSN Map
Please wait while loading the map...
Real estate property taxes paid for housing units in 2022:
This zip code:
0.7% ($1,482)
Georgia:
0.7% ($2,160)
Median real estate property taxes paid for housing units with mortgages in 2022: $1,761 (0.8%) Median real estate property taxes paid for housing units with no mortgage in 2022: $1,139 (0.6%)
Averages for the 2020 tax year for zip code 30153, filed in 2021:
Average Adjusted Gross Income (AGI) in 2020: $49,198 (Individual Income Tax Returns)
Here:
$49,198
State:
$70,847
Salary/wage: $45,443 (reported on 85.1% of returns)
Here:
$45,443
State:
$59,126
(% of AGI for various income ranges: 1135.4% for AGIs below $25k, 3891.6% for AGIs $25k-50k, 7313.7% for AGIs $50k-75k, 9793.3% for AGIs $75k-100k, 18074.0% for AGIs $100k-200k, 70520.0% for AGIs over 200k)
Taxable interest for individuals: $844 (reported on 16.8% of returns)
This zip code:
$844
Georgia:
$2,011
(% of AGI for various income ranges: 9.6% for AGIs below $25k, 9.7% for AGIs $25k-50k, 28.4% for AGIs $50k-75k, 39.1% for AGIs $75k-100k, 49.2% for AGIs $100k-200k, 290.0% for AGIs over 200k)
Ordinary dividends: $3,361 (reported on 8.1% of returns)
Here:
$3,361
State:
$8,996
(% of AGI for various income ranges: 13.8% for AGIs below $25k, 10.1% for AGIs $25k-50k, 27.1% for AGIs $50k-75k, 64.3% for AGIs $75k-100k, 140.6% for AGIs $100k-200k, 1813.3% for AGIs over 200k)
Net capital gain/loss in AGI: +$9,669 (reported on 6.6% of returns)
Here:
+$9,669
State:
+$28,402
(% of AGI for various income ranges: 7.1% for AGIs below $25k, 9.3% for AGIs $25k-50k, 51.0% for AGIs $50k-75k, 71.6% for AGIs $75k-100k, 260.4% for AGIs $100k-200k, 10386.7% for AGIs over 200k)
Profit/loss from business: +$3,683 (reported on 16.0% of returns)
Here:
+$3,683
State:
+$6,707
(% of AGI for various income ranges: 78.9% for AGIs below $25k, 16.8% for AGIs $25k-50k, 44.1% for AGIs $50k-75k, 82.1% for AGIs $75k-100k, 287.9% for AGIs $100k-200k, 2010.0% for AGIs over 200k)
Taxable individual retirement arrangement distribution: $14,433 (reported on 5.2% of returns)
30153:
$14,433
Georgia:
$20,525
(% of AGI for various income ranges: 25.1% for AGIs below $25k, 57.1% for AGIs $25k-50k, 86.2% for AGIs $50k-75k, 148.3% for AGIs $75k-100k, 641.9% for AGIs $100k-200k)
Total itemized deductions: $26,866 (reported on 6.4% of returns)
Here:
$26,866
State:
$34,001
(% of AGI for various income ranges: 224.7% for AGIs $25k-50k, 168.9% for AGIs $50k-75k, 372.9% for AGIs $75k-100k, 1004.2% for AGIs $100k-200k, 6693.3% for AGIs over 200k)
Charity contributions: $11,247 (reported on 5.8% of returns)
Here:
$11,247
State:
$14,164
(% of AGI for various income ranges: 99.9% for AGIs $25k-50k, 43.6% for AGIs $50k-75k, 105.7% for AGIs $75k-100k, 337.7% for AGIs $100k-200k, 3656.7% for AGIs over 200k)
Taxes paid: $6,319 (reported on 5.4% of returns)
30153:
$6,319
State:
$7,540
(% of AGI for various income ranges: 16.0% for AGIs $25k-50k, 37.6% for AGIs $50k-75k, 96.2% for AGIs $75k-100k, 273.3% for AGIs $100k-200k, 1456.7% for AGIs over 200k)
Earned income credit: $2,488 (reported on 24.2% of returns)
Here:
$2,488
State:
$2,530
(% of AGI for various income ranges: 137.2% for AGIs below $25k, 90.7% for AGIs $25k-50k, 2.7% for AGIs $50k-75k)
Percentage of individuals using paid preparers for their 2020 taxes: 92.7%
Here:
93%
State:
93%
(% for various income ranges: 93.6% for AGIs below $25k, 90.3% for AGIs $25k-50k, 94.5% for AGIs $50k-75k, 93.8% for AGIs $75k-100k, 92.9% for AGIs $100k-200k, 91.7% for AGIs over 200k)
Averages for the 2012 tax year for zip code 30153, filed in 2013:
Average Adjusted Gross Income (AGI) in 2012: $40,078 (Individual Income Tax Returns)
Here:
$40,078
State:
$56,131
Salary/wage: $37,771 (reported on 84.6% of returns)
Here:
$37,771
State:
$47,942
(% of AGI for various income ranges: 71.5% for AGIs below $25k, 85.4% for AGIs $25k-50k, 83.4% for AGIs $50k-75k, 81.3% for AGIs $75k-100k, 76.5% for AGIs $100k-200k, 60.4% for AGIs over 200k)
Taxable interest for individuals: $877 (reported on 18.2% of returns)
This zip code:
$877
Georgia:
$1,706
(% of AGI for various income ranges: 0.8% for AGIs below $25k, 0.4% for AGIs $25k-50k, 0.3% for AGIs $50k-75k, 0.4% for AGIs $75k-100k, 0.2% for AGIs $100k-200k, 0.7% for AGIs over 200k)
Ordinary dividends: $2,285 (reported on 9.3% of returns)
Here:
$2,285
State:
$7,265
(% of AGI for various income ranges: 0.9% for AGIs below $25k, 0.2% for AGIs $25k-50k, 0.7% for AGIs $50k-75k, 0.5% for AGIs $75k-100k, 0.4% for AGIs $100k-200k, 1.1% for AGIs over 200k)
Net capital gain/loss in AGI: +$2,376 (reported on 6.5% of returns)
Here:
+$2,376
State:
+$16,323
(% of AGI for various income ranges: 0.3% for AGIs $25k-50k, 0.2% for AGIs $75k-100k, 1.9% for AGIs $100k-200k)
Profit/loss from business: +$5,461 (reported on 17.9% of returns)
Here:
+$5,461
State:
+$7,583
(% of AGI for various income ranges: 10.2% for AGIs below $25k, 1.3% for AGIs $25k-50k, 0.8% for AGIs $50k-75k, 0.8% for AGIs $75k-100k, 2.2% for AGIs $100k-200k)
Taxable individual retirement arrangement distribution: $12,356 (reported on 6.4% of returns)
30153:
$12,356
Georgia:
$17,199
(% of AGI for various income ranges: 1.7% for AGIs below $25k, 1.5% for AGIs $25k-50k, 2.0% for AGIs $50k-75k, 2.3% for AGIs $75k-100k, 3.0% for AGIs $100k-200k)
Total itemized deductions: $17,130 (25% of AGI, reported on 29.9% of returns)
Here:
$17,130
State:
$23,886
Here:
24.9% of AGI
State:
21.5% of AGI
(% of AGI for various income ranges: 7.3% for AGIs below $25k, 11.9% for AGIs $25k-50k, 13.9% for AGIs $50k-75k, 15.2% for AGIs $75k-100k, 15.2% for AGIs $100k-200k, 10.8% for AGIs over 200k)
Charity contributions: $3,702 (reported on 23.9% of returns)
Here:
$3,702
State:
$5,507
(% of AGI for various income ranges: 0.8% for AGIs below $25k, 1.9% for AGIs $25k-50k, 2.2% for AGIs $50k-75k, 2.9% for AGIs $75k-100k, 3.0% for AGIs $100k-200k, 2.3% for AGIs over 200k)
Taxes paid: $4,807 (reported on 29.8% of returns)
30153:
$4,807
State:
$7,838
(% of AGI for various income ranges: 1.0% for AGIs below $25k, 2.4% for AGIs $25k-50k, 3.7% for AGIs $50k-75k, 4.7% for AGIs $75k-100k, 5.6% for AGIs $100k-200k, 5.8% for AGIs over 200k)
Earned income credit: $2,535 (reported on 30.6% of returns)
Here:
$2,535
State:
$2,589
(% of AGI for various income ranges: 10.8% for AGIs below $25k, 1.8% for AGIs $25k-50k)
Percentage of individuals using paid preparers for their 2012 taxes: 58.8%
Here:
59%
State:
55%
(% for various income ranges: 57.6% for AGIs below $25k, 58.2% for AGIs $25k-50k, 59.4% for AGIs $50k-75k, 58.5% for AGIs $75k-100k, 67.5% for AGIs $100k-200k, 75.0% for AGIs over 200k)
Averages for the 2004 tax year for zip code 30153, filed in 2005:
Average Adjusted Gross Income (AGI) in 2004: $36,157 (Individual Income Tax Returns)
Here:
$36,157
State:
$47,553
Salary/wage: $34,124 (reported on 87.5% of returns)
Here:
$34,124
State:
$42,178
(% of AGI for various income ranges: 93.8% for AGIs below $10k, 79.6% for AGIs $10k-25k, 88.8% for AGIs $25k-50k, 87.4% for AGIs $50k-75k, 85.0% for AGIs $75k-100k, 61.8% for AGIs over 100k)
Taxable interest for individuals: $1,452 (reported on 27.7% of returns)
This zip code:
$1,452
Georgia:
$1,772
(% of AGI for various income ranges: 3.4% for AGIs below $10k, 1.7% for AGIs $10k-25k, 0.8% for AGIs $25k-50k, 0.6% for AGIs $50k-75k, 1.0% for AGIs $75k-100k, 1.8% for AGIs over 100k)
Taxable dividends: $2,693 (reported on 13.1% of returns)
Here:
$2,693
State:
$4,283
(% of AGI for various income ranges: 2.7% for AGIs below $10k, 0.6% for AGIs $10k-25k, 0.4% for AGIs $25k-50k, 0.7% for AGIs $50k-75k, 0.9% for AGIs $75k-100k, 2.7% for AGIs over 100k)
Net capital gain/loss: +$8,852 (reported on 8.5% of returns)
Here:
+$8,852
State:
+$16,461
(% of AGI for various income ranges: -0.4% for AGIs below $10k, 0.3% for AGIs $10k-25k, 0.6% for AGIs $25k-50k, 0.7% for AGIs $50k-75k, 1.8% for AGIs $75k-100k, 9.2% for AGIs over 100k)
Profit/loss from business: +$7,045 (reported on 14.2% of returns)
Here:
+$7,045
State:
+$8,201
(% of AGI for various income ranges: 7.1% for AGIs below $10k, 5.8% for AGIs $10k-25k, 2.1% for AGIs $25k-50k, 1.5% for AGIs $50k-75k, 0.4% for AGIs $75k-100k, 5.4% for AGIs over 100k)
IRA payment deduction: $3,000 (reported on 1.2% of returns)
30153:
$3,000
Georgia:
$2,969
(% of AGI for various income ranges: 0.3% for AGIs below $10k, 0.1% for AGIs $25k-50k, 0.2% for AGIs $50k-75k, 0.1% for AGIs over 100k)
Total itemized deductions: $15,016 (25% of AGI, reported on 32.4% of returns)
Here:
$15,016
State:
$19,944
Here:
24.6% of AGI
State:
22.6% of AGI
(% of AGI for various income ranges: 8.0% for AGIs below $10k, 8.3% for AGIs $10k-25k, 12.9% for AGIs $25k-50k, 15.0% for AGIs $50k-75k, 16.1% for AGIs $75k-100k, 14.2% for AGIs over 100k)
Charity contributions deductions: $3,027 (5% of AGI, reported on 26.9% of returns)
Here:
$3,027
State:
$4,354
Here:
4.7% of AGI
State:
4.7% of AGI
(% of AGI for various income ranges: 0.6% for AGIs below $10k, 1.0% for AGIs $10k-25k, 1.8% for AGIs $25k-50k, 2.3% for AGIs $50k-75k, 2.7% for AGIs $75k-100k, 3.8% for AGIs over 100k)
Total tax: $4,212 (reported on 70.4% of returns)
30153:
$4,212
State:
$8,223
(% of AGI for various income ranges: 3.1% for AGIs below $10k, 3.6% for AGIs $10k-25k, 5.7% for AGIs $25k-50k, 8.0% for AGIs $50k-75k, 10.0% for AGIs $75k-100k, 16.0% for AGIs over 100k)
Earned income credit: $1,830 (reported on 23.5% of returns)
Here:
$1,830
State:
$1,986
Percentage of individuals using paid preparers for their 2004 taxes: 66.1%
Here:
66%
State:
62%
(% for various income ranges: 59.7% for AGIs below $10k, 68.3% for AGIs $10k-25k, 66.8% for AGIs $25k-50k, 65.6% for AGIs $50k-75k, 67.1% for AGIs $75k-100k, 77.7% for AGIs over 100k)
Household received Food Stamps/SNAP in the past 12 months: 1,207 Household did not receive Food Stamps/SNAP in the past 12 months: 5,223
Women who had a birth in the past 12 months: 172 (58 now married, 113 unmarried) Women who did not have a birth in the past 12 months: 3,820 (1,958 now married, 1,858 unmarried)
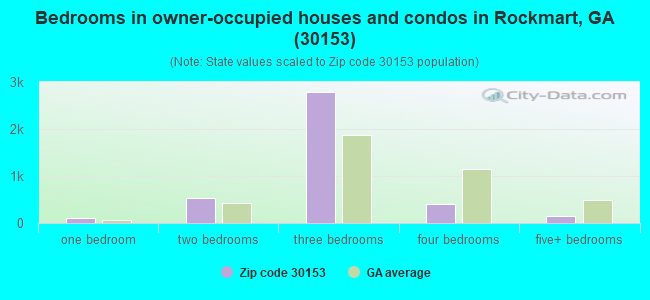
Housing units in zip code 30153 with a mortgage: 2,237 (97 second mortgage, 102 both second mortgage and home equity loan) Median monthly owner costs for units with a mortgage: $1,335 Median monthly owner costs for units without a mortgage: $441
Residents with income below the poverty level in 2022:
This zip code:
14.5%
Whole state:
12.7%
Residents with income below 50% of the poverty level in 2022:
This zip code:
6.6%
Whole state:
6.3%
Median number of rooms in houses and condos:
Here:
5.7
State:
6.8
Median number of rooms in apartments:
Here:
5.1
State:
4.6
Notable locations in this zip code not listed on our city pages
Notable locations in zip code 30153: Camp Shepherd (A), Beatty Switch (B), Rockmart Fire Department (C), Polk County Volunteer Fire Department Antioch Station (D), Polk County Volunteer Fire Department Vinson Mountain Station (E), Paulding County Fire and Rescue Bureau Station 7 (F). Display/hide their locations on the map
Churches in zip code 30153 include: Bellview African Methodist Episcopal Church (A), Yorkville United Methodist Church (B), First Baptist Church of Rockmart (C), Piedmont Avenue Baptist Church (D), Second Baptist Church of Rockmart (E), Springdale Church (F), Van Wert Church (G), Euharlee Church (H), Beulah Land Baptist Church (I). Display/hide their locations on the map
Cemeteries: Rockmart Memorial Gardens (1), Rose Hill Cemetery (2), Saint Johns Cemetery (3), Maple Springs Cemetery (4), Yorkville Cemetery (5), Ezell B Garner Cemetery (6), Beulah Cemetery (7). Display/hide their locations on the map
Reservoirs: Becks Lake (A), Camp Shepherd Lake (B), Coots Lake (C), Crawford Lake (D), Dorene Lake (E), Eubank Lake (F), Forsyth Lake (G), Hightower Lake (H). Display/hide their locations on the map
Streams, rivers, and creeks: White Creek (A), Thompson Creek (B), Thomasson Creek (C), Swinney Branch (D), Hutchings Creek (E), Simpson Creek (F), Fish Creek (G), Caney Branch (H), Rabbit Branch (I). Display/hide their locations on the map
In group quarters: 3 (-1 institutionalized population)
Size of family households: 1,744 2-persons, 999 3-persons, 869 4-persons, 533 5-persons, 110 6-persons, 290 7-or-more-persons
Size of nonfamily households: 1,531 1-person, 325 2-persons
2,589 married couples with children.
819 single-parent households (87 men, 732 women).
96.7% of residents of 30153 zip code speak English at home.
0.9% of residents speak Spanish at home (87% very well, 13% not at all).
1.1% of residents speak other Indo-European language at home (99% very well, 1% well).
0.8% of residents speak Asian or Pacific Island language at home (100% well).
0.2% of residents speak other language at home (100% very well).
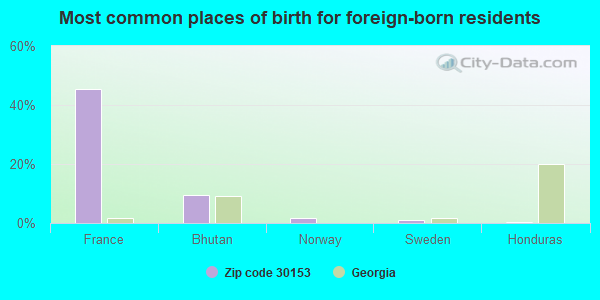
Foreign born population: 446 (2.5%) (35.1% of them are naturalized citizens)
This zip code:
2.5%
Whole state:
10.7%
46%France
10%Bhutan
2%Norway
1%Sweden
0%Honduras
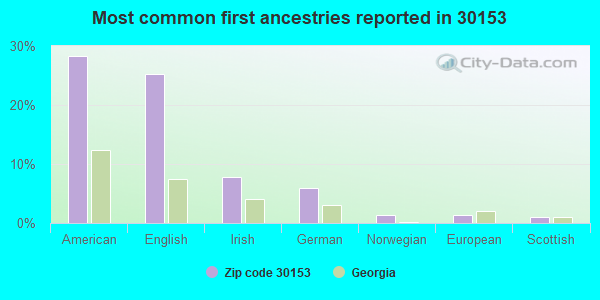
28%American
25%English
8%Irish
6%German
1%Norwegian
1%European
1%Scottish
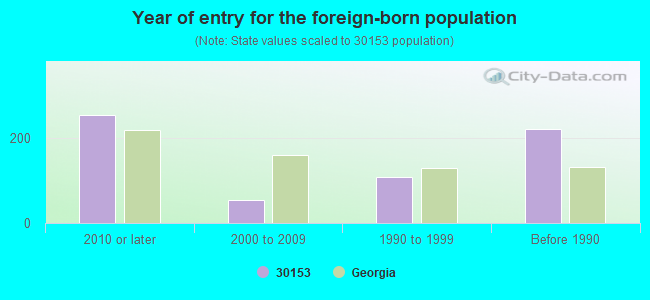
Year of entry for the foreign-born population
2542010 or later
552000 to 2009
1091990 to 1999
221Before 1990
Major facilities with environmental interests located in this zip code:
LONG LEAF INDUSTRIES (898 NATHAN DEAN BYPASS in ROCKMART, GA)
AIR MINOR (AIRS/AFS) (Integrated Compliance Information System) - ICIS-04-2001-0075, FORMAL ENFORCEMENT ACTION (Resource Conservation and Recovery Act (tracking hazardous waste)) Business SIC classification: PERFUMES, COSMETICS, AND OTHER TOILET PREPARATIONS; INDUSTRIAL ORGANIC CHEMICALS Organizations: LONNIE HUGH POPE JR (CONTACT/OWNER)
Alternative names: RENASCENS LLC
MURATA ELECTRONICS NORTH AMERICA INC (308 PROSPECT RD in ROCKMART, GA)
AIR MINOR (AIRS/AFS) (Resource Conservation and Recovery Act (tracking hazardous waste)) TRI REPORTER (Tracking of toxic chemicals releasing facilities) Business SIC classification: ELECTRONIC CAPACITORS Business NAICS classification: ELECTRONIC CAPACITOR MANUFACTURING.; OTHER ELECTRONIC COMPONENT MANUFACTURING. Organizations: OPERNAME (CONTACT/OPERATOR)
, MURATA ELRIE (CONTACT/OWNER)
Alternative names: MURATA CORPORATION OF AMERICA, MURATA ELECTRONICS N.A. INC.
EUHARLEE KINDERGARTEN (120 GORDON STREET in ROCKMART, GA)
(National Center for Education Statistics) - STATE ID-0191 Organizations: POLK COUNTY (SCHOOL DISTRICT)
CITY BODY WORKS INC (16 PROSPECT RD in ROCKMART, GA)
(Resource Conservation and Recovery Act (tracking hazardous waste)) Organizations: OPERNAME (CONTACT/OPERATOR)
, PRUITT HENRY (CONTACT/OWNER)
, WALTER ZUKER (CONTACT/OWNER)
BRACKETT DRY CLEANERS (114 N MARBLE ST in ROCKMART, GA)
CAGLE'S FARMS INC. (1750 ROME HIGHWAY in ROCKMART, GA)
AIR MINOR (AIRS/AFS) TRI REPORTER (Tracking of toxic chemicals releasing facilities) Business SIC classification: PREPARED FEEDS AND FEED INGREDIENTS FOR ANIMALS AND FOWLS, EXCEPT DOGS AND CATS Alternative names: CAGLES INCORPORATED
PATAT PLYWOOD CORP (INDUSTRIAL BLVD in ROCKMART, GA)
AIR MINOR (AIRS/AFS) Business SIC classification: SOFTWOOD VENEER AND PLYWOOD
ANGELICA TEXTILE SERV (1061 MARQUETTE ROAD in ROCKMART, GA)
AIR MINOR (AIRS/AFS) Business SIC classification: LINEN SUPPLY
BEST MANUFACTURING CO (ROCKMART IND PK in ROCKMART, GA)
AIR MINOR (AIRS/AFS) Business SIC classification: DRESS AND WORK GLOVES, EXCEPT KNIT AND ALL-LEATHER
CHATTAHOOCHEE BRICK C (LOADING STATION in ROCKMART, GA)
AIR MINOR (AIRS/AFS) Business SIC classification: BRICK AND STRUCTURAL CLAY TILE Alternative names: CHATTAHOOCHEE BRICK CO
RGM OF GEORGIA LTD (25 INDUSTRIAL DRIVE in ROCKMART, GA)
AIR MINOR (AIRS/AFS) Business SIC classification: INDUSTRIAL INORGANIC CHEMICALS
ALLSTATE ASPHALT (NATHAN DEAN BYPASS in ROCKMART, GA)
AIR SYNTHETIC MINOR (AIRS/AFS) Business SIC classification: ASPHALT PAVING MIXTURES AND BLOCKS
Housing units lacking complete plumbing facilities: 3.6% Housing units lacking complete kitchen facilities: 4.5%
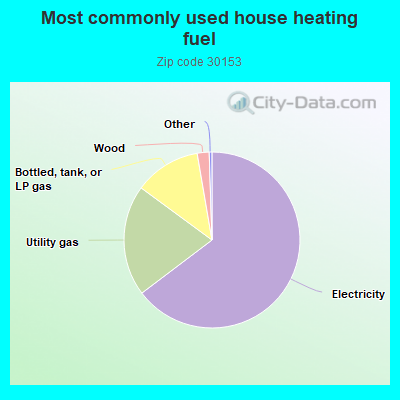
64.7%Electricity
20.4%Utility gas
12.2%Bottled, tank, or LP gas
2.2%Wood
Population in 1990: 8,946. Population change in the 1990s: +5,625 (+62.9%).
Place of birth for U.S.-born residents:
This state: 13,226
Northeast: 222
Midwest: 729
South: 2,241
West: 604
59% of the 30153 zip code residents lived in the same house 5 years ago. Out of people who lived in different houses, 60% lived in this county. Out of people who lived in different counties, 50% lived in Georgia.
88% of the 30153 zip code residents lived in the same house 1 year ago. Out of people who lived in different houses, 43% moved from this county. Out of people who lived in different houses, 43% moved from different county within same state. Out of people who lived in different houses, 11% moved from different state.
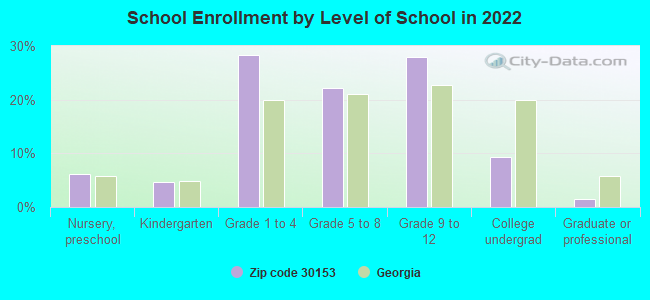
Private vs. public school enrollment:
Students in private schools in grades 1 to 8 (elementary and middle school): 195
Here:
9.6%
Georgia:
12.1%
Students in private schools in grades 9 to 12 (high school): 130
Here:
11.7%
Georgia:
10.8%
Students in private undergraduate colleges: 33
Here:
8.9%
Georgia:
17.1%
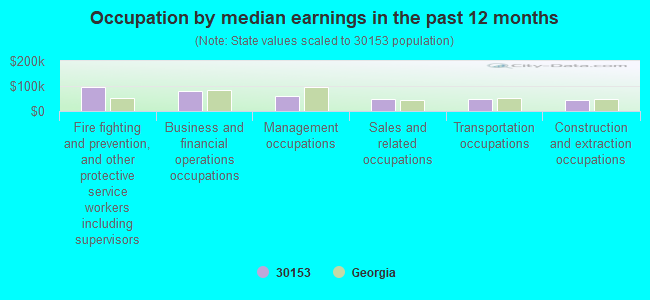
Occupation by median earnings in the past 12 months ($)
96,606Fire fighting and prevention, and other protective service workers including supervisors
80,178Business and financial operations occupations
58,438Management occupations
46,957Sales and related occupations
46,558Transportation occupations
45,224Construction and extraction occupations
Companies with federal contracts located in this zip code:
ENGINEERED FABRICS CORPORATION (669 GOODYEAR ST in ROCKMART, GA; small business) : $92,492,141 in 326 contractsfrom 1999 to 2006
Contracts for Airframe Structural Components, Aircraft Hydraulic, Vacuum, and De-icing System Components, Power and Hand Pumps, Packing and Gasket Materials, and moreby Navy, Defense Logistics Agency, Army, Air Force, and others Signed by year:2000: $11,591,646; 2001: $6,468,182; 2002: $13,005,594; 2003: $9,282,574; 2004: $15,755,541; 2005: $18,799,210; 2006: $8,719,732.
Biggest contracts:
$2,890,134 with Navy for Airframe Structural Components. Signed on 1999-10-29. Completion date: 2000-10-30.
$2,455,475, same as above.Signed on 1999-11-23. Completion date: 2000-03-22.
$2,371,660 with Defense Logistics Agency for Airframe Structural Components. Signed on 2005-08-25. Completion date: 2006-06-21.
$2,303,040, same as above.Signed on 2004-08-13. Completion date: 2005-05-30.
Top industries in this zip code by the number of employees in 2005:
Other Services (except Public Administration): Industrial Launderers (250-499 employees: 1 establishment)
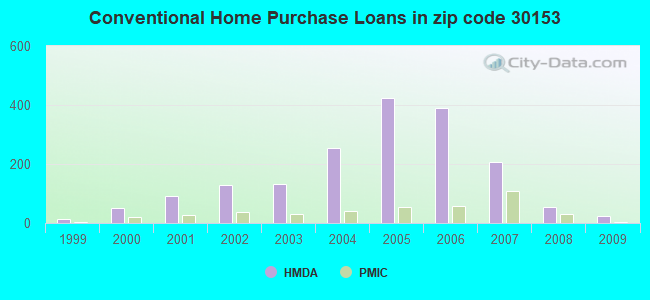
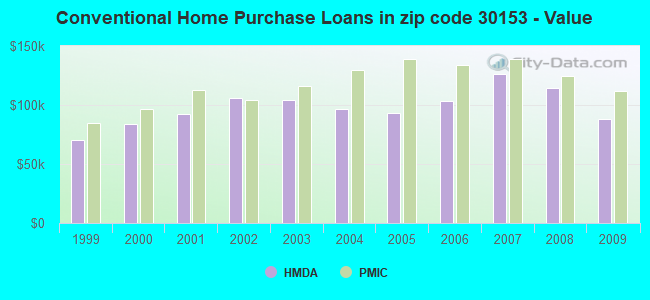
Detailed PMIC statistics for the following Tracts:1204.00
2002 - 2018 National Fire Incident Reporting System (NFIRS) incidents
Based on the data from the years 2002 - 2018 the average number of fire incidents per year is 101. The highest number of fire incidents - 177 took place in 2016, and the least - 11 in 2002. The data has an increasing trend.
When looking into fire subcategories, the most reports belonged to: Outside Fires (44.7%), and Structure Fires (38.1%).
Fire incident types reported to NFIRS in Zip Code 30153


 Nearest zip codes: 30104, 30178, 30179, 30113, 30157, 30132.


 Based on the data from the years 2002 - 2018 the average number of fire incidents per year is 101. The highest number of fire incidents - 177 took place in 2016, and the least - 11 in 2002. The data has an increasing trend.
 When looking into fire subcategories, the most reports belonged to: Outside Fires (44.7%), and Structure Fires (38.1%).