Estimated zip code population in 2022: 32,042 Zip code population in 2010: 28,913 Zip code population in 2000: 21,948
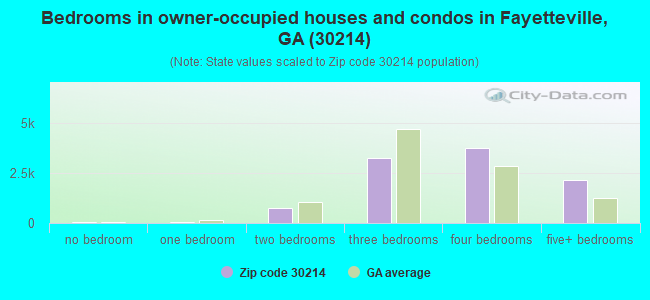
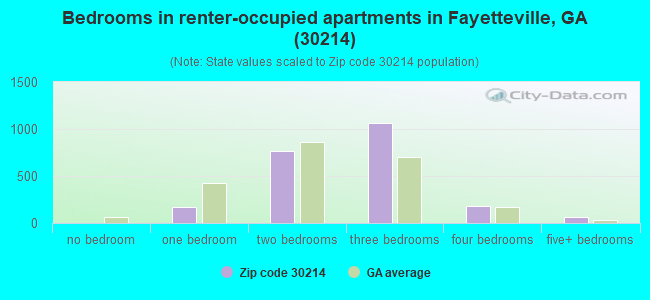
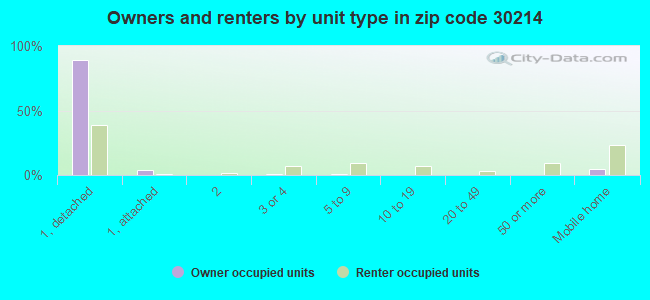
Houses and condos: 12,738 Renter-occupied apartments: 2,258
% of renters here:
19%
State:
34%
March 2022 cost of living index in zip code 30214: 102.4 (near average, U.S. average is 100)
Land area: 52.7 sq. mi. Water area: 1.2 sq. mi.
Population density: 608 people per square mile
(low).
OSM Map
General Map
Google Map
MSN Map
OSM Map
General Map
Google Map
MSN Map
OSM Map
General Map
Google Map
MSN Map
OSM Map
General Map
Google Map
MSN Map
Please wait while loading the map...
Real estate property taxes paid for housing units in 2022:
This zip code:
0.6% ($2,244)
Georgia:
0.7% ($2,160)
Median real estate property taxes paid for housing units with mortgages in 2022: $2,475 (0.7%) Median real estate property taxes paid for housing units with no mortgage in 2022: $1,502 (0.4%)
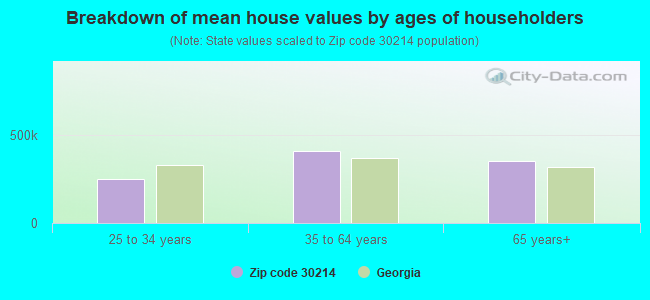
Estimated median house/condo value in 2022: $368,515
30214:
$368,515
Georgia:
$297,400
According to our research of Georgia and other state lists, there were 40 registered sex offenders living in 30214 zip code as of April 27, 2024. The ratio of all residents to sex offenders in zip code 30214 is 746 to 1. The ratio of registered sex offenders to all residents in this zip code is lower than the state average.
Median resident age:
This zip code:
42.5 years
Georgia median age:
37.6 years
Average household size:
This zip code:
2.6 people
Georgia:
2.6 people
Averages for the 2020 tax year for zip code 30214, filed in 2021:
Average Adjusted Gross Income (AGI) in 2020: $77,616 (Individual Income Tax Returns)
Here:
$77,616
State:
$70,847
Salary/wage: $58,329 (reported on 75.9% of returns)
Here:
$58,329
State:
$59,126
(% of AGI for various income ranges: 1114.9% for AGIs below $25k, 3540.8% for AGIs $25k-50k, 6392.2% for AGIs $50k-75k, 9422.2% for AGIs $75k-100k, 18578.9% for AGIs $100k-200k, 71632.6% for AGIs over 200k)
Taxable interest for individuals: $1,410 (reported on 28.5% of returns)
This zip code:
$1,410
Georgia:
$2,011
(% of AGI for various income ranges: 15.3% for AGIs below $25k, 26.1% for AGIs $25k-50k, 47.7% for AGIs $50k-75k, 79.3% for AGIs $75k-100k, 125.8% for AGIs $100k-200k, 969.6% for AGIs over 200k)
Ordinary dividends: $6,906 (reported on 17.8% of returns)
Here:
$6,906
State:
$8,996
(% of AGI for various income ranges: 15.8% for AGIs below $25k, 38.3% for AGIs $25k-50k, 84.2% for AGIs $50k-75k, 160.6% for AGIs $75k-100k, 317.9% for AGIs $100k-200k, 5118.7% for AGIs over 200k)
Net capital gain/loss in AGI: +$23,944 (reported on 15.8% of returns)
Here:
+$23,944
State:
+$28,402
(% of AGI for various income ranges: 5.6% for AGIs below $25k, 26.2% for AGIs $25k-50k, 77.0% for AGIs $50k-75k, 206.8% for AGIs $75k-100k, 710.5% for AGIs $100k-200k, 21410.4% for AGIs over 200k)
Profit/loss from business: +$3,778 (reported on 26.4% of returns)
Here:
+$3,778
State:
+$6,707
(% of AGI for various income ranges: 114.7% for AGIs below $25k, 57.5% for AGIs $25k-50k, 96.4% for AGIs $50k-75k, 210.2% for AGIs $75k-100k, 234.1% for AGIs $100k-200k, 1734.8% for AGIs over 200k)
Taxable individual retirement arrangement distribution: $18,571 (reported on 9.6% of returns)
30214:
$18,571
Georgia:
$20,525
(% of AGI for various income ranges: 46.2% for AGIs below $25k, 88.8% for AGIs $25k-50k, 226.1% for AGIs $50k-75k, 443.9% for AGIs $75k-100k, 861.1% for AGIs $100k-200k, 2904.8% for AGIs over 200k)
Self-employed (Keogh) retirement plans: $23,025 (reported on 0.2% of returns)
30214:
$23,025
Georgia:
$27,751
(% of AGI for various income ranges: 11.7% for AGIs $50k-75k, 319.1% for AGIs over 200k)
Total itemized deductions: $33,760 (reported on 16.5% of returns)
Here:
$33,760
State:
$34,001
(% of AGI for various income ranges: 79.1% for AGIs below $25k, 270.3% for AGIs $25k-50k, 707.9% for AGIs $50k-75k, 1228.8% for AGIs $75k-100k, 2396.6% for AGIs $100k-200k, 12443.0% for AGIs over 200k)
Charity contributions: $15,310 (reported on 14.9% of returns)
Here:
$15,310
State:
$14,164
(% of AGI for various income ranges: 9.9% for AGIs below $25k, 63.0% for AGIs $25k-50k, 193.7% for AGIs $50k-75k, 376.9% for AGIs $75k-100k, 877.4% for AGIs $100k-200k, 7727.8% for AGIs over 200k)
Taxes paid: $6,950 (reported on 16.4% of returns)
30214:
$6,950
State:
$7,540
(% of AGI for various income ranges: 11.4% for AGIs below $25k, 45.5% for AGIs $25k-50k, 150.9% for AGIs $50k-75k, 305.5% for AGIs $75k-100k, 628.4% for AGIs $100k-200k, 1782.6% for AGIs over 200k)
Earned income credit: $2,374 (reported on 17.4% of returns)
Here:
$2,374
State:
$2,530
(% of AGI for various income ranges: 114.6% for AGIs below $25k, 81.1% for AGIs $25k-50k, 1.3% for AGIs $50k-75k)
Percentage of individuals using paid preparers for their 2020 taxes: 91.0%
Here:
91%
State:
93%
(% for various income ranges: 90.5% for AGIs below $25k, 91.6% for AGIs $25k-50k, 91.7% for AGIs $50k-75k, 89.9% for AGIs $75k-100k, 90.6% for AGIs $100k-200k, 91.9% for AGIs over 200k)
Averages for the 2012 tax year for zip code 30214, filed in 2013:
Average Adjusted Gross Income (AGI) in 2012: $59,834 (Individual Income Tax Returns)
Here:
$59,834
State:
$56,131
Salary/wage: $49,830 (reported on 79.8% of returns)
Here:
$49,830
State:
$47,942
(% of AGI for various income ranges: 73.5% for AGIs below $25k, 73.6% for AGIs $25k-50k, 70.7% for AGIs $50k-75k, 68.5% for AGIs $75k-100k, 70.7% for AGIs $100k-200k, 48.0% for AGIs over 200k)
Taxable interest for individuals: $1,348 (reported on 34.9% of returns)
This zip code:
$1,348
Georgia:
$1,706
(% of AGI for various income ranges: 1.3% for AGIs below $25k, 0.8% for AGIs $25k-50k, 0.9% for AGIs $50k-75k, 0.8% for AGIs $75k-100k, 0.6% for AGIs $100k-200k, 0.8% for AGIs over 200k)
Ordinary dividends: $4,203 (reported on 19.6% of returns)
Here:
$4,203
State:
$7,265
(% of AGI for various income ranges: 1.2% for AGIs below $25k, 1.0% for AGIs $25k-50k, 1.5% for AGIs $50k-75k, 1.1% for AGIs $75k-100k, 1.1% for AGIs $100k-200k, 2.2% for AGIs over 200k)
Net capital gain/loss in AGI: +$5,507 (reported on 14.8% of returns)
Here:
+$5,507
State:
+$16,323
(% of AGI for various income ranges: 0.1% for AGIs $25k-50k, 0.2% for AGIs $50k-75k, 0.8% for AGIs $75k-100k, 0.8% for AGIs $100k-200k, 4.8% for AGIs over 200k)
Profit/loss from business: +$5,533 (reported on 21.1% of returns)
Here:
+$5,533
State:
+$7,583
(% of AGI for various income ranges: 8.5% for AGIs below $25k, 0.6% for AGIs $25k-50k, 1.2% for AGIs $50k-75k, 1.3% for AGIs $75k-100k, 1.1% for AGIs $100k-200k, 2.6% for AGIs over 200k)
Taxable individual retirement arrangement distribution: $14,075 (reported on 12.4% of returns)
30214:
$14,075
Georgia:
$17,199
(% of AGI for various income ranges: 2.9% for AGIs below $25k, 2.8% for AGIs $25k-50k, 3.3% for AGIs $50k-75k, 3.0% for AGIs $75k-100k, 3.5% for AGIs $100k-200k, 1.9% for AGIs over 200k)
Self-employment retirement plans: $11,720 (reported on 0.4% of returns)
30214:
$11,720
Georgia:
$23,277
Total itemized deductions: $24,102 (24% of AGI, reported on 44.8% of returns)
Here:
$24,102
State:
$23,886
Here:
24.4% of AGI
State:
21.5% of AGI
(% of AGI for various income ranges: 15.6% for AGIs below $25k, 17.8% for AGIs $25k-50k, 21.5% for AGIs $50k-75k, 20.3% for AGIs $75k-100k, 18.6% for AGIs $100k-200k, 14.2% for AGIs over 200k)
Charity contributions: $6,372 (reported on 39.7% of returns)
Here:
$6,372
State:
$5,507
(% of AGI for various income ranges: 2.1% for AGIs below $25k, 3.2% for AGIs $25k-50k, 4.1% for AGIs $50k-75k, 4.6% for AGIs $75k-100k, 4.6% for AGIs $100k-200k, 5.0% for AGIs over 200k)
Taxes paid: $6,631 (reported on 44.4% of returns)
30214:
$6,631
State:
$7,838
(% of AGI for various income ranges: 2.1% for AGIs below $25k, 3.3% for AGIs $25k-50k, 4.7% for AGIs $50k-75k, 5.3% for AGIs $75k-100k, 5.8% for AGIs $100k-200k, 5.6% for AGIs over 200k)
Earned income credit: $2,462 (reported on 17.3% of returns)
Here:
$2,462
State:
$2,589
(% of AGI for various income ranges: 7.3% for AGIs below $25k, 1.0% for AGIs $25k-50k)
Percentage of individuals using paid preparers for their 2012 taxes: 55.4%
Here:
55%
State:
55%
(% for various income ranges: 52.5% for AGIs below $25k, 53.5% for AGIs $25k-50k, 58.5% for AGIs $50k-75k, 58.1% for AGIs $75k-100k, 58.1% for AGIs $100k-200k, 73.7% for AGIs over 200k)
Averages for the 2004 tax year for zip code 30214, filed in 2005:
Average Adjusted Gross Income (AGI) in 2004: $56,717 (Individual Income Tax Returns)
Here:
$56,717
State:
$47,553
Salary/wage: $50,148 (reported on 81.7% of returns)
Here:
$50,148
State:
$42,178
(% of AGI for various income ranges: 273.1% for AGIs below $10k, 69.4% for AGIs $10k-25k, 75.3% for AGIs $25k-50k, 74.3% for AGIs $50k-75k, 79.5% for AGIs $75k-100k, 65.9% for AGIs over 100k)
Taxable interest for individuals: $2,020 (reported on 54.0% of returns)
This zip code:
$2,020
Georgia:
$1,772
(% of AGI for various income ranges: 18.4% for AGIs below $10k, 4.0% for AGIs $10k-25k, 2.3% for AGIs $25k-50k, 1.7% for AGIs $50k-75k, 1.2% for AGIs $75k-100k, 1.7% for AGIs over 100k)
Taxable dividends: $2,562 (reported on 29.6% of returns)
Here:
$2,562
State:
$4,283
(% of AGI for various income ranges: 8.3% for AGIs below $10k, 2.0% for AGIs $10k-25k, 1.0% for AGIs $25k-50k, 1.2% for AGIs $50k-75k, 1.0% for AGIs $75k-100k, 1.5% for AGIs over 100k)
Net capital gain/loss: +$11,362 (reported on 22.3% of returns)
Here:
+$11,362
State:
+$16,461
(% of AGI for various income ranges: 7.2% for AGIs below $10k, 0.6% for AGIs $10k-25k, 0.4% for AGIs $25k-50k, 0.6% for AGIs $50k-75k, 0.8% for AGIs $75k-100k, 8.8% for AGIs over 100k)
Profit/loss from business: +$7,968 (reported on 17.9% of returns)
Here:
+$7,968
State:
+$8,201
(% of AGI for various income ranges: 11.4% for AGIs below $10k, 5.2% for AGIs $10k-25k, 2.1% for AGIs $25k-50k, 2.1% for AGIs $50k-75k, 1.2% for AGIs $75k-100k, 2.9% for AGIs over 100k)
IRA payment deduction: $3,286 (reported on 2.9% of returns)
30214:
$3,286
Georgia:
$2,969
(% of AGI for various income ranges: 0.2% for AGIs $10k-25k, 0.3% for AGIs $25k-50k, 0.2% for AGIs $50k-75k, 0.2% for AGIs $75k-100k, 0.1% for AGIs over 100k)
Self-employed pension: $11,545 (reported on 0.7% of returns)
Here:
$11,545
Georgia:
$16,203
(% of AGI for various income ranges: 0.1% for AGIs $25k-50k, 0.1% for AGIs $50k-75k, 0.1% for AGIs $75k-100k, 0.2% for AGIs over 100k)
Total itemized deductions: $21,776 (25% of AGI, reported on 52.5% of returns)
Here:
$21,776
State:
$19,944
Here:
24.9% of AGI
State:
22.6% of AGI
(% of AGI for various income ranges: 51.9% for AGIs below $10k, 20.8% for AGIs $10k-25k, 22.1% for AGIs $25k-50k, 22.7% for AGIs $50k-75k, 21.7% for AGIs $75k-100k, 17.7% for AGIs over 100k)
Charity contributions deductions: $4,896 (5% of AGI, reported on 48.3% of returns)
Here:
$4,896
State:
$4,354
Here:
5.5% of AGI
State:
4.7% of AGI
(% of AGI for various income ranges: 4.5% for AGIs below $10k, 3.0% for AGIs $10k-25k, 3.9% for AGIs $25k-50k, 4.6% for AGIs $50k-75k, 4.7% for AGIs $75k-100k, 4.0% for AGIs over 100k)
Total tax: $8,687 (reported on 77.8% of returns)
30214:
$8,687
State:
$8,223
(% of AGI for various income ranges: 8.7% for AGIs below $10k, 4.0% for AGIs $10k-25k, 6.4% for AGIs $25k-50k, 8.3% for AGIs $50k-75k, 9.7% for AGIs $75k-100k, 16.6% for AGIs over 100k)
Earned income credit: $1,754 (reported on 10.1% of returns)
Here:
$1,754
State:
$1,986
Percentage of individuals using paid preparers for their 2004 taxes: 57.5%
Here:
58%
State:
62%
(% for various income ranges: 46.0% for AGIs below $10k, 59.9% for AGIs $10k-25k, 60.7% for AGIs $25k-50k, 62.7% for AGIs $50k-75k, 55.7% for AGIs $75k-100k, 61.1% for AGIs over 100k)
Likely homosexual households (counted as self-reported same-sex unmarried-partner households)
Lesbian couples: 0.2% of all households
Gay men: 0.0% of all households
Household received Food Stamps/SNAP in the past 12 months: 1,344 Household did not receive Food Stamps/SNAP in the past 12 months: 10,756
Women who had a birth in the past 12 months: 571 (244 now married, 325 unmarried) Women who did not have a birth in the past 12 months: 7,040 (2,234 now married, 4,810 unmarried)
Housing units in zip code 30214 with a mortgage: 6,784 (438 second mortgage, 15 home equity loan, 280 both second mortgage and home equity loan) Houses without a mortgage: 30
Median monthly owner costs for units with a mortgage: $1,811 Median monthly owner costs for units without a mortgage: $506
Residents with income below the poverty level in 2022:
This zip code:
6.2%
Whole state:
12.7%
Residents with income below 50% of the poverty level in 2022:
This zip code:
2.5%
Whole state:
6.3%
Median number of rooms in houses and condos:
Here:
7.9
State:
6.8
Median number of rooms in apartments:
Here:
5.1
State:
4.6
Notable locations in this zip code not listed on our city pages
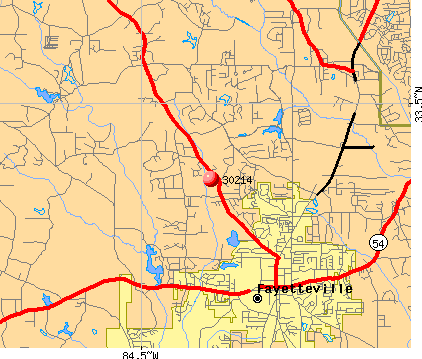
Notable locations in zip code 30214: Fayetteville Fire Department Station 92 (A), Fayetteville Police Station (B), Fayetteville Fire Department Station 91 Headquarters (C), Fayette County Fire and Emergency Services Station 4 (D), Fayette County Headquarters Police Station (E), Fayette County Fire and Emergency Services Station 2 (F), Fayette County Fire and Emergency Services Station 1 (G), Fayette County Fire and Emergency Services Station 8 (H), Fayetteville City Hall (I), Fayette County Library (J), Fayette County Jail (K), Fayette County Courthouse (L), Lafayette Nursing and Rehabilitation Center (M). Display/hide their locations on the map
Shopping Centers: Hudson Plaza Shopping Center (1), Fayette Eightyfive Shopping Center (2), Banks Crossing Shopping Center (3), J and R Plaza Shopping Center (4), Banks Station Shopping Center (5), Fayette Pavillion Shopping Center (6), Fayetteville Corners Shopping Center (7), Glynn Hood Plaza Shopping Center (8). Display/hide their locations on the map
Churches in zip code 30214 include: Calvary Church (A), Flat Creek Church (B), Flint Ridge Church (C), Deliverance Tabernacle of Praise (D), Friendship Church (E), Hopeful Church (F), North Fayette Baptist Church (G), Green Tree Baptist Church (H), Mount Olive Church (I). Display/hide their locations on the map
Cemeteries: Bethany Cemetery (1), Bethel Cemetery (2), Fayetteville City Cemetery (3), Flat Creek Cemetery (4), Flint Ridge Cemetery (5), Friendship Cemetery (6), Hopeful Cemetery (7). Display/hide their locations on the map
Lakes and reservoirs: Kites Lake (A), Arnall Lake (B), Lake Bennett (C), Lake Fayette (D), Lees Lake (E), McClenney Lake (F), Neelys Lake (G), Phillips Lake (H). Display/hide their locations on the map
3,254 married couples with children.
1,701 single-parent households (388 men, 1,313 women).
85.6% of residents of 30214 zip code speak English at home.
8.4% of residents speak Spanish at home (62% very well, 22% well, 12% not well, 5% not at all).
2.1% of residents speak other Indo-European language at home (75% very well, 9% well, 7% not well, 8% not at all).
2.2% of residents speak Asian or Pacific Island language at home (74% very well, 17% well, 9% not well).
2.0% of residents speak other language at home (96% very well, 2% well, 2% not well).
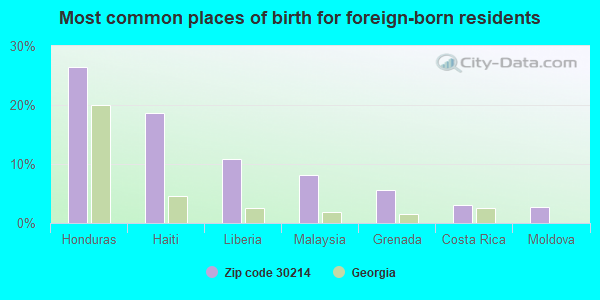
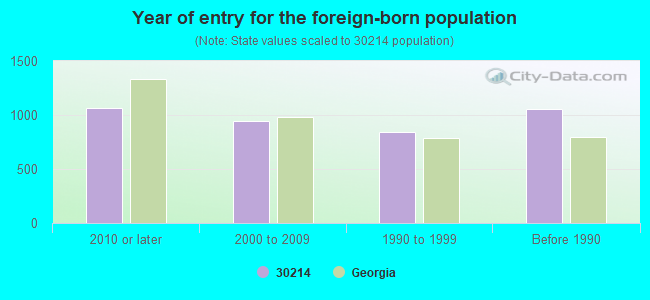
Foreign born population: 3,524 (11.0%) (52.9% of them are naturalized citizens)
Major facilities with environmental interests located in this zip code:
CITY OF FAYETTEVILLE WATER & WASTEWATER FACILITIES (332 1ST MANASASS MILE ROAD in FAYETTEVILLE, GA)
STATE MASTER (Georgia's Geographic Environmental Information) - UST-1, UNDERGROUND STORAGE TANK PROGRAM, UST-2, National Pollutant Discharge Elimination System MAJOR (Tracking pollutant discharge elimination systems) - permit Business SIC classification: SEWERAGE SYSTEMS Alternative names: FAYETTEVILLE-WHITEWTER CR WPCP
FAYETTE CNTY SCHOOL DISTRICT (210 STONEWALL AVE in FAYETTEVILLE, GA)
STATE MASTER (Georgia's Geographic Environmental Information) - UST-3, UNDERGROUND STORAGE TANK PROGRAM, UST-L213207, UST-N/A, UST-1, UST-2, UST-L213239, COMPLIANCE ACTIVITY (Tracking inspections of insecticide, fungicide, and rodenticide, and toxic substances) Organizations: FAYETTE COUNTY BOARD OF EDUCATIO (CONTACT/OPERATOR)
Alternative names: FAYETTE COUNTY BOARD OF EDUCATIO
ALLIED READY MIX (574 HIGHWAY 314 in FAYETTEVILLE, GA)
AIR SYNTHETIC MINOR (AIRS/AFS) STATE MASTER (Georgia's Geographic Environmental Information) - UST-1, UNDERGROUND STORAGE TANK PROGRAM, UST-2, Business SIC classification: READY-MIXED CONCRETE Organizations: ALLIED READY MIX INC (CONTACT/OWNER)
Alternative names: READY MIX USA LLC
NORTH FAYETTE ELEMENTARY SCHOOL (609 KENWOOD ROAD in FAYETTEVILLE, GA)
(Geographic Names Information System) (National Center for Education Statistics) - STATE ID-0181 Organizations: FAYETTE COUNTY (SCHOOL DISTRICT)
FAYETTE COUNTY HIGH SCHOOL (ONE TIGER TRAIL in FAYETTEVILLE, GA)
(Geographic Names Information System) (National Center for Education Statistics) - STATE ID-0398
BROWNING-FERRIS INDUSTRIES OF GEORGIA (180 ROBERTS RD in FAYETTEVILLE, GA)
AIR MINOR (AIRS/AFS) (Resource Conservation and Recovery Act (tracking hazardous waste)) Business SIC classification: REFUSE SYSTEMS Organizations: OPERNAME (CONTACT/OPERATOR)
Alternative names: BFI LANDFILL, BROWNING FERRIS INDUSTRIES
LULU'S TRADING CO (WALTER WAY ROAD in FAYETTEVILLE, GA)
SUPERFUND (Superfund database) (Integrated Compliance Information System) - ICIS-04-1999-0152, FORMAL ENFORCEMENT ACTION Alternative names: LULA DRUM SITE, LULA TRADING CO
FAYETTEVILLE INTERMEDIATE ELEMENTARY SCHOOL (440 HOOD AVENUE in FAYETTEVILLE, GA)
(National Center for Education Statistics) - STATE ID-0302 Organizations: FAYETTE COUNTY (SCHOOL DISTRICT)
FAYETTE MIDDLE SCHOOL (450 GRADY AVENUE in FAYETTEVILLE, GA)
(National Center for Education Statistics) - STATE ID-0287 Organizations: FAYETTE COUNTY (SCHOOL DISTRICT)
EVENING SCHOOL (205 LAFAYETTE AVE. in FAYETTEVILLE, GA)
(National Center for Education Statistics) - STATE ID-0194 Organizations: FAYETTE COUNTY (SCHOOL DISTRICT)
FAYETTE COUNTY ALTERNATIVE SCHOOL (205 LAFAYETTE DRIVE in FAYETTEVILLE, GA)
(National Center for Education Statistics) - STATE ID-6501
BENNETT'S GROCERY (1205 GA HWY 54 EAST in FAYETTEVILLE, GA)
(Integrated Compliance Information System) - ICIS-04-1991-0011, FORMAL ENFORCEMENT ACTION Alternative names: BENNETT GROCERY
MULTIFLEX DESIGNS (175 N 85 PKWY in FAYETTEVILLE, GA)
(Resource Conservation and Recovery Act (tracking hazardous waste)) Organizations: PARKER HORIZON LLC (CONTACT/OWNER)
, SAVAGE TERRY & CAROL (CONTACT/OWNER)
Housing units lacking complete plumbing facilities: 1.5% Housing units lacking complete kitchen facilities: 0.5%
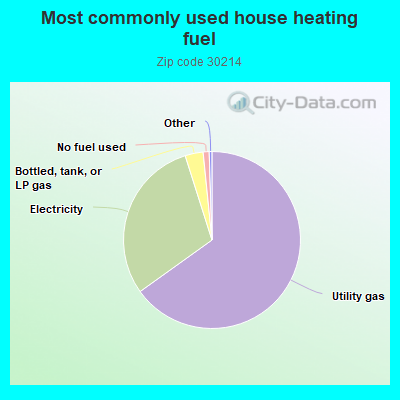
65.1%Utility gas
30.0%Electricity
3.3%Bottled, tank, or LP gas
1.1%No fuel used
Population in 1990: 35,007.
Place of birth for U.S.-born residents:
This state: 14,653
Northeast: 2,965
Midwest: 2,829
South: 6,142
West: 1,550
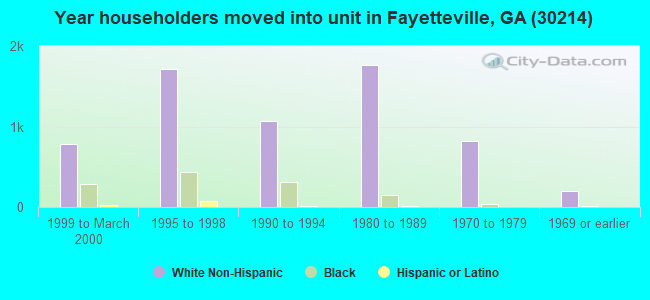
56% of the 30214 zip code residents lived in the same house 5 years ago. Out of people who lived in different houses, 27% lived in this county. Out of people who lived in different counties, 50% lived in Georgia.
90% of the 30214 zip code residents lived in the same house 1 year ago. Out of people who lived in different houses, 17% moved from this county. Out of people who lived in different houses, 57% moved from different county within same state. Out of people who lived in different houses, 21% moved from different state. Out of people who lived in different houses, 9% moved from abroad.
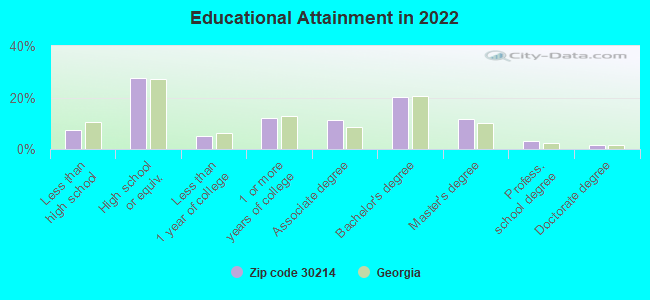
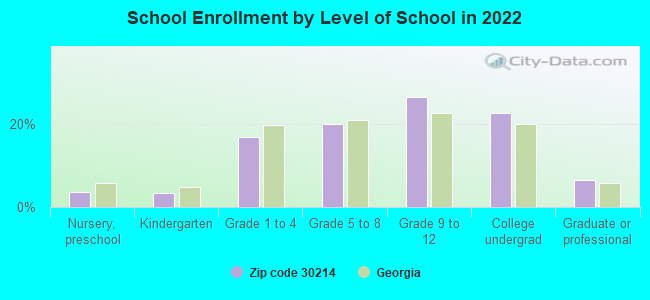
Private vs. public school enrollment:
Students in private schools in grades 1 to 8 (elementary and middle school): 260
Here:
9.3%
Georgia:
12.1%
Students in private schools in grades 9 to 12 (high school): 95
Here:
4.7%
Georgia:
10.8%
Students in private undergraduate colleges: 472
Here:
27.6%
Georgia:
17.1%
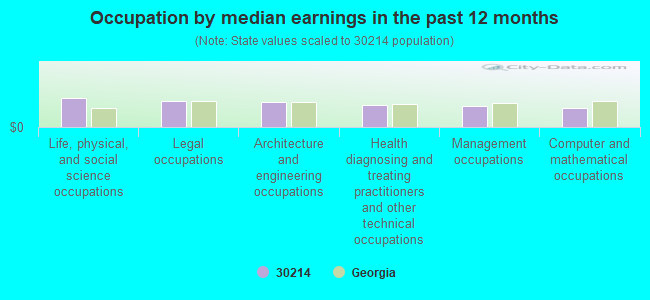
Occupation by median earnings in the past 12 months ($)
106,005Life, physical, and social science occupations
94,103Legal occupations
90,933Architecture and engineering occupations
78,913Health diagnosing and treating practitioners and other technical occupations
76,261Management occupations
67,874Computer and mathematical occupations
Companies with federal contracts located in this zip code (FAYETTEVILLE, GA):
UNIFIED CONSULTANTS GROUP, INC (543 EAST LANIER AVENUE, HI; small business) : $9,568,764 in 85 contractsfrom 2002 to 2006
Contracts for Other Professional Services, Facilities Operations Support Services, Other Administrative Support Services, Construction of Structures and Facilities -- Other Administrative Facilities and Service Buildings, and moreby Army Signed by year:2000: $0; 2001: $0; 2002: $1,575,635; 2003: $2,200,674; 2004: $3,212,700; 2005: $2,030,035; 2006: $549,720.
Biggest contracts:
$1,353,805 with Army for Other Professional Services. Signed on 2004-09-24. Completion date: 2004-09-23.
$1,123,392 with Army for Facilities Operations Support Services. Signed on 2003-01-29. Completion date: 2004-02-29.
$1,104,815, same as above.Signed on 2004-02-05. Completion date: 2004-02-29.
$880,155 with Army for Other Professional Services. Signed on 2003-09-24. Completion date: 2004-09-23.
UNIFIED CONSULTANTS GROUP, INC (535 N JEFF DAVIS DR; small business) : $2,410,731 in 6 contractsfrom 2004 to 2005
Contracts for Other Professional Services, Other Administrative Support Services, Miscellaneous Items by Army Signed by year:2000: $0; 2001: $0; 2002: $0; 2003: $0; 2004: $96,590; 2005: $2,314,141; 2006: $0.
Biggest contracts:
$1,868,755 with Army for Other Professional Services. Signed on 2005-09-22. Completion date: 2006-09-23.
$473,863 with Army for Other Professional Services. Taking place in VA. Signed on 2005-04-29. Completion date: 2006-03-17.
$56,311 with Army for Other Administrative Support Services. Signed on 2004-09-07. Completion date: 2005-02-28.
$40,279 with Army for Miscellaneous Items. Signed on 2004-09-27. Completion date: 2004-12-15.
C&C DISPOSAL, INC (1162 HIGHWAY 54 E; small business) : $255,021 in 22 contractsfrom 1999 to 2005
Contracts for Trash/Garbage Collection Services - Including Portable Sanitation Services, Custodial Janitorial Services by Air Force, Navy, Public Buildings Service, Army, and others Signed by year:2000: $1,000; 2001: $0; 2002: $71,760; 2003: $87,384; 2004: $41,179; 2005: $37,528; 2006: $0.
Biggest contracts:
$37,528 with Air Force for Trash/Garbage Collection Services - Including Portable Sanitation Services. Signed on 2005-11-10. Completion date: 2006-09-30.
$35,249, same as above.Signed on 2004-10-21. Completion date: 2005-09-30.
$35,208, same as above.Signed on 2002-11-13. Completion date: 2003-09-30.
$33,120, same as above.Signed on 2003-10-16. Completion date: 2004-09-30.
PROAIR INC (140 WALTER WAY; small business) : $151,869 in 7 contractsfrom 2000 to 2006
Contracts for Maintenance, Repair and Rebuilding of Equipment -- Refrigeration, Air Conditioning, and Air Circulating Equipment, Construction of Structures and Facilities -- Other Administrative Facilities and Service Buildings, Maintenance, Repair or Alteration of Real Property -- Miscellaneous Buildings, Construction of Structures and Facilities -- Miscellaneous Buildings by Army Signed by year:2000: $106,277; 2001: $5,981; 2002: $0; 2003: $0; 2004: $0; 2005: $8,860; 2006: $30,751.
Biggest contracts:
$89,997 with Army for Maintenance, Repair and Rebuilding of Equipment -- Refrigeration, Air Conditioning, and Air Circulating Equipment. Signed on 2000-02-09. Completion date: 2000-03-25.
$30,751 with Army for Construction of Structures and Facilities -- Other Administrative Facilities and Service Buildings. Signed on 2006-03-07. Completion date: 2006-04-08.
$8,800 with Army for Maintenance, Repair or Alteration of Real Property -- Miscellaneous Buildings. Signed on 2000-09-26. Completion date: 2000-11-30.
$7,480 with Army for Construction of Structures and Facilities -- Miscellaneous Buildings. Signed on 2000-09-06. Completion date: 2000-06-30.
ANGEL M GUARDIOLA (583 GINGER CAKE ROAD; small business) : $85,500 in 16 contractsfrom 2002 to 2006
Contracts for Industrial Hygienics, Environmental Studies and Assessments, Air Quality Analyses by Army Signed by year:2000: $0; 2001: $0; 2002: $19,000; 2003: $41,607; 2004: $7,850; 2005: $3,900; 2006: $13,143.
Biggest contracts:
$8,487 with Army for Industrial Hygienics. Signed on 2006-04-24. Completion date: 2006-09-30.
$7,850, same as above.Signed on 2004-09-09. Completion date: 2004-09-30.
$7,265 with Army for Environmental Studies and Assessments. Taking place in AR. Signed on 2003-08-27. Completion date: 2003-11-01.
$7,092 with Army for Environmental Studies and Assessments. Taking place in TX. Signed on 2003-08-26. Completion date: 2003-11-01.
POLLYM GREENLEES (365 WEATHERLY DR; small business) : $57,292 in 4 contractsfrom 1999 to 2000
$29,440 with Army for Dentistry Services. Signed on 2000-11-03. Completion date: 2001-09-30.
$27,852, same as above.Signed on 1999-11-22. Completion date: 2000-09-30.
$0, same as above.Signed on 2000-11-03. Completion date: 2001-09-30.
$0, same as above.Signed on 1999-11-22. Completion date: 2000-09-30.
GEORGIA SCHOOL EQUIPMENT INC (137 N 85 PKWY; small business)
$23,933 with Army for Maintenance, Repair and Rebuilding of Equipment -- Prefabricated Structures and Scaffolding. Taking place in SC. Signed on 2003-02-25. Completion date: 2003-04-24.
KARAVAN DOORS INCORPORATED (180 INDUSTRIAL WAY; small business) : $23,441 in 2 contractsfrom 2000 to 2003
$19,620 with U.S. Army Corps of Engineers - civil program financing only for Maintenance, Repair or Alteration of Real Property -- Other Industrial Buildings. Taking place in MO. Signed on 2003-09-18. Completion date: 2003-10-24.
$3,821 with Navy for Maintenance, Repair or Alteration of Real Property -- Other Administrative Facilities and Service Buildings. Signed on 2000-09-28. Completion date: 2000-11-08.
ATLANTA''S PROFESSIONAL DOOR, (125 CARNES DR; small business) : $12,042 in 3 contractsfrom 2000 to 2004
$4,804 with Army for Woodworking Machines. Signed on 2004-09-30. Completion date: 2004-04-09.
$4,238 with Public Buildings Service for Maintenance, Repair or Alteration of Real Property -- Office Buildings. Signed on 2002-12-15. Completion date: 2003-01-15.
$3,000, same as above.Signed on 2000-09-15. Completion date: 2000-09-15.
Top industries in this zip code by the number of employees in 2005:
2002 - 2018 National Fire Incident Reporting System (NFIRS) incidents
According to the data from the years 2002 - 2018 the average number of fire incidents per year is 127. The highest number of reported fire incidents - 178 took place in 2006, and the least - 0 in 2004. The data has a dropping trend.
When looking into fire subcategories, the most reports belonged to: Structure Fires (43.5%), and Outside Fires (39.4%).
Fire incident types reported to NFIRS in Zip Code 30214

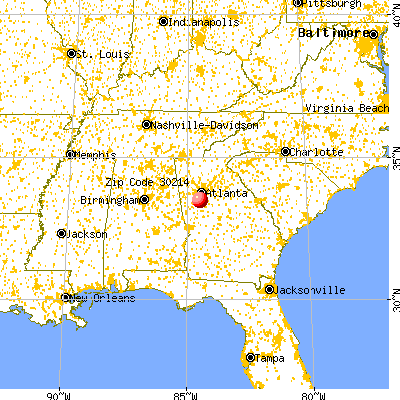


 Nearest zip codes: 30296, 30291, 30215, 30290, 30238, 30274.


 According to the data from the years 2002 - 2018 the average number of fire incidents per year is 127. The highest number of reported fire incidents - 178 took place in 2006, and the least - 0 in 2004. The data has a dropping trend.
 When looking into fire subcategories, the most reports belonged to: Structure Fires (43.5%), and Outside Fires (39.4%).