Estimated zip code population in 2022: 21,643 Zip code population in 2010: 18,004 Zip code population in 2000: 16,646
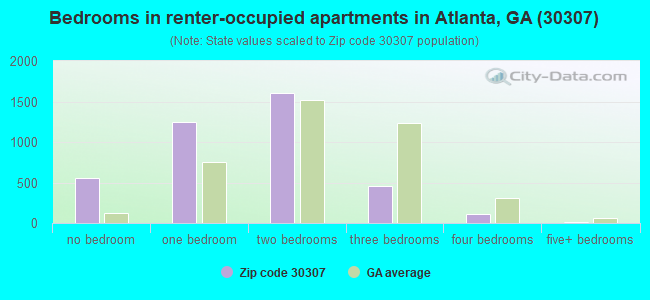
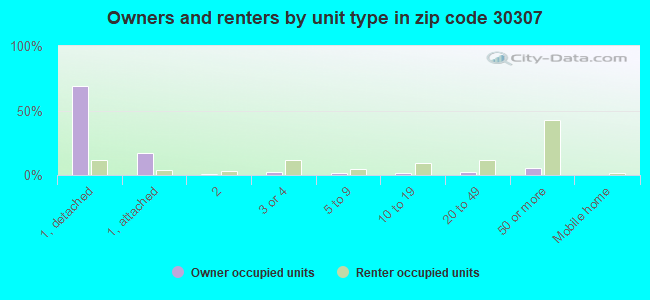
Houses and condos: 10,638 Renter-occupied apartments: 3,984
% of renters here:
40%
State:
34%
March 2022 cost of living index in zip code 30307: 105.0 (more than average, U.S. average is 100)
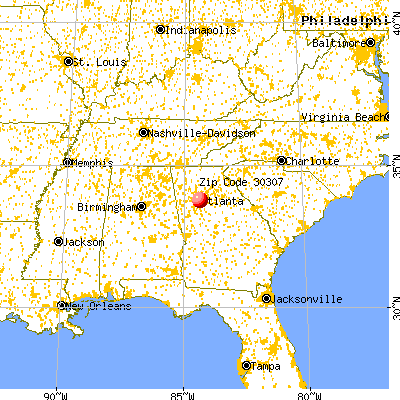
Land area: 4.6 sq. mi. Water area: 0.0 sq. mi.
Population density: 4,738 people per square mile
(average).
OSM Map
General Map
Google Map
MSN Map
OSM Map
General Map
Google Map
MSN Map
OSM Map
General Map
Google Map
MSN Map
OSM Map
General Map
Google Map
MSN Map
Please wait while loading the map...
Real estate property taxes paid for housing units in 2022:
This zip code:
0.9% ($7,230)
Georgia:
0.7% ($2,160)
Median real estate property taxes paid for housing units with mortgages in 2022: $7,106 (0.9%) Median real estate property taxes paid for housing units with no mortgage in 2022: $7,473 (0.9%)
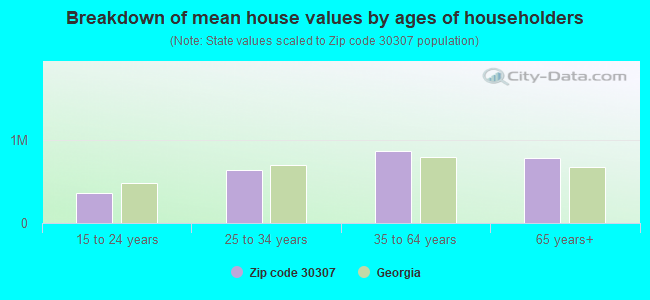
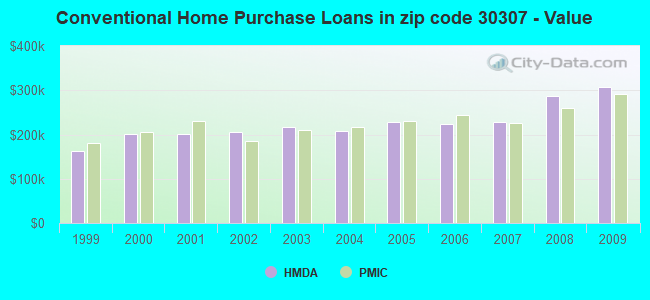
Estimated median house/condo value in 2022: $809,233
30307:
$809,233
Georgia:
$297,400
According to our research of Georgia and other state lists, there were 13 registered sex offenders living in 30307 zip code as of April 27, 2024. The ratio of all residents to sex offenders in zip code 30307 is 1,502 to 1. The ratio of registered sex offenders to all residents in this zip code is much lower than the state average.
Median resident age:
This zip code:
36.7 years
Georgia median age:
37.6 years
Average household size:
This zip code:
2.2 people
Georgia:
2.6 people
Averages for the 2020 tax year for zip code 30307, filed in 2021:
Average Adjusted Gross Income (AGI) in 2020: $169,971 (Individual Income Tax Returns)
Here:
$169,971
State:
$70,847
Salary/wage: $127,006 (reported on 84.5% of returns)
Here:
$127,006
State:
$59,126
(% of AGI for various income ranges: 1152.1% for AGIs below $25k, 3902.9% for AGIs $25k-50k, 7198.0% for AGIs $50k-75k, 11367.6% for AGIs $75k-100k, 21235.0% for AGIs $100k-200k, 104468.5% for AGIs over 200k)
Taxable interest for individuals: $2,232 (reported on 44.1% of returns)
This zip code:
$2,232
Georgia:
$2,011
(% of AGI for various income ranges: 18.3% for AGIs below $25k, 23.6% for AGIs $25k-50k, 24.1% for AGIs $50k-75k, 52.2% for AGIs $75k-100k, 138.2% for AGIs $100k-200k, 1160.9% for AGIs over 200k)
Ordinary dividends: $13,565 (reported on 42.8% of returns)
Here:
$13,565
State:
$8,996
(% of AGI for various income ranges: 88.7% for AGIs below $25k, 113.8% for AGIs $25k-50k, 188.2% for AGIs $50k-75k, 352.9% for AGIs $75k-100k, 803.4% for AGIs $100k-200k, 6858.5% for AGIs over 200k)
Net capital gain/loss in AGI: +$56,610 (reported on 39.1% of returns)
Here:
+$56,610
State:
+$28,402
(% of AGI for various income ranges: 37.1% for AGIs below $25k, 85.9% for AGIs $25k-50k, 158.2% for AGIs $50k-75k, 290.0% for AGIs $75k-100k, 1036.7% for AGIs $100k-200k, 32413.0% for AGIs over 200k)
Profit/loss from business: +$21,712 (reported on 24.5% of returns)
Here:
+$21,712
State:
+$6,707
(% of AGI for various income ranges: 150.7% for AGIs below $25k, 268.8% for AGIs $25k-50k, 193.5% for AGIs $50k-75k, 378.1% for AGIs $75k-100k, 1040.9% for AGIs $100k-200k, 5270.9% for AGIs over 200k)
Taxable individual retirement arrangement distribution: $28,754 (reported on 7.8% of returns)
30307:
$28,754
Georgia:
$20,525
(% of AGI for various income ranges: 32.5% for AGIs below $25k, 68.0% for AGIs $25k-50k, 142.4% for AGIs $50k-75k, 370.9% for AGIs $75k-100k, 691.5% for AGIs $100k-200k, 1676.7% for AGIs over 200k)
Self-employed (Keogh) retirement plans: $32,612 (reported on 3.1% of returns)
30307:
$32,612
Georgia:
$27,751
(% of AGI for various income ranges: 32.1% for AGIs $25k-50k, 90.0% for AGIs $100k-200k, 1376.1% for AGIs over 200k)
Total itemized deductions: $35,673 (reported on 27.8% of returns)
Here:
$35,673
State:
$34,001
(% of AGI for various income ranges: 128.0% for AGIs below $25k, 146.6% for AGIs $25k-50k, 428.7% for AGIs $50k-75k, 974.7% for AGIs $75k-100k, 2061.0% for AGIs $100k-200k, 10243.0% for AGIs over 200k)
Charity contributions: $13,028 (reported on 23.3% of returns)
Here:
$13,028
State:
$14,164
(% of AGI for various income ranges: 7.6% for AGIs below $25k, 19.4% for AGIs $25k-50k, 56.8% for AGIs $50k-75k, 124.0% for AGIs $75k-100k, 363.1% for AGIs $100k-200k, 3941.8% for AGIs over 200k)
Taxes paid: $9,149 (reported on 27.8% of returns)
30307:
$9,149
State:
$7,540
(% of AGI for various income ranges: 25.5% for AGIs below $25k, 42.2% for AGIs $25k-50k, 126.5% for AGIs $50k-75k, 331.4% for AGIs $75k-100k, 709.8% for AGIs $100k-200k, 2242.6% for AGIs over 200k)
Earned income credit: $1,950 (reported on 7.7% of returns)
Here:
$1,950
State:
$2,530
(% of AGI for various income ranges: 87.2% for AGIs below $25k, 27.8% for AGIs $25k-50k)
Percentage of individuals using paid preparers for their 2020 taxes: 94.0%
Here:
94%
State:
93%
(% for various income ranges: 91.3% for AGIs below $25k, 93.3% for AGIs $25k-50k, 93.9% for AGIs $50k-75k, 93.7% for AGIs $75k-100k, 95.2% for AGIs $100k-200k, 96.2% for AGIs over 200k)
Averages for the 2012 tax year for zip code 30307, filed in 2013:
Average Adjusted Gross Income (AGI) in 2012: $111,715 (Individual Income Tax Returns)
Here:
$111,715
State:
$56,131
Salary/wage: $89,804 (reported on 86.0% of returns)
Here:
$89,804
State:
$47,942
(% of AGI for various income ranges: 77.6% for AGIs below $25k, 83.3% for AGIs $25k-50k, 82.7% for AGIs $50k-75k, 82.3% for AGIs $75k-100k, 79.6% for AGIs $100k-200k, 58.8% for AGIs over 200k)
Taxable interest for individuals: $2,055 (reported on 42.2% of returns)
This zip code:
$2,055
Georgia:
$1,706
(% of AGI for various income ranges: 1.1% for AGIs below $25k, 0.5% for AGIs $25k-50k, 0.5% for AGIs $50k-75k, 0.9% for AGIs $75k-100k, 0.7% for AGIs $100k-200k, 0.9% for AGIs over 200k)
Ordinary dividends: $7,753 (reported on 36.0% of returns)
Here:
$7,753
State:
$7,265
(% of AGI for various income ranges: 4.4% for AGIs below $25k, 2.4% for AGIs $25k-50k, 2.1% for AGIs $50k-75k, 2.1% for AGIs $75k-100k, 2.5% for AGIs $100k-200k, 2.5% for AGIs over 200k)
Net capital gain/loss in AGI: +$17,809 (reported on 29.9% of returns)
Here:
+$17,809
State:
+$16,323
(% of AGI for various income ranges: 0.8% for AGIs below $25k, 1.0% for AGIs $25k-50k, 0.8% for AGIs $50k-75k, 0.8% for AGIs $75k-100k, 2.1% for AGIs $100k-200k, 7.6% for AGIs over 200k)
Profit/loss from business: +$19,433 (reported on 23.6% of returns)
Here:
+$19,433
State:
+$7,583
(% of AGI for various income ranges: 11.9% for AGIs below $25k, 6.6% for AGIs $25k-50k, 4.0% for AGIs $50k-75k, 4.1% for AGIs $75k-100k, 4.4% for AGIs $100k-200k, 3.2% for AGIs over 200k)
Taxable individual retirement arrangement distribution: $27,076 (reported on 7.9% of returns)
30307:
$27,076
Georgia:
$17,199
(% of AGI for various income ranges: 1.3% for AGIs below $25k, 1.6% for AGIs $25k-50k, 2.1% for AGIs $50k-75k, 2.1% for AGIs $75k-100k, 2.4% for AGIs $100k-200k, 1.7% for AGIs over 200k)
Self-employment retirement plans: $30,114 (reported on 3.0% of returns)
30307:
$30,114
Georgia:
$23,277
(% of AGI for various income ranges: 0.6% for AGIs $50k-75k, 0.4% for AGIs $100k-200k, 1.3% for AGIs over 200k)
Total itemized deductions: $32,508 (17% of AGI, reported on 51.1% of returns)
Here:
$32,508
State:
$23,886
Here:
17.4% of AGI
State:
21.5% of AGI
(% of AGI for various income ranges: 11.5% for AGIs below $25k, 12.4% for AGIs $25k-50k, 15.0% for AGIs $50k-75k, 16.4% for AGIs $75k-100k, 17.2% for AGIs $100k-200k, 14.1% for AGIs over 200k)
Charity contributions: $5,779 (reported on 43.6% of returns)
Here:
$5,779
State:
$5,507
(% of AGI for various income ranges: 0.9% for AGIs below $25k, 1.2% for AGIs $25k-50k, 1.3% for AGIs $50k-75k, 1.5% for AGIs $75k-100k, 1.9% for AGIs $100k-200k, 2.8% for AGIs over 200k)
Taxes paid: $14,453 (reported on 51.1% of returns)
30307:
$14,453
State:
$7,838
(% of AGI for various income ranges: 2.7% for AGIs below $25k, 3.4% for AGIs $25k-50k, 5.2% for AGIs $50k-75k, 6.5% for AGIs $75k-100k, 7.6% for AGIs $100k-200k, 7.0% for AGIs over 200k)
Earned income credit: $1,879 (reported on 10.1% of returns)
Here:
$1,879
State:
$2,589
(% of AGI for various income ranges: 5.0% for AGIs below $25k, 0.3% for AGIs $25k-50k)
Percentage of individuals using paid preparers for their 2012 taxes: 49.2%
Here:
49%
State:
55%
(% for various income ranges: 41.5% for AGIs below $25k, 40.8% for AGIs $25k-50k, 44.0% for AGIs $50k-75k, 48.9% for AGIs $75k-100k, 56.1% for AGIs $100k-200k, 72.9% for AGIs over 200k)
Averages for the 2004 tax year for zip code 30307, filed in 2005:
Average Adjusted Gross Income (AGI) in 2004: $84,816 (Individual Income Tax Returns)
Here:
$84,816
State:
$47,553
Salary/wage: $68,828 (reported on 85.0% of returns)
Here:
$68,828
State:
$42,178
(% of AGI for various income ranges: 155.2% for AGIs below $10k, 83.7% for AGIs $10k-25k, 85.1% for AGIs $25k-50k, 81.3% for AGIs $50k-75k, 81.1% for AGIs $75k-100k, 62.1% for AGIs over 100k)
Taxable interest for individuals: $2,032 (reported on 51.5% of returns)
This zip code:
$2,032
Georgia:
$1,772
(% of AGI for various income ranges: 8.6% for AGIs below $10k, 1.6% for AGIs $10k-25k, 0.9% for AGIs $25k-50k, 1.3% for AGIs $50k-75k, 1.1% for AGIs $75k-100k, 1.2% for AGIs over 100k)
Taxable dividends: $4,966 (reported on 39.2% of returns)
Here:
$4,966
State:
$4,283
(% of AGI for various income ranges: 14.3% for AGIs below $10k, 2.6% for AGIs $10k-25k, 1.6% for AGIs $25k-50k, 2.2% for AGIs $50k-75k, 2.1% for AGIs $75k-100k, 2.3% for AGIs over 100k)
Net capital gain/loss: +$25,413 (reported on 33.2% of returns)
Here:
+$25,413
State:
+$16,461
(% of AGI for various income ranges: 5.5% for AGIs below $10k, 1.0% for AGIs $10k-25k, 1.1% for AGIs $25k-50k, 1.2% for AGIs $50k-75k, 2.1% for AGIs $75k-100k, 13.8% for AGIs over 100k)
Profit/loss from business: +$16,306 (reported on 22.3% of returns)
Here:
+$16,306
State:
+$8,201
(% of AGI for various income ranges: 24.5% for AGIs below $10k, 9.2% for AGIs $10k-25k, 5.7% for AGIs $25k-50k, 4.5% for AGIs $50k-75k, 4.5% for AGIs $75k-100k, 3.6% for AGIs over 100k)
IRA payment deduction: $2,823 (reported on 3.1% of returns)
30307:
$2,823
Georgia:
$2,969
(% of AGI for various income ranges: 0.6% for AGIs below $10k, 0.2% for AGIs $10k-25k, 0.2% for AGIs $25k-50k, 0.2% for AGIs $50k-75k, 0.2% for AGIs $75k-100k, 0.0% for AGIs over 100k)
Self-employed pension: $19,440 (reported on 3.9% of returns)
Here:
$19,440
Georgia:
$16,203
(% of AGI for various income ranges: 0.2% for AGIs $10k-25k, 0.2% for AGIs $25k-50k, 0.3% for AGIs $50k-75k, 0.5% for AGIs $75k-100k, 1.2% for AGIs over 100k)
Total itemized deductions: $26,492 (19% of AGI, reported on 51.7% of returns)
Here:
$26,492
State:
$19,944
Here:
18.7% of AGI
State:
22.6% of AGI
(% of AGI for various income ranges: 25.4% for AGIs below $10k, 13.3% for AGIs $10k-25k, 15.3% for AGIs $25k-50k, 20.4% for AGIs $50k-75k, 21.0% for AGIs $75k-100k, 15.1% for AGIs over 100k)
Charity contributions deductions: $4,427 (3% of AGI, reported on 45.8% of returns)
Here:
$4,427
State:
$4,354
Here:
2.9% of AGI
State:
4.7% of AGI
(% of AGI for various income ranges: 1.6% for AGIs below $10k, 1.2% for AGIs $10k-25k, 1.7% for AGIs $25k-50k, 2.0% for AGIs $50k-75k, 2.3% for AGIs $75k-100k, 2.6% for AGIs over 100k)
Total tax: $17,503 (reported on 84.0% of returns)
30307:
$17,503
State:
$8,223
(% of AGI for various income ranges: 7.4% for AGIs below $10k, 5.5% for AGIs $10k-25k, 9.3% for AGIs $25k-50k, 11.8% for AGIs $50k-75k, 12.8% for AGIs $75k-100k, 20.5% for AGIs over 100k)
Earned income credit: $1,702 (reported on 11.7% of returns)
Here:
$1,702
State:
$1,986
Percentage of individuals using paid preparers for their 2004 taxes: 52.3%
Here:
52%
State:
62%
(% for various income ranges: 48.8% for AGIs below $10k, 49.7% for AGIs $10k-25k, 44.3% for AGIs $25k-50k, 52.0% for AGIs $50k-75k, 52.9% for AGIs $75k-100k, 63.7% for AGIs over 100k)
Likely homosexual households (counted as self-reported same-sex unmarried-partner households)
Lesbian couples: 0.4% of all households
Gay men: 0.4% of all households
Household received Food Stamps/SNAP in the past 12 months: 528 Household did not receive Food Stamps/SNAP in the past 12 months: 9,326
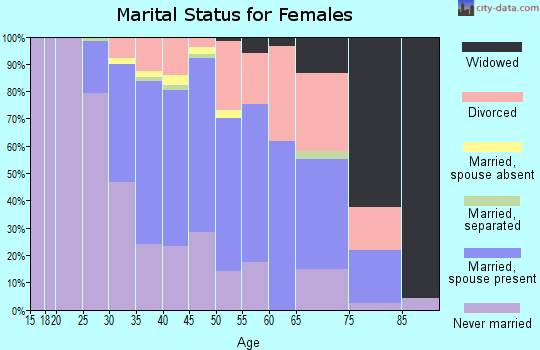
Women who had a birth in the past 12 months: 273 (234 now married, 39 unmarried) Women who did not have a birth in the past 12 months: 6,587 (2,279 now married, 4,311 unmarried)
Housing units in zip code 30307 with a mortgage: 4,271 (635 second mortgage, 21 home equity loan, 568 both second mortgage and home equity loan) Houses without a mortgage: 72
Median monthly owner costs for units with a mortgage: $3,003 Median monthly owner costs for units without a mortgage: $1,110
Residents with income below the poverty level in 2022:
This zip code:
9.0%
Whole state:
12.7%
Residents with income below 50% of the poverty level in 2022:
This zip code:
2.7%
Whole state:
6.3%
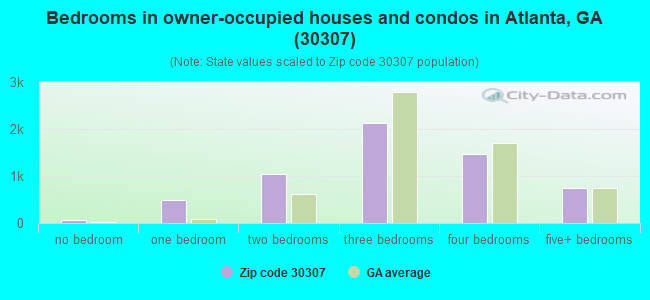
Median number of rooms in houses and condos:
Here:
7.1
State:
6.8
Median number of rooms in apartments:
Here:
3.6
State:
4.6
Notable locations in this zip code not listed on our city pages
Notable locations in zip code 30307: Diuid Hills Golf Club (A), Little Five Points (B), Belt Junction (C), East Lake Station (D), Edgewood-Candler Park Station (E), Emory Police Station (F), Inman Park-Reynoldstown Station (G), Atlanta Fire / Rescue Station 12 (H), Fire Station Number 12 (I), Inman Park Branch Atlanta-Fulton Public Library (J), Glenn Youth Building (K), Gambrell Hall (L), Southern Christian Home for Children (M), Carter Presidential Center (N). Display/hide their locations on the map
Churches in zip code 30307 include: Epworth Church (A), Inman Park United Methodist Church (B), Lizzie Chapel Baptist Church (C), East Atlanta Primitive Baptist Church (D), House of Ravenwood Church (E), Baptist Student Center (F), Smith Chapel African Methodist Episcopal Church (G), New Saint John Baptist Church (H), Liberty Church of Deliverance (I). Display/hide their locations on the map
Parks in zip code 30307 include: Inman Park-Moreland Historic District (1), Moreland Park (2), Lake Claire Park (3), Iverson Park (4), Goldsboro Park (5), Wesley Avenue Park (6), Gillian Park (7), Adams Park (8), Brightwood Park (9). Display/hide their locations on the map
Tourist attractions (not listed on the city page) : Fernbank Museum of Natural History - Group Sales (767 Clifton Road Northeast), Fernbank Museum of Natural History (767 Clifton Road Northeast).
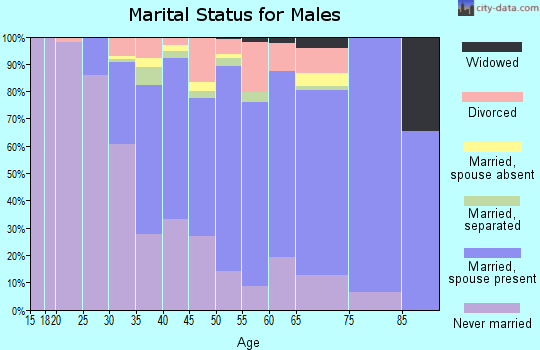
2,601 married couples with children.
1,060 single-parent households (343 men, 717 women).
90.6% of residents of 30307 zip code speak English at home.
2.9% of residents speak Spanish at home (93% very well, 7% well).
2.7% of residents speak other Indo-European language at home (88% very well, 6% well, 6% not well).
2.7% of residents speak Asian or Pacific Island language at home (75% very well, 23% well, 2% not well).
0.8% of residents speak other language at home (93% very well, 7% not well).
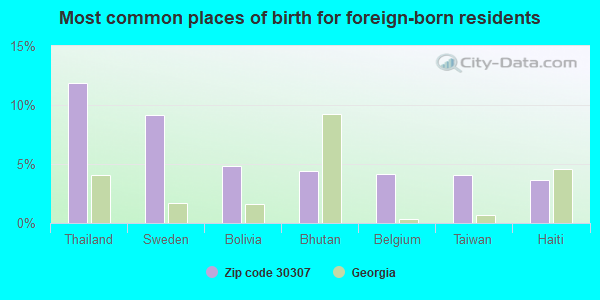
Foreign born population: 1,599 (7.4%) (61.1% of them are naturalized citizens)
This zip code:
7.4%
Whole state:
10.7%
12%Thailand
9%Sweden
5%Bolivia
4%Bhutan
4%Belgium
4%Taiwan
4%Haiti
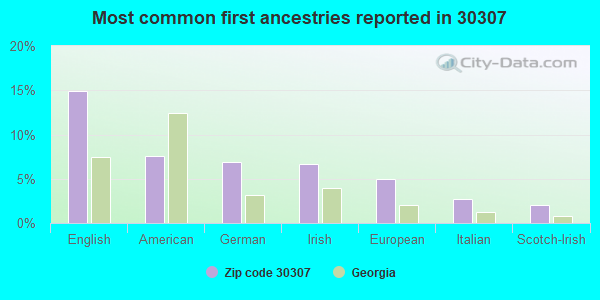
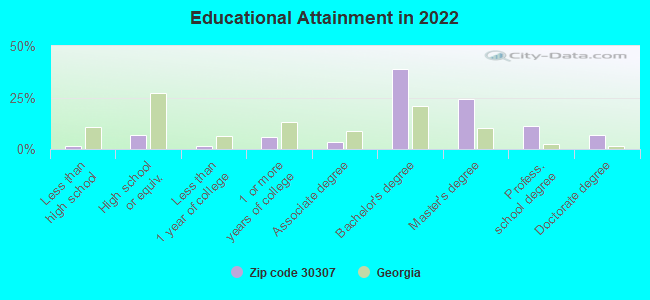
15%English
8%American
7%German
7%Irish
5%European
3%Italian
2%Scotch-Irish
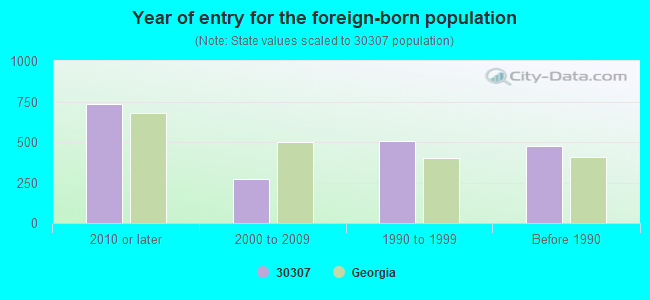
Year of entry for the foreign-born population
7332010 or later
2722000 to 2009
5061990 to 1999
475Before 1990
Major facilities with environmental interests located in this zip code:
ATLANTA GAS LIGHT SERVICE CENTER (1251 CAROLINE ST NE in ATLANTA, GA)
STATE MASTER (Georgia's Geographic Environmental Information) - UST-1, UNDERGROUND STORAGE TANK PROGRAM, UST-10, UST-11, UST-4, UST-5, UST-6, UST-8, UST-9, UST-2, UST-3, UST-7, (Resource Conservation and Recovery Act (tracking hazardous waste)) Organizations: LAW ENGINEERING (CONTACT/AGENT)
, OPERNAME (CONTACT/OPERATOR)
, ATLANTA GAS LIGHT CO (CONTACT/OWNER)
, ATLANTA GAS LIGHT COMPANY (CONTACT/OWNER)
, SMITH EQUIPMENT COMPANY INC (INSTALLER)
Alternative names: ATLANTA GAS LIGHT CO GARAGE
ATLANTA PUBLIC SCHOOLE-SERVICE C (1631 LA FRANCE ST in ATLANTA, GA)
STATE MASTER (Georgia's Geographic Environmental Information) - UST-1, UNDERGROUND STORAGE TANK PROGRAM, UST-2, Small Quantity Generators, between 100 kg and 1000 kg of hazardous waste/month (Resource Conservation and Recovery Act (tracking hazardous waste)) - notification Organizations: ATLANTA BOARD OF EDUCATION (CONTACT/OPERATOR)
, BOARD OF ED-CITY OF ATLANTA (CONTACT/OWNER)
, ATLANTA PUBLIC SCHOOLS (CONTACT/OWNER)
, ATLANTA BOARD OF EDUCATION (CONTACT/OWNER)
Alternative names: SERVICE CENTER ATL PUBLIC SCHOOLS
BP OIL COMPANY (1605 NORTH DECATUR ROAD in ATLANTA, GA)
STATE MASTER (Georgia's Geographic Environmental Information) - UST-1, UNDERGROUND STORAGE TANK PROGRAM, UST-2, UST-3, UST-4, UST-5, Conditionally Exempt Small Quantity Generators, less than 100 kg/month of hazardous waste (Resource Conservation and Recovery Act (tracking hazardous waste)) - notification Organizations: BP PRODUCTS NORTH AMERICA INC (CONTACT/OPERATOR)
, BP OIL CO. (CONTACT/OWNER)
FERNBANK SCIENCE CENTER (156 HEATON PARK DR in ATLANTA, GA)
(National Center for Education Statistics) - STATE ID-6010 Conditionally Exempt Small Quantity Generators, less than 100 kg/month of hazardous waste (Resource Conservation and Recovery Act (tracking hazardous waste)) - notification Organizations: DE KALB CO SCHOOL SYSTEM (CONTACT/OWNER)
, DEKALB COUNTY (SCHOOL DISTRICT)
LIN ELEMENTARY SCHOOL (586 CANDLER PARK DRIVE, NE in ATLANTA, GA)
(Geographic Names Information System) (National Center for Education Statistics) - STATE ID-2564 Organizations: ATLANTA CITY (SCHOOL DISTRICT)
MEAD PRODUCTS DIV MEA (810 LAKE AVE. in ATLANTA, GA)
AIR MINOR (AIRS/AFS) (Resource Conservation and Recovery Act (tracking hazardous waste)) Organizations: OPERNAME (CONTACT/OPERATOR)
, MEAD CORP (CONTACT/OWNER)
Alternative names: MEAD PRODUCTS ATLANTA, MEAD PRODUCTS DIVISION MEAD CORPORATION
CHARLES R. DREW CHARTER SCHOOL (187 WESLEY AVENUE in ATLANTA, GA)
(National Center for Education Statistics) - STATE ID-0201 Organizations: ATLANTA CITY (SCHOOL DISTRICT)
FERNBANK ELEMENTARY SCHOOL (157 HEATON PARK DRIVE, NE in ATLANTA, GA)
(National Center for Education Statistics) - STATE ID-2056 Organizations: DEKALB COUNTY (SCHOOL DISTRICT)
FERN BANK MUSEUM OF NATURAL HISTORY (1820 PONCE DE LEON AVE in ATLANTA, GA)
(Resource Conservation and Recovery Act (tracking hazardous waste)) Organizations: FERN BANK INC (CONTACT/OPERATOR)
ACE AUTO ELECTRIC (701 EDGEWOOD AVE in ATLANTA, GA)
AIR SYNTHETIC MINOR (AIRS/AFS) CRITERIA AND HAZARDOUS AIR POLLUTANT INVENTORY (Inventory of air pollution sources) TRI REPORTER (Tracking of toxic chemicals releasing facilities) Business SIC classification: PLASTICS PLUMBING FIXTURES Business NAICS classification: PLASTICS PLUMBING FIXTURE MANUFACTURING.
NATIONAL ENGINES & PARTS CO (820 DEKALB AVE NE in ATLANTA, GA)
(Resource Conservation and Recovery Act (tracking hazardous waste)) Business NAICS classification: ALL OTHER MOTOR VEHICLE PARTS MANUFACTURING. Organizations: OPERNAME (CONTACT/OPERATOR)
ARAMARK UNIFORM SERVICES (670 DEKALB AVENUE in ATLANTA, GA)
Small Quantity Generators, between 100 kg and 1000 kg of hazardous waste/month (Resource Conservation and Recovery Act (tracking hazardous waste)) Business NAICS classification: OTHER PERSONAL CARE SERVICES. Organizations: OPERNAME (CONTACT/OPERATOR)
, ARATEX SERVICES INC (CONTACT/OWNER)
Alternative names: ARATEX SERVICES INC
Housing units lacking complete plumbing facilities: 0.3% Housing units lacking complete kitchen facilities: 0.3%
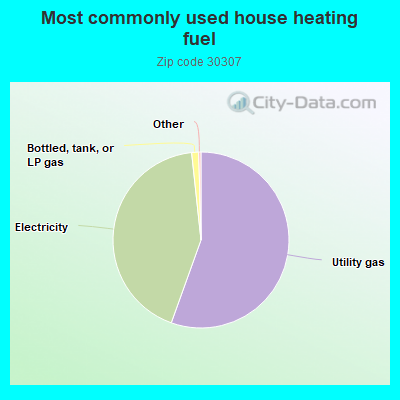
55.5%Utility gas
42.8%Electricity
1.3%Bottled, tank, or LP gas
Population in 1990: 16,330. Population change in the 1990s: +316 (+1.9%).
Place of birth for U.S.-born residents:
This state: 8,230
Northeast: 2,879
Midwest: 2,445
South: 4,858
West: 1,329
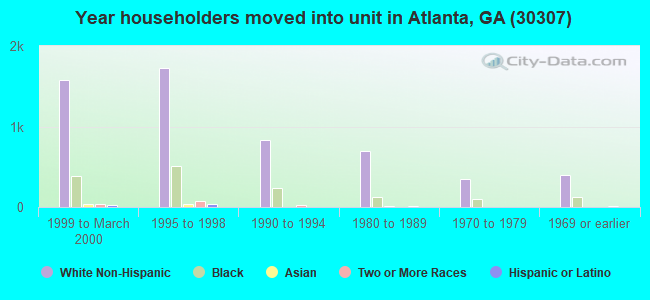
44% of the 30307 zip code residents lived in the same house 5 years ago. Out of people who lived in different houses, 37% lived in this county. Out of people who lived in different counties, 50% lived in Georgia.
84% of the 30307 zip code residents lived in the same house 1 year ago. Out of people who lived in different houses, 31% moved from this county. Out of people who lived in different houses, 31% moved from different county within same state. Out of people who lived in different houses, 36% moved from different state. Out of people who lived in different houses, 4% moved from abroad.
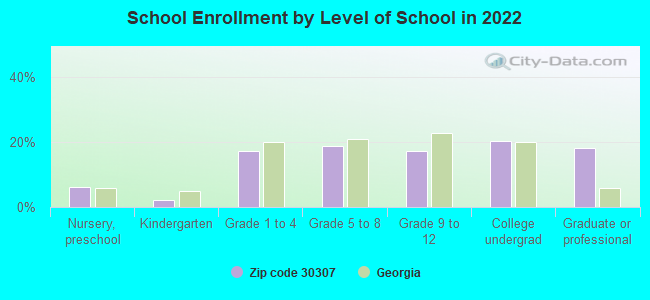
Private vs. public school enrollment:
Students in private schools in grades 1 to 8 (elementary and middle school): 530
Here:
27.9%
Georgia:
12.1%
Students in private schools in grades 9 to 12 (high school): 153
Here:
17.2%
Georgia:
10.8%
Students in private undergraduate colleges: 430
Here:
40.7%
Georgia:
17.1%
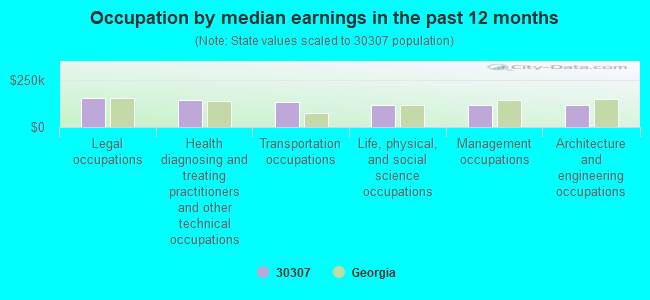
Occupation by median earnings in the past 12 months ($)
154,593Legal occupations
145,074Health diagnosing and treating practitioners and other technical occupations
133,379Transportation occupations
120,159Life, physical, and social science occupations
116,659Management occupations
115,377Architecture and engineering occupations
Companies with federal contracts located in this zip code:
CHABAD ON CAMPUS (1526 NORTH DECATUR ROAD in ATLANTA, GA; small business) : $41,638 in 8 contractsfrom 2002 to 2005
Contracts for Chaplain Services, Other Professional Services by Army Signed by year:2000: $0; 2001: $0; 2002: $18,800; 2003: $9,400; 2004: $8,713; 2005: $4,725; 2006: $0.
Biggest contracts:
$9,400 with Army for Chaplain Services. Signed on 2003-12-12. Completion date: 2004-09-30.
$9,400, same as above.Signed on 2002-12-06. Completion date: 2002-10-01.
$9,400, same as above.Signed on 2002-02-14. Completion date: 2002-10-31.
$8,663 with Army for Other Professional Services. Signed on 2004-11-09. Completion date: 2004-11-01.
GRASHOF DESIGN STUDIO INC (1696 MCLENDON AVE NE in ATLANTA, GA; small business)
$24,950 with Army for Historical Studies. Signed on 2004-04-26. Completion date: 2004-09-30.
Top industries in this zip code by the number of employees in 2005:
2002 - 2018 National Fire Incident Reporting System (NFIRS) incidents
According to the data from the years 2002 - 2018 the average number of fire incidents per year is 50. The highest number of fire incidents - 99 took place in 2014, and the least - 0 in 2004. The data has a rising trend.
When looking into fire subcategories, the most incidents belonged to: Structure Fires (40.3%), and Outside Fires (38.7%).
Fire incident types reported to NFIRS in Zip Code 30307


 Nearest zip codes: 30322, 30306, 30317, 30030, 30308, 30312.


 According to the data from the years 2002 - 2018 the average number of fire incidents per year is 50. The highest number of fire incidents - 99 took place in 2014, and the least - 0 in 2004. The data has a rising trend.
 When looking into fire subcategories, the most incidents belonged to: Structure Fires (40.3%), and Outside Fires (38.7%).