Estimated zip code population in 2022: 26,729 Zip code population in 2010: 19,360 Zip code population in 2000: 20,221
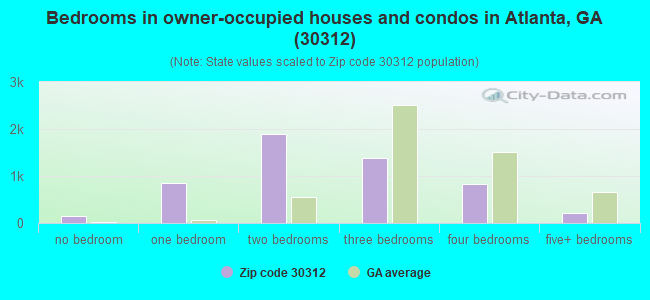
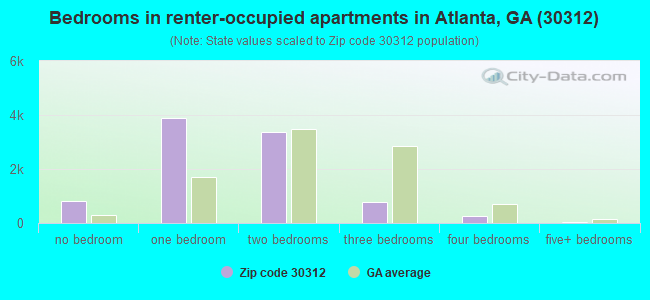
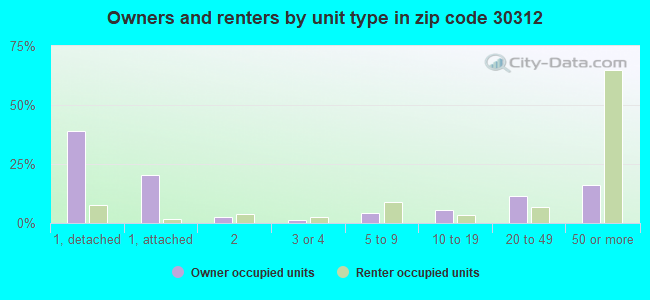
Houses and condos: 15,511 Renter-occupied apartments: 9,160
% of renters here:
63%
State:
34%
March 2022 cost of living index in zip code 30312: 106.2 (more than average, U.S. average is 100)
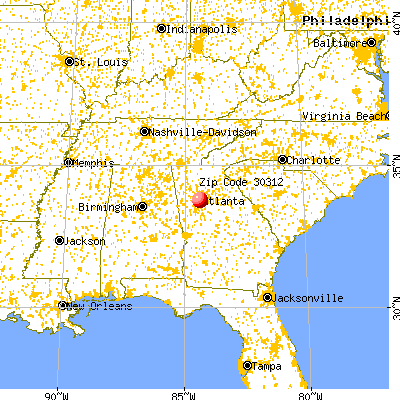
Land area: 3.4 sq. mi. Water area: 0.0 sq. mi.
Population density: 7,972 people per square mile
(high).
OSM Map
General Map
Google Map
MSN Map
OSM Map
General Map
Google Map
MSN Map
OSM Map
General Map
Google Map
MSN Map
OSM Map
General Map
Google Map
MSN Map
Please wait while loading the map...
Real estate property taxes paid for housing units in 2022:
This zip code:
0.8% ($4,258)
Georgia:
0.7% ($2,160)
Median real estate property taxes paid for housing units with mortgages in 2022: $4,111 (0.8%) Median real estate property taxes paid for housing units with no mortgage in 2022: $4,682 (0.8%)
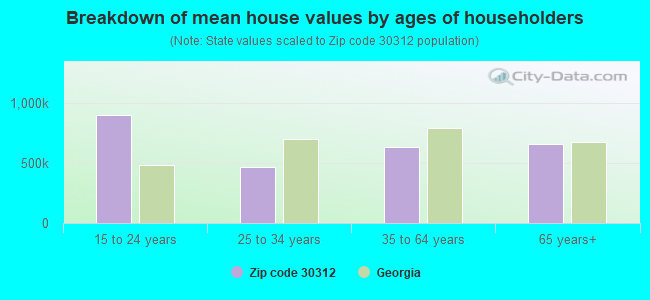
Estimated median house/condo value in 2022: $547,753
30312:
$547,753
Georgia:
$297,400
According to our research of Georgia and other state lists, there were 28 registered sex offenders living in 30312 zip code as of April 27, 2024. The ratio of all residents to sex offenders in zip code 30312 is 814 to 1. The ratio of registered sex offenders to all residents in this zip code is lower than the state average.
Median resident age:
This zip code:
32.4 years
Georgia median age:
37.6 years
Average household size:
This zip code:
1.8 people
Georgia:
2.6 people
Averages for the 2020 tax year for zip code 30312, filed in 2021:
Average Adjusted Gross Income (AGI) in 2020: $92,911 (Individual Income Tax Returns)
Here:
$92,911
State:
$70,847
Salary/wage: $74,115 (reported on 89.3% of returns)
Here:
$74,115
State:
$59,126
(% of AGI for various income ranges: 1125.3% for AGIs below $25k, 3761.2% for AGIs $25k-50k, 7661.2% for AGIs $50k-75k, 11553.0% for AGIs $75k-100k, 21003.5% for AGIs $100k-200k, 79399.1% for AGIs over 200k)
Taxable interest for individuals: $960 (reported on 24.3% of returns)
This zip code:
$960
Georgia:
$2,011
(% of AGI for various income ranges: 3.2% for AGIs below $25k, 8.2% for AGIs $25k-50k, 10.2% for AGIs $50k-75k, 26.6% for AGIs $75k-100k, 73.7% for AGIs $100k-200k, 425.3% for AGIs over 200k)
Ordinary dividends: $3,641 (reported on 22.5% of returns)
Here:
$3,641
State:
$8,996
(% of AGI for various income ranges: 10.0% for AGIs below $25k, 23.7% for AGIs $25k-50k, 39.3% for AGIs $50k-75k, 73.1% for AGIs $75k-100k, 214.9% for AGIs $100k-200k, 1725.9% for AGIs over 200k)
Net capital gain/loss in AGI: +$18,370 (reported on 20.9% of returns)
Here:
+$18,370
State:
+$28,402
(% of AGI for various income ranges: 9.4% for AGIs below $25k, 59.2% for AGIs $25k-50k, 70.5% for AGIs $50k-75k, 135.4% for AGIs $75k-100k, 581.2% for AGIs $100k-200k, 11180.0% for AGIs over 200k)
Profit/loss from business: +$7,868 (reported on 24.4% of returns)
Here:
+$7,868
State:
+$6,707
(% of AGI for various income ranges: 57.0% for AGIs below $25k, 106.4% for AGIs $25k-50k, 181.5% for AGIs $50k-75k, 267.0% for AGIs $75k-100k, 677.9% for AGIs $100k-200k, 2207.1% for AGIs over 200k)
Taxable individual retirement arrangement distribution: $16,350 (reported on 3.2% of returns)
30312:
$16,350
Georgia:
$20,525
(% of AGI for various income ranges: 12.4% for AGIs below $25k, 30.0% for AGIs $25k-50k, 62.5% for AGIs $50k-75k, 103.3% for AGIs $75k-100k, 201.4% for AGIs $100k-200k, 428.2% for AGIs over 200k)
Self-employed (Keogh) retirement plans: $22,230 (reported on 0.8% of returns)
30312:
$22,230
Georgia:
$27,751
(% of AGI for various income ranges: 9.0% for AGIs $25k-50k, 41.9% for AGIs $100k-200k, 458.2% for AGIs over 200k)
Total itemized deductions: $27,110 (reported on 16.2% of returns)
Here:
$27,110
State:
$34,001
(% of AGI for various income ranges: 31.7% for AGIs below $25k, 124.8% for AGIs $25k-50k, 360.1% for AGIs $50k-75k, 656.3% for AGIs $75k-100k, 1547.6% for AGIs $100k-200k, 6784.4% for AGIs over 200k)
Charity contributions: $6,965 (reported on 12.3% of returns)
Here:
$6,965
State:
$14,164
(% of AGI for various income ranges: 4.3% for AGIs below $25k, 24.4% for AGIs $25k-50k, 67.7% for AGIs $50k-75k, 110.1% for AGIs $75k-100k, 237.3% for AGIs $100k-200k, 1629.7% for AGIs over 200k)
Taxes paid: $8,371 (reported on 16.1% of returns)
30312:
$8,371
State:
$7,540
(% of AGI for various income ranges: 7.9% for AGIs below $25k, 27.7% for AGIs $25k-50k, 108.5% for AGIs $50k-75k, 233.8% for AGIs $75k-100k, 601.9% for AGIs $100k-200k, 1673.8% for AGIs over 200k)
Earned income credit: $2,496 (reported on 17.7% of returns)
Here:
$2,496
State:
$2,530
(% of AGI for various income ranges: 140.0% for AGIs below $25k, 60.9% for AGIs $25k-50k)
Percentage of individuals using paid preparers for their 2020 taxes: 93.5%
Here:
93%
State:
93%
(% for various income ranges: 91.6% for AGIs below $25k, 92.9% for AGIs $25k-50k, 94.4% for AGIs $50k-75k, 93.8% for AGIs $75k-100k, 94.9% for AGIs $100k-200k, 96.9% for AGIs over 200k)
Averages for the 2012 tax year for zip code 30312, filed in 2013:
Average Adjusted Gross Income (AGI) in 2012: $47,740 (Individual Income Tax Returns)
Here:
$47,740
State:
$56,131
Salary/wage: $46,248 (reported on 89.6% of returns)
Here:
$46,248
State:
$47,942
(% of AGI for various income ranges: 83.3% for AGIs below $25k, 91.7% for AGIs $25k-50k, 91.9% for AGIs $50k-75k, 92.4% for AGIs $75k-100k, 87.9% for AGIs $100k-200k, 69.8% for AGIs over 200k)
Taxable interest for individuals: $869 (reported on 19.6% of returns)
This zip code:
$869
Georgia:
$1,706
(% of AGI for various income ranges: 0.4% for AGIs below $25k, 0.2% for AGIs $25k-50k, 0.3% for AGIs $50k-75k, 0.1% for AGIs $75k-100k, 0.5% for AGIs $100k-200k, 0.5% for AGIs over 200k)
Ordinary dividends: $3,941 (reported on 13.4% of returns)
Here:
$3,941
State:
$7,265
(% of AGI for various income ranges: 1.0% for AGIs below $25k, 0.8% for AGIs $25k-50k, 0.9% for AGIs $50k-75k, 0.7% for AGIs $75k-100k, 1.1% for AGIs $100k-200k, 2.2% for AGIs over 200k)
Net capital gain/loss in AGI: +$3,820 (reported on 10.1% of returns)
Here:
+$3,820
State:
+$16,323
(% of AGI for various income ranges: 0.2% for AGIs below $25k, 0.1% for AGIs $25k-50k, 0.4% for AGIs $50k-75k, 0.2% for AGIs $75k-100k, 0.6% for AGIs $100k-200k, 3.7% for AGIs over 200k)
Profit/loss from business: +$8,343 (reported on 22.7% of returns)
Here:
+$8,343
State:
+$7,583
(% of AGI for various income ranges: 9.9% for AGIs below $25k, 2.4% for AGIs $25k-50k, 2.4% for AGIs $50k-75k, 2.4% for AGIs $75k-100k, 3.1% for AGIs $100k-200k, 5.9% for AGIs over 200k)
Taxable individual retirement arrangement distribution: $12,355 (reported on 3.0% of returns)
30312:
$12,355
Georgia:
$17,199
(% of AGI for various income ranges: 0.5% for AGIs below $25k, 0.8% for AGIs $25k-50k, 0.6% for AGIs $50k-75k, 0.4% for AGIs $75k-100k, 1.0% for AGIs $100k-200k, 1.1% for AGIs over 200k)
Self-employment retirement plans: $16,000 (reported on 0.5% of returns)
30312:
$16,000
Georgia:
$23,277
Total itemized deductions: $19,229 (21% of AGI, reported on 31.6% of returns)
Here:
$19,229
State:
$23,886
Here:
21.0% of AGI
State:
21.5% of AGI
(% of AGI for various income ranges: 6.9% for AGIs below $25k, 10.9% for AGIs $25k-50k, 13.2% for AGIs $50k-75k, 14.2% for AGIs $75k-100k, 15.6% for AGIs $100k-200k, 13.0% for AGIs over 200k)
Charity contributions: $3,090 (reported on 25.2% of returns)
Here:
$3,090
State:
$5,507
(% of AGI for various income ranges: 0.7% for AGIs below $25k, 1.8% for AGIs $25k-50k, 1.7% for AGIs $50k-75k, 1.5% for AGIs $75k-100k, 1.6% for AGIs $100k-200k, 2.2% for AGIs over 200k)
Taxes paid: $6,740 (reported on 31.3% of returns)
30312:
$6,740
State:
$7,838
(% of AGI for various income ranges: 1.3% for AGIs below $25k, 2.3% for AGIs $25k-50k, 3.9% for AGIs $50k-75k, 4.9% for AGIs $75k-100k, 6.5% for AGIs $100k-200k, 6.4% for AGIs over 200k)
Earned income credit: $2,483 (reported on 22.9% of returns)
Here:
$2,483
State:
$2,589
(% of AGI for various income ranges: 9.3% for AGIs below $25k, 0.4% for AGIs $25k-50k)
Percentage of individuals using paid preparers for their 2012 taxes: 41.9%
Here:
42%
State:
55%
(% for various income ranges: 42.8% for AGIs below $25k, 37.6% for AGIs $25k-50k, 38.8% for AGIs $50k-75k, 40.2% for AGIs $75k-100k, 49.0% for AGIs $100k-200k, 68.0% for AGIs over 200k)
Averages for the 2004 tax year for zip code 30312, filed in 2005:
Average Adjusted Gross Income (AGI) in 2004: $42,143 (Individual Income Tax Returns)
Here:
$42,143
State:
$47,553
Salary/wage: $40,292 (reported on 91.6% of returns)
Here:
$40,292
State:
$42,178
(% of AGI for various income ranges: 164.4% for AGIs below $10k, 91.6% for AGIs $10k-25k, 95.5% for AGIs $25k-50k, 94.4% for AGIs $50k-75k, 91.4% for AGIs $75k-100k, 72.0% for AGIs over 100k)
Taxable interest for individuals: $687 (reported on 25.7% of returns)
This zip code:
$687
Georgia:
$1,772
(% of AGI for various income ranges: 1.2% for AGIs below $10k, 0.3% for AGIs $10k-25k, 0.4% for AGIs $25k-50k, 0.2% for AGIs $50k-75k, 0.5% for AGIs $75k-100k, 0.5% for AGIs over 100k)
Taxable dividends: $1,218 (reported on 15.1% of returns)
Here:
$1,218
State:
$4,283
(% of AGI for various income ranges: 1.2% for AGIs below $10k, 0.3% for AGIs $10k-25k, 0.3% for AGIs $25k-50k, 0.2% for AGIs $50k-75k, 0.5% for AGIs $75k-100k, 0.7% for AGIs over 100k)
Net capital gain/loss: +$6,608 (reported on 12.7% of returns)
Here:
+$6,608
State:
+$16,461
(% of AGI for various income ranges: -1.8% for AGIs below $10k, 0.4% for AGIs $10k-25k, 0.3% for AGIs $25k-50k, 0.4% for AGIs $50k-75k, 0.9% for AGIs $75k-100k, 5.2% for AGIs over 100k)
Profit/loss from business: +$6,496 (reported on 17.5% of returns)
Here:
+$6,496
State:
+$8,201
(% of AGI for various income ranges: 9.0% for AGIs below $10k, 4.6% for AGIs $10k-25k, 1.7% for AGIs $25k-50k, 2.4% for AGIs $50k-75k, 2.5% for AGIs $75k-100k, 2.8% for AGIs over 100k)
IRA payment deduction: $2,298 (reported on 1.7% of returns)
30312:
$2,298
Georgia:
$2,969
(% of AGI for various income ranges: 0.2% for AGIs $10k-25k, 0.1% for AGIs $25k-50k, 0.1% for AGIs $50k-75k, 0.1% for AGIs $75k-100k, 0.1% for AGIs over 100k)
Self-employed pension: $8,883 (reported on 0.8% of returns)
Here:
$8,883
Georgia:
$16,203
Total itemized deductions: $19,015 (25% of AGI, reported on 36.5% of returns)
Here:
$19,015
State:
$19,944
Here:
24.7% of AGI
State:
22.6% of AGI
(% of AGI for various income ranges: 15.8% for AGIs below $10k, 8.5% for AGIs $10k-25k, 14.5% for AGIs $25k-50k, 19.7% for AGIs $50k-75k, 20.6% for AGIs $75k-100k, 17.1% for AGIs over 100k)
Charity contributions deductions: $2,702 (3% of AGI, reported on 31.2% of returns)
Here:
$2,702
State:
$4,354
Here:
3.4% of AGI
State:
4.7% of AGI
(% of AGI for various income ranges: 1.0% for AGIs below $10k, 1.1% for AGIs $10k-25k, 1.9% for AGIs $25k-50k, 2.2% for AGIs $50k-75k, 2.1% for AGIs $75k-100k, 2.2% for AGIs over 100k)
Total tax: $7,321 (reported on 72.7% of returns)
30312:
$7,321
State:
$8,223
(% of AGI for various income ranges: 4.8% for AGIs below $10k, 4.0% for AGIs $10k-25k, 8.8% for AGIs $25k-50k, 12.2% for AGIs $50k-75k, 13.2% for AGIs $75k-100k, 18.5% for AGIs over 100k)
Earned income credit: $2,025 (reported on 24.9% of returns)
Here:
$2,025
State:
$1,986
Percentage of individuals using paid preparers for their 2004 taxes: 50.0%
Here:
50%
State:
62%
(% for various income ranges: 50.7% for AGIs below $10k, 58.8% for AGIs $10k-25k, 41.5% for AGIs $25k-50k, 43.1% for AGIs $50k-75k, 50.6% for AGIs $75k-100k, 58.3% for AGIs over 100k)
Likely homosexual households (counted as self-reported same-sex unmarried-partner households)
Lesbian couples: 0.2% of all households
Gay men: 0.9% of all households
Household received Food Stamps/SNAP in the past 12 months: 2,950 Household did not receive Food Stamps/SNAP in the past 12 months: 11,787
Women who had a birth in the past 12 months: 223 (181 now married, 41 unmarried) Women who did not have a birth in the past 12 months: 8,353 (1,815 now married, 6,552 unmarried)
Housing units in zip code 30312 with a mortgage: 4,281 (402 second mortgage, 8 home equity loan, 266 both second mortgage and home equity loan) Houses without a mortgage: 58
Median monthly owner costs for units with a mortgage: $2,272 Median monthly owner costs for units without a mortgage: $761
Residents with income below the poverty level in 2022:
This zip code:
21.6%
Whole state:
12.7%
Residents with income below 50% of the poverty level in 2022:
This zip code:
10.4%
Whole state:
6.3%
Median number of rooms in houses and condos:
Here:
5.2
State:
6.8
Median number of rooms in apartments:
Here:
3.5
State:
4.6
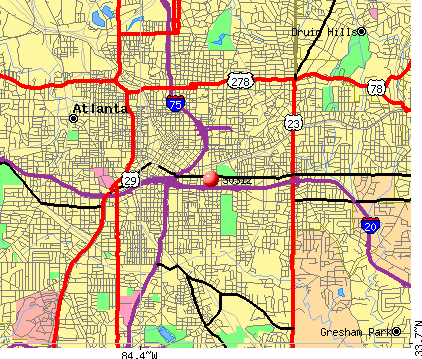
Notable locations in this zip code not listed on our city pages
Notable locations in zip code 30312: King Memorial Station (A), Atlanta Fire / Rescue Station 10 (B), Martin Luther King Junior Community Center (C), Carter Hall (D), Martin Luther King Junior Branch Atlanta-Fulton Public Library (E), Georgia Hill Branch Atlanta-Fulton Library (F), Fulton County Juvenile Court (G), Fire Station Number 5 (H), Dunbar Branch Atlanta-Fulton Library (I), Martin Luther King Junior Center for Nonviolent Social Change (J), Atlanta Fire / Rescue Stations 4 and 6 (K). Display/hide their locations on the map
Churches in zip code 30312 include: Ebenezer Baptist Church (A), Park Avenue Church (B), Welcome Home Baptist Church (C), Silver Leaf Baptist Church (D), Saint Stephens Missionary Baptist Church (E), Rolling Church of God in Christ (F), Our Lady of Lourdes Catholic Church (G), New Zion Hill Baptist Church (H), New Birth Fellowship Church (I). Display/hide their locations on the map
Parks in zip code 30312 include: Dunbar Recreation Center (1), Rawson-Washington Park (2), Martin Luther King Junior Historic District (3), Martin Luther King Junior National Urban Park (4), Martin Luther King Junior National Historic Site (5), Butler Street Park (6), Old Fourth Ward Park (7). Display/hide their locations on the map
Tourist attractions (not listed on the city page) : Atlanta Libraries - Atlanta-Fulton- Georgia-Hill Branch (Cultural Attractions- Events- & Facilities; 250 Georgia Avenue Southeast), U S Government - Department of the Interior- Parks- Interior Dept- National Park Ser (Recreation Areas; 450 Auburn Avenue Northeast).
1,458 married couples with children.
3,294 single-parent households (767 men, 2,527 women).
89.5% of residents of 30312 zip code speak English at home.
3.4% of residents speak Spanish at home (87% very well, 6% well, 3% not well, 4% not at all).
2.3% of residents speak other Indo-European language at home (96% very well, 4% well).
1.8% of residents speak Asian or Pacific Island language at home (61% very well, 27% well, 8% not well, 4% not at all).
2.8% of residents speak other language at home (100% very well).
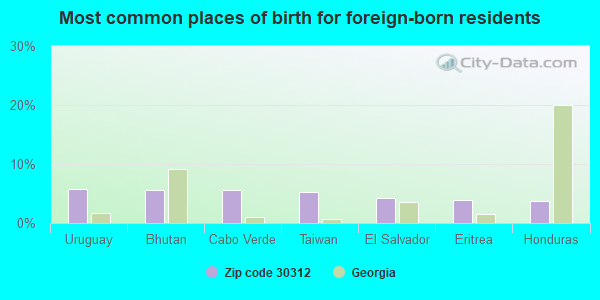
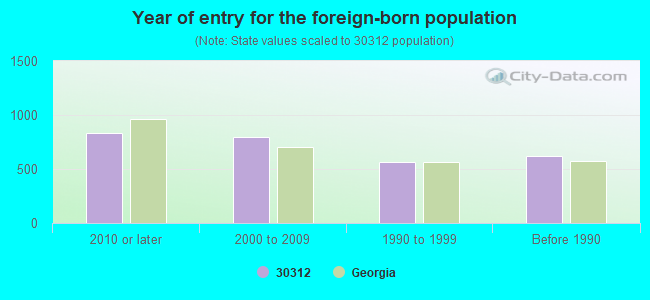
Foreign born population: 2,358 (8.8%) (60.4% of them are naturalized citizens)
Major facilities with environmental interests located in this zip code:
ATLANTA MEDICAL CENTER (303 PARKWAY DR in ATLANTA, GA)
AIR SYNTHETIC MINOR (AIRS/AFS) STATE MASTER (Georgia's Geographic Environmental Information) - UST-006, UNDERGROUND STORAGE TANK PROGRAM, UST-007, UST-008, UST-009, UST-4, UST-5, UST-6, UST-1, UST-3, UST-2, Business SIC classification: GENERAL MEDICAL AND SURGICAL HOSPITALS Organizations: URS CORPORATION (CONTRACTOR)
, WINTER ENVIRONMENTAL (INSTALLER)
AUSTIN T WALDEN MIDDLE SCHOOL (320 IRWIN STREET, NE in ATLANTA, GA)
(Geographic Names Information System) (National Center for Education Statistics) - STATE ID-3068 Organizations: ATLANTA CITY (SCHOOL DISTRICT)
PARKSIDE ELEMENTARY SCHOOL (685 MERCER STREET SE in ATLANTA, GA)
(National Center for Education Statistics) - STATE ID-0101 Organizations: ATLANTA CITY (SCHOOL DISTRICT)
KING MIDDLE SCHOOL (582 CONNALLY STREET, SE in ATLANTA, GA)
(National Center for Education Statistics) - STATE ID-0373 Organizations: ATLANTA CITY (SCHOOL DISTRICT)
APCO USA (388 GRANT STREET SE in ATLANTA, GA)
AIR SYNTHETIC MINOR (AIRS/AFS) ENFORCEMENT/COMPLIANCE ACTIVITY (Integrated Compliance Information System) Small Quantity Generators, between 100 kg and 1000 kg of hazardous waste/month (Resource Conservation and Recovery Act (tracking hazardous waste)) - notification Business SIC classification: SIGNS AND ADVERTISING SPECIALTIES Organizations: OPERNAME (CONTACT/OPERATOR)
, RONALD W COBB (CONTACT/OWNER)
Alternative names: APCO GRAPHICS INC
ATLANTA METAL INC (75 AIRLINE ST SE in ATLANTA, GA)
AIR MINOR (AIRS/AFS) SUPERFUND (Superfund database) Business SIC classification: SCRAP AND WASTE MATERIALS Alternative names: ATLANTA METAL & BATTERY INCORPORATED
BILLY'S BODY & FENDER REPAIR (494 EDGEWOOD AVE NE in ATLANTA, GA)
(Resource Conservation and Recovery Act (tracking hazardous waste)) Organizations: OPERNAME (CONTACT/OPERATOR)
, BRENDA J PATTILLO (CONTACT/OWNER)
CENTURY INKS SLEIGHT & HELLMUTH DIV (126 BAKER ST NE in ATLANTA, GA)
(Resource Conservation and Recovery Act (tracking hazardous waste)) Organizations: HOUSING AUTHORITY-CITY OF ATLANTA (CONTACT/OWNER)
MCDANIEL GLEN (525 WHITE TERRACE SW in ATLANTA, GA)
(Resource Conservation and Recovery Act (tracking hazardous waste)) Organizations: ATLANTA HOUSING AUTHORITY (CONTACT/OWNER)
Housing units lacking complete plumbing facilities: 0.6% Housing units lacking complete kitchen facilities: 0.8%
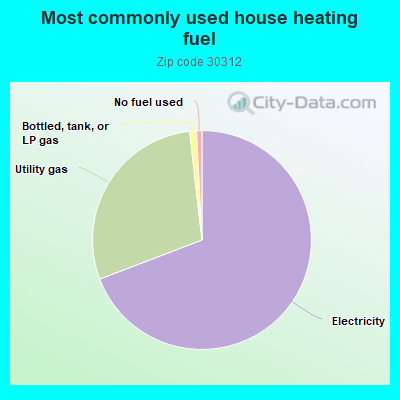
69.2%Electricity
29.0%Utility gas
1.0%Bottled, tank, or LP gas
0.8%No fuel used
Population in 1990: 17,683. Population change in the 1990s: +2,538 (+14.4%).
Place of birth for U.S.-born residents:
This state: 12,954
Northeast: 3,247
Midwest: 2,131
South: 4,342
West: 1,228
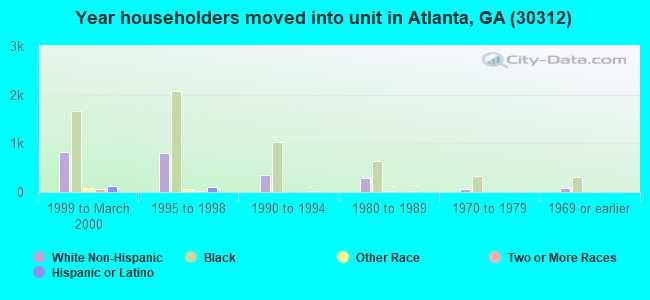
44% of the 30312 zip code residents lived in the same house 5 years ago. Out of people who lived in different houses, 58% lived in this county. Out of people who lived in different counties, 50% lived in Georgia.
80% of the 30312 zip code residents lived in the same house 1 year ago. Out of people who lived in different houses, 36% moved from this county. Out of people who lived in different houses, 25% moved from different county within same state. Out of people who lived in different houses, 35% moved from different state. Out of people who lived in different houses, 4% moved from abroad.
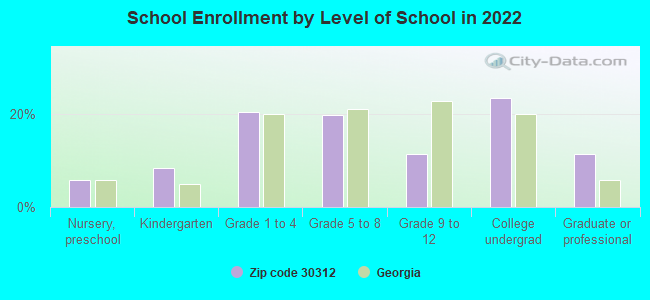
Private vs. public school enrollment:
Students in private schools in grades 1 to 8 (elementary and middle school): 166
Here:
7.1%
Georgia:
12.1%
Students in private schools in grades 9 to 12 (high school): 122
Here:
18.3%
Georgia:
10.8%
Students in private undergraduate colleges: 234
Here:
16.8%
Georgia:
17.1%
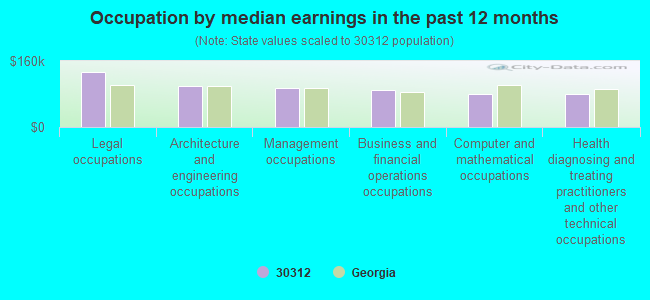
Occupation by median earnings in the past 12 months ($)
132,414Legal occupations
98,193Architecture and engineering occupations
94,344Management occupations
88,500Business and financial operations occupations
80,801Computer and mathematical occupations
80,314Health diagnosing and treating practitioners and other technical occupations
Companies with federal contracts located in this zip code (ATLANTA, GA):
BELL SOUTH TELEPHONE (RUR RTE 85 BOX ANNEX) : $3,110,633 in 33 contractsfrom 1999 to 2003
Contracts for Gas Services, Electric Services, ADP Telecommunications and Transmission Services, Telephone and/or Communications Services (includes Telegraph, Telex, and Cablevision Services), and moreby Bureau of Prisoners/Federal Prison System, Department of Defense, Department of Veterans Affairs, HOUSING AND URBAN DEVELOPMENT, Department of, and others Signed by year:2000: $1,054,000; 2001: $921,480; 2002: $372,865; 2003: $41,288; 2004: $0; 2005: $0; 2006: $0.
Biggest contracts:
$660,000 with Bureau of Prisoners/Federal Prison System for Gas Services. Taking place in MS. Signed on 1999-11-15. Completion date: 2000-09-15.
$558,000 with Bureau of Prisoners/Federal Prison System for Electric Services. Taking place in MS. Signed on 2000-10-15. Completion date: 2001-09-15.
$531,640 with Department of Defense for ADP Telecommunications and Transmission Services. Signed on 2001-04-30. Completion date: 2011-03-23.
$166,630 with Department of Veterans Affairs for Telephone and/or Communications Services (includes Telegraph, Telex, and Cablevision Services). Signed on 2002-10-15. Completion date: 2003-09-15.
JOHNSON RESEARCH AND DEVELOPME (263 DECATUR STREET; small business) : $1,798,736 in 9 contractsfrom 2002 to 2005
Contracts for Other Defense -- Applied Research and Exploratory Development (R&D), Defense Missile and Space Systems -- Applied Research and Exploratory Development (R&D), Defense Missile and Space Systems -- Operational Systems Development (R&D), Defense Aircraft -- Applied Research and Exploratory Development (R&D) by Army, Air Force Signed by year:2000: $0; 2001: $0; 2002: $100,000; 2003: $848,776; 2004: $749,980; 2005: $99,980; 2006: $0.
Biggest contracts:
$453,435 with Army for Other Defense -- Applied Research and Exploratory Development (R&D). Signed on 2003-08-11. Completion date: 2005-08-30.
$375,000 with Air Force for Defense Missile and Space Systems -- Applied Research and Exploratory Development (R&D). Signed on 2004-08-10. Completion date: 2006-12-11.
$296,565 with Army for Other Defense -- Applied Research and Exploratory Development (R&D). Signed on 2003-08-27. Completion date: 2005-08-30.
$217,754 with Air Force for Defense Missile and Space Systems -- Applied Research and Exploratory Development (R&D). Signed on 2004-11-23. Completion date: 2006-12-11.
EXCELLATRON SOLID STATE LLC (263 DECATUR ST SE; small business) : $1,769,402 in 5 contractsfrom 2002 to 2006
Contracts for Defense Missile and Space Systems -- Basic Research (R&D), Defense Aircraft -- Basic Research (R&D), Other Defense -- Applied Research and Exploratory Development (R&D), Other Defense -- Management and Support (R&D) by Missile Defense Agency, Air Force, Army Signed by year:2000: $0; 2001: $0; 2002: $100,000; 2003: $0; 2004: $69,996; 2005: $99,951; 2006: $1,499,455.
Biggest contracts:
$750,000 with Missile Defense Agency for Defense Missile and Space Systems -- Basic Research (R&D). Signed on 2006-04-24. Completion date: 2008-04-15.
$749,455 with Air Force for Defense Aircraft -- Basic Research (R&D). Signed on 2006-06-16. Completion date: 2008-06-21.
$100,000 with Army for Other Defense -- Applied Research and Exploratory Development (R&D). Signed on 2002-03-05. Completion date: 2002-09-30.
$99,951 with Air Force for Defense Aircraft -- Basic Research (R&D). Signed on 2005-06-17. Completion date: 2006-03-21.
SOUTHERN CHRISTIAN LEADERSHIP (591A EDGEWOOD AVE SE; small business) : $34,800 in 5 contractsfrom 2004 to 2006
Contracts for Maintenance, Repair or Alteration of Real Property -- Restoration of real property, Miscellaneous Printed Matter, Advertising Services, , and moreby National Park Service, Army, Assistant Secretary for Administration, NASA, and others Signed by year:2000: $0; 2001: $0; 2002: $0; 2003: $0; 2004: $18,850; 2005: $0; 2006: $15,950.
Biggest contracts:
$10,000 with National Park Service for Maintenance, Repair or Alteration of Real Property -- Restoration of real property. Signed on 2006-07-21. Completion date: 2007-07-20.
$6,900 with Army for Miscellaneous Printed Matter. Signed on 2004-10-27. Completion date: 2004-10-26.
$6,450 with Assistant Secretary for Administration for Advertising Services. Taking place in DC. Signed on 2004-09-15. Completion date: 2004-09-30.
$5,950 with NASA for . Signed on 2006-08-03. Completion date: 2006-09-15.
CAPITOL PLAZA DOWNTOWN, INC (450 CAPITOL AVE)
$3,450 with Army for Lodging - Hotel/Motel. Signed on 2002-09-24. Completion date: 2002-10-05.
Top industries in this zip code by the number of employees in 2005:
Health Care and Social Assistance: General Medical and Surgical Hospitals (over 1000 employees: 1 establishment)
Management of Companies and Enterprises: Corporate, Subsidiary, and Regional Managing Offices (500-999: 1, 1-4: 2)
Accommodation and Food Services: Food Service Contractors (250-499: 1, 100-249: 1, 20-49: 1, 5-9: 1, 1-4: 1)
Health Care and Social Assistance: Nursing Care Facilities (250-499: 1, 100-249: 1)
Health Care and Social Assistance: Offices of Physicians (except Mental Health Specialists) (20-49: 5, 10-19: 8, 5-9: 11, 1-4: 36)
Accommodation and Food Services: Hotels (except Casino Hotels) and Motels (250-499: 1)
2002 - 2018 National Fire Incident Reporting System (NFIRS) incidents
According to the data from the years 2002 - 2018 the average number of fire incidents per year is 79. The highest number of fire incidents - 154 took place in 2016, and the least - 0 in 2004. The data has a declining trend.
When looking into fire subcategories, the most incidents belonged to: Structure Fires (46.4%), and Mobile Property/Vehicle Fires (28.0%).
Fire incident types reported to NFIRS in Zip Code 30312


 Nearest zip codes: 30334, 30303, 30308, 30313, 30315, 30332.
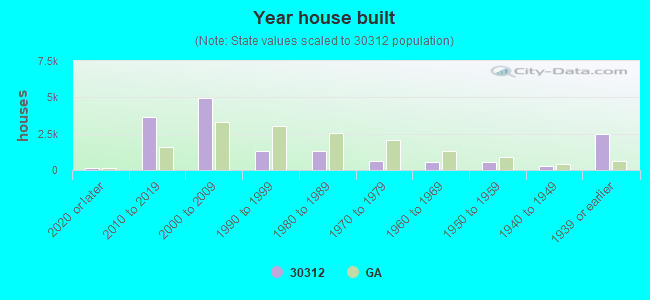


 According to the data from the years 2002 - 2018 the average number of fire incidents per year is 79. The highest number of fire incidents - 154 took place in 2016, and the least - 0 in 2004. The data has a declining trend.
 When looking into fire subcategories, the most incidents belonged to: Structure Fires (46.4%), and Mobile Property/Vehicle Fires (28.0%).