Estimated zip code population in 2022: 35,561 Zip code population in 2010: 33,857 Zip code population in 2000: 40,288
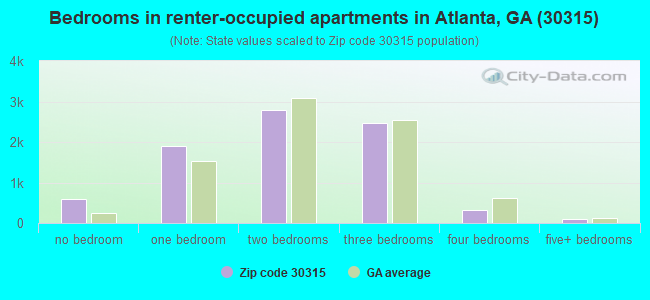
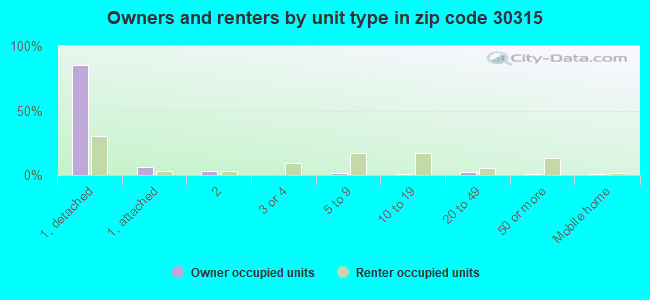
Houses and condos: 15,857 Renter-occupied apartments: 8,135
% of renters here:
60%
State:
34%
March 2022 cost of living index in zip code 30315: 104.4 (near average, U.S. average is 100)
Land area: 11.3 sq. mi. Water area: 0.0 sq. mi.
Population density: 3,143 people per square mile
(average).
OSM Map
General Map
Google Map
MSN Map
OSM Map
General Map
Google Map
MSN Map
OSM Map
General Map
Google Map
MSN Map
OSM Map
General Map
Google Map
MSN Map
Please wait while loading the map...
Real estate property taxes paid for housing units in 2022:
This zip code:
0.6% ($1,837)
Georgia:
0.7% ($2,160)
Median real estate property taxes paid for housing units with mortgages in 2022: $2,310 (0.7%) Median real estate property taxes paid for housing units with no mortgage in 2022: $614 (0.3%)
Averages for the 2020 tax year for zip code 30315, filed in 2021:
Average Adjusted Gross Income (AGI) in 2020: $41,494 (Individual Income Tax Returns)
Here:
$41,494
State:
$70,847
Salary/wage: $39,666 (reported on 84.7% of returns)
Here:
$39,666
State:
$59,126
(% of AGI for various income ranges: 1089.7% for AGIs below $25k, 3387.0% for AGIs $25k-50k, 7798.0% for AGIs $50k-75k, 10971.5% for AGIs $75k-100k, 21125.4% for AGIs $100k-200k, 63596.9% for AGIs over 200k)
Taxable interest for individuals: $466 (reported on 10.5% of returns)
This zip code:
$466
Georgia:
$2,011
(% of AGI for various income ranges: 1.3% for AGIs below $25k, 4.7% for AGIs $25k-50k, 7.1% for AGIs $50k-75k, 16.4% for AGIs $75k-100k, 25.4% for AGIs $100k-200k, 157.7% for AGIs over 200k)
Ordinary dividends: $2,883 (reported on 7.5% of returns)
Here:
$2,883
State:
$8,996
(% of AGI for various income ranges: 2.5% for AGIs below $25k, 6.1% for AGIs $25k-50k, 25.2% for AGIs $50k-75k, 52.8% for AGIs $75k-100k, 160.4% for AGIs $100k-200k, 1145.4% for AGIs over 200k)
Net capital gain/loss in AGI: +$9,925 (reported on 7.7% of returns)
Here:
+$9,925
State:
+$28,402
(% of AGI for various income ranges: 4.3% for AGIs below $25k, 5.3% for AGIs $25k-50k, 46.9% for AGIs $50k-75k, 159.5% for AGIs $75k-100k, 519.4% for AGIs $100k-200k, 5132.3% for AGIs over 200k)
Profit/loss from business: +$2,094 (reported on 29.3% of returns)
Here:
+$2,094
State:
+$6,707
(% of AGI for various income ranges: 61.1% for AGIs below $25k, 9.2% for AGIs $50k-75k, 300.8% for AGIs $75k-100k, 363.5% for AGIs $100k-200k, 2261.5% for AGIs over 200k)
Taxable individual retirement arrangement distribution: $12,672 (reported on 1.8% of returns)
30315:
$12,672
Georgia:
$20,525
(% of AGI for various income ranges: 6.2% for AGIs below $25k, 13.9% for AGIs $25k-50k, 46.9% for AGIs $50k-75k, 120.0% for AGIs $75k-100k, 189.0% for AGIs $100k-200k, 437.7% for AGIs over 200k)
Self-employed (Keogh) retirement plans: $23,433 (reported on 0.2% of returns)
30315:
$23,433
Georgia:
$27,751
(% of AGI for various income ranges: 146.5% for AGIs $100k-200k)
Total itemized deductions: $23,907 (reported on 8.7% of returns)
Here:
$23,907
State:
$34,001
(% of AGI for various income ranges: 20.0% for AGIs below $25k, 136.1% for AGIs $25k-50k, 541.7% for AGIs $50k-75k, 906.9% for AGIs $75k-100k, 1847.7% for AGIs $100k-200k, 4806.2% for AGIs over 200k)
Charity contributions: $7,106 (reported on 6.8% of returns)
Here:
$7,106
State:
$14,164
(% of AGI for various income ranges: 3.2% for AGIs below $25k, 36.3% for AGIs $25k-50k, 144.4% for AGIs $50k-75k, 194.6% for AGIs $75k-100k, 343.8% for AGIs $100k-200k, 1329.2% for AGIs over 200k)
Taxes paid: $7,106 (reported on 8.5% of returns)
30315:
$7,106
State:
$7,540
(% of AGI for various income ranges: 2.5% for AGIs below $25k, 23.1% for AGIs $25k-50k, 136.8% for AGIs $50k-75k, 300.8% for AGIs $75k-100k, 681.0% for AGIs $100k-200k, 1430.0% for AGIs over 200k)
Earned income credit: $2,846 (reported on 39.1% of returns)
Here:
$2,846
State:
$2,530
(% of AGI for various income ranges: 196.7% for AGIs below $25k, 121.4% for AGIs $25k-50k)
Percentage of individuals using paid preparers for their 2020 taxes: 92.0%
Here:
92%
State:
93%
(% for various income ranges: 91.7% for AGIs below $25k, 92.9% for AGIs $25k-50k, 89.1% for AGIs $50k-75k, 91.4% for AGIs $75k-100k, 95.2% for AGIs $100k-200k, 94.3% for AGIs over 200k)
Averages for the 2012 tax year for zip code 30315, filed in 2013:
Average Adjusted Gross Income (AGI) in 2012: $26,383 (Individual Income Tax Returns)
Here:
$26,383
State:
$56,131
Salary/wage: $26,125 (reported on 84.4% of returns)
Here:
$26,125
State:
$47,942
(% of AGI for various income ranges: 79.9% for AGIs below $25k, 90.4% for AGIs $25k-50k, 87.8% for AGIs $50k-75k, 82.6% for AGIs $75k-100k, 86.5% for AGIs $100k-200k, 64.7% for AGIs over 200k)
Taxable interest for individuals: $1,446 (reported on 8.0% of returns)
This zip code:
$1,446
Georgia:
$1,706
(% of AGI for various income ranges: 0.7% for AGIs below $25k, 0.1% for AGIs $25k-50k, 0.4% for AGIs $50k-75k, 0.2% for AGIs $75k-100k, 0.8% for AGIs $100k-200k)
Ordinary dividends: $6,113 (reported on 4.2% of returns)
Here:
$6,113
State:
$7,265
(% of AGI for various income ranges: 0.6% for AGIs below $25k, 0.7% for AGIs $25k-50k, 0.9% for AGIs $50k-75k, 2.2% for AGIs $75k-100k, 1.8% for AGIs $100k-200k, 0.9% for AGIs over 200k)
Net capital gain/loss in AGI: +$2,508 (reported on 2.8% of returns)
Here:
+$2,508
State:
+$16,323
(% of AGI for various income ranges: 0.2% for AGIs $25k-50k, 0.2% for AGIs $50k-75k, 0.9% for AGIs $100k-200k, 0.8% for AGIs over 200k)
Profit/loss from business: +$4,389 (reported on 24.6% of returns)
Here:
+$4,389
State:
+$7,583
(% of AGI for various income ranges: 11.1% for AGIs below $25k, 2.9% for AGIs $75k-100k, 2.2% for AGIs $100k-200k, 1.9% for AGIs over 200k)
Taxable individual retirement arrangement distribution: $9,496 (reported on 1.8% of returns)
30315:
$9,496
Georgia:
$17,199
(% of AGI for various income ranges: 0.5% for AGIs below $25k, 0.7% for AGIs $25k-50k, 1.6% for AGIs $50k-75k, 0.9% for AGIs $100k-200k)
Self-employment retirement plans: $11,650 (reported on 0.1% of returns)
30315:
$11,650
Georgia:
$23,277
Total itemized deductions: $18,443 (26% of AGI, reported on 15.3% of returns)
Here:
$18,443
State:
$23,886
Here:
26.4% of AGI
State:
21.5% of AGI
(% of AGI for various income ranges: 3.2% for AGIs below $25k, 11.7% for AGIs $25k-50k, 16.4% for AGIs $50k-75k, 18.0% for AGIs $75k-100k, 16.7% for AGIs $100k-200k, 15.3% for AGIs over 200k)
Charity contributions: $3,998 (reported on 12.5% of returns)
Here:
$3,998
State:
$5,507
(% of AGI for various income ranges: 0.6% for AGIs below $25k, 2.3% for AGIs $25k-50k, 3.1% for AGIs $50k-75k, 3.4% for AGIs $75k-100k, 2.1% for AGIs $100k-200k, 2.6% for AGIs over 200k)
Taxes paid: $4,843 (reported on 15.0% of returns)
30315:
$4,843
State:
$7,838
(% of AGI for various income ranges: 0.4% for AGIs below $25k, 2.2% for AGIs $25k-50k, 3.9% for AGIs $50k-75k, 4.9% for AGIs $75k-100k, 6.0% for AGIs $100k-200k, 6.0% for AGIs over 200k)
Earned income credit: $2,959 (reported on 46.4% of returns)
Here:
$2,959
State:
$2,589
(% of AGI for various income ranges: 13.8% for AGIs below $25k, 1.5% for AGIs $25k-50k)
Percentage of individuals using paid preparers for their 2012 taxes: 48.2%
Here:
48%
State:
55%
(% for various income ranges: 47.7% for AGIs below $25k, 48.0% for AGIs $25k-50k, 51.3% for AGIs $50k-75k, 53.3% for AGIs $75k-100k, 48.6% for AGIs $100k-200k, 62.5% for AGIs over 200k)
Averages for the 2004 tax year for zip code 30315, filed in 2005:
Average Adjusted Gross Income (AGI) in 2004: $22,540 (Individual Income Tax Returns)
Here:
$22,540
State:
$47,553
Salary/wage: $22,188 (reported on 90.2% of returns)
Here:
$22,188
State:
$42,178
(% of AGI for various income ranges: 84.8% for AGIs below $10k, 89.9% for AGIs $10k-25k, 92.5% for AGIs $25k-50k, 90.0% for AGIs $50k-75k, 86.8% for AGIs $75k-100k, 75.1% for AGIs over 100k)
Taxable interest for individuals: $635 (reported on 11.5% of returns)
This zip code:
$635
Georgia:
$1,772
(% of AGI for various income ranges: 0.5% for AGIs below $10k, 0.2% for AGIs $10k-25k, 0.4% for AGIs $25k-50k, 0.3% for AGIs $50k-75k, 0.3% for AGIs $75k-100k, 0.4% for AGIs over 100k)
Taxable dividends: $1,126 (reported on 4.2% of returns)
Here:
$1,126
State:
$4,283
(% of AGI for various income ranges: 0.1% for AGIs below $10k, 0.0% for AGIs $10k-25k, 0.1% for AGIs $25k-50k, 0.2% for AGIs $50k-75k, 0.2% for AGIs $75k-100k, 1.2% for AGIs over 100k)
Net capital gain/loss: +$2,659 (reported on 3.0% of returns)
Here:
+$2,659
State:
+$16,461
(% of AGI for various income ranges: 0.4% for AGIs below $10k, 0.0% for AGIs $10k-25k, 0.1% for AGIs $25k-50k, 0.4% for AGIs $50k-75k, 0.1% for AGIs $75k-100k, 2.3% for AGIs over 100k)
Profit/loss from business: +$3,912 (reported on 13.7% of returns)
Here:
+$3,912
State:
+$8,201
(% of AGI for various income ranges: 12.0% for AGIs below $10k, 4.4% for AGIs $10k-25k, -0.0% for AGIs $25k-50k, 0.6% for AGIs $50k-75k, 0.2% for AGIs $75k-100k, 1.7% for AGIs over 100k)
IRA payment deduction: $2,000 (reported on 0.7% of returns)
30315:
$2,000
Georgia:
$2,969
Total itemized deductions: $15,159 (31% of AGI, reported on 18.9% of returns)
Here:
$15,159
State:
$19,944
Here:
31.2% of AGI
State:
22.6% of AGI
(% of AGI for various income ranges: 3.5% for AGIs below $10k, 5.8% for AGIs $10k-25k, 15.5% for AGIs $25k-50k, 21.0% for AGIs $50k-75k, 19.1% for AGIs $75k-100k, 17.1% for AGIs over 100k)
Charity contributions deductions: $3,495 (7% of AGI, reported on 16.7% of returns)
Here:
$3,495
State:
$4,354
Here:
7.0% of AGI
State:
4.7% of AGI
(% of AGI for various income ranges: 0.3% for AGIs below $10k, 1.3% for AGIs $10k-25k, 3.3% for AGIs $25k-50k, 4.1% for AGIs $50k-75k, 3.3% for AGIs $75k-100k, 3.3% for AGIs over 100k)
Total tax: $3,021 (reported on 48.6% of returns)
30315:
$3,021
State:
$8,223
(% of AGI for various income ranges: 2.6% for AGIs below $10k, 2.3% for AGIs $10k-25k, 5.5% for AGIs $25k-50k, 9.5% for AGIs $50k-75k, 12.4% for AGIs $75k-100k, 18.3% for AGIs over 100k)
Earned income credit: $2,355 (reported on 53.5% of returns)
Here:
$2,355
State:
$1,986
Percentage of individuals using paid preparers for their 2004 taxes: 64.5%
Here:
65%
State:
62%
(% for various income ranges: 64.2% for AGIs below $10k, 69.4% for AGIs $10k-25k, 59.7% for AGIs $25k-50k, 52.1% for AGIs $50k-75k, 54.8% for AGIs $75k-100k, 53.0% for AGIs over 100k)
Likely homosexual households (counted as self-reported same-sex unmarried-partner households)
Lesbian couples: 0.0% of all households
Gay men: 0.3% of all households
Household received Food Stamps/SNAP in the past 12 months: 5,226 Household did not receive Food Stamps/SNAP in the past 12 months: 8,730
Women who had a birth in the past 12 months: 758 (225 now married, 531 unmarried) Women who did not have a birth in the past 12 months: 8,726 (1,648 now married, 7,096 unmarried)
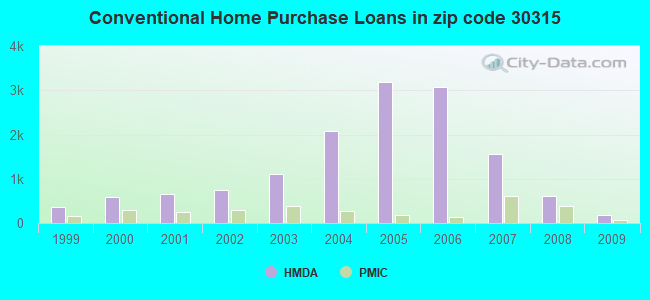
Housing units in zip code 30315 with a mortgage: 3,631 (288 second mortgage, 20 home equity loan, 210 both second mortgage and home equity loan) Houses without a mortgage: 35
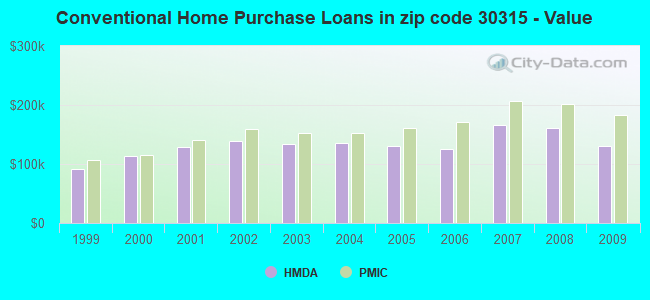
Median monthly owner costs for units with a mortgage: $1,485 Median monthly owner costs for units without a mortgage: $443
Residents with income below the poverty level in 2022:
This zip code:
31.2%
Whole state:
12.7%
Residents with income below 50% of the poverty level in 2022:
This zip code:
14.0%
Whole state:
6.3%
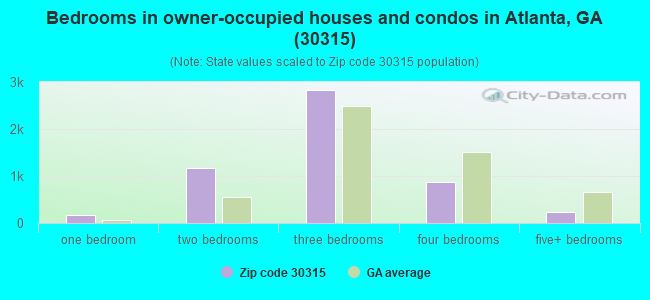
Median number of rooms in houses and condos:
Here:
6.0
State:
6.8
Median number of rooms in apartments:
Here:
4.5
State:
4.6
Notable locations in this zip code not listed on our city pages
Notable locations in zip code 30315: Atlanta Fire / Rescue Station 02 (A), Cleveland Avenue Library (B), Atlanta Fire / Rescue Training Academy (C), Atlanta Precinct Number 3 Fire Station (D), Stewart Lakewood Branch Atlanta-Fulton Library (E), United States Penitentiary - Atlanta (F). Display/hide their locations on the map
Churches in zip code 30315 include: Brown Mill Park Church (A), Hammond Park Church (B), Mount Carmel Church (C), Mount Nebo Church (D), Mount Zion Church (E), New Hope Church (F), Victory Baptist Church (G), True Light Mission (H), Thankful Baptist Church (I). Display/hide their locations on the map
Parks in zip code 30315 include: Benteen Park (1), Joyland Park (2), Grant Park Historic District (3), Zoo Atlanta (4), Avery Park (5), Lakewood Park (6), Dainiel Stanton Park (7), Four Corners Park (8), Lakewood Stadium (9). Display/hide their locations on the map
1,798 married couples with children.
5,347 single-parent households (380 men, 4,967 women).
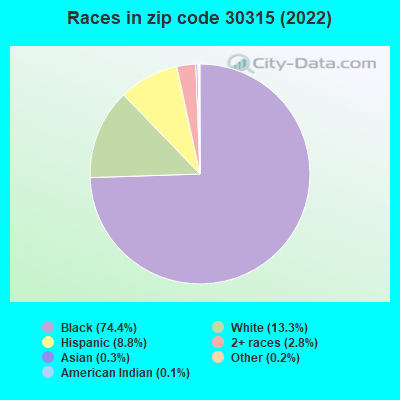
90.5% of residents of 30315 zip code speak English at home.
7.2% of residents speak Spanish at home (49% very well, 26% well, 13% not well, 11% not at all).
1.2% of residents speak other Indo-European language at home (73% very well, 20% well, 7% not well).
0.3% of residents speak Asian or Pacific Island language at home (45% very well, 4% well, 51% not at all).
0.4% of residents speak other language at home (100% very well).
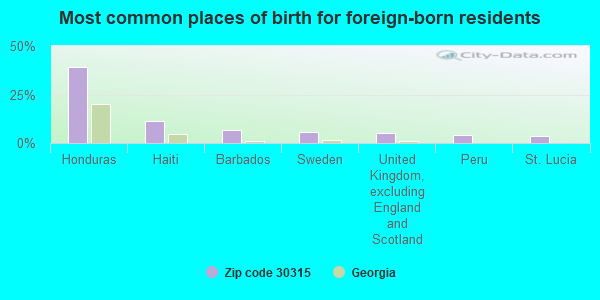
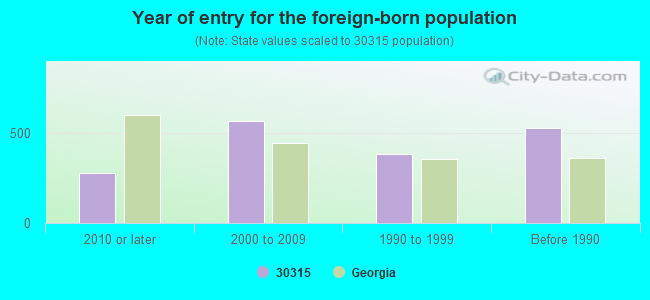
Foreign born population: 1,599 (4.5%) (48.8% of them are naturalized citizens)
Major facilities with environmental interests located in this zip code:
OVERNITE TRANSPORTATION CO (2427 MORELAND AVE SE in ATLANTA, GA)
STATE MASTER (Georgia's Geographic Environmental Information) - UST-10, UNDERGROUND STORAGE TANK PROGRAM, UST-11, UST-12, UST-2, UST-5, UST-6, UST-7, UST-8, UST-3, UST-1, UST-4, Small Quantity Generators, between 100 kg and 1000 kg of hazardous waste/month (Resource Conservation and Recovery Act (tracking hazardous waste)) - notification Organizations: OPERNAME (CONTACT/OPERATOR)
, UPS FREIGHT (CONTACT/OPERATOR)
, OVERNITE TRANS CO (CONTACT/OWNER)
, UPS GROUND FREIGHT INC (CONTACT/OWNER)
, E & B CONSTRUCTION COMPANY (INSTALLER)
EXXON RAS 47333 (180 UNIVERSITY AVE in ATLANTA, GA)
STATE MASTER (Georgia's Geographic Environmental Information) - UST-1, UNDERGROUND STORAGE TANK PROGRAM, UST-3, UST-4, UST-2, Conditionally Exempt Small Quantity Generators, less than 100 kg/month of hazardous waste (Resource Conservation and Recovery Act (tracking hazardous waste)) - notification Organizations: INTEGRATED SCIENCE & TECHNOLOGY INC (CONTACT/AGENT)
, EXXON MOBIL CORPORATION (CONTACT/OPERATOR)
, EXXON MOBIL (CONTACT/OWNER)
Alternative names: EXXON FOOD STORE, EXXON R/S #47333
ATLANTA PUBLIC SCHOOLS TRANSPORT (1661 STEWART AVE SW in ATLANTA, GA)
STATE MASTER (Georgia's Geographic Environmental Information) - UST-157-01, UNDERGROUND STORAGE TANK PROGRAM, UST-157-02, UST-157-03, UST-157-05, UST-157-6, UST-157-04, UST-157-7, Conditionally Exempt Small Quantity Generators, less than 100 kg/month of hazardous waste (Resource Conservation and Recovery Act (tracking hazardous waste)) Organizations: OPERNAME (CONTACT/OPERATOR)
, BOARD OF ED-CITY OF ATLANTA (CONTACT/OWNER)
, AAA TANK TESTERS (INSTALLER)
Alternative names: ATLANTA PUBLIC SCHOOLS-TRANS FAC
MANDERS PREMIER (1040 GRANT STREET in ATLANTA, GA)
AIR MINOR (AIRS/AFS) HAZARDOUS WASTE BIENNIAL REPORTER (Resource Conservation and Recovery Act (tracking hazardous waste)) (Resource Conservation and Recovery Act (tracking hazardous waste)) TRI REPORTER (Tracking of toxic chemicals releasing facilities) Business SIC classification: PRINTING INK Organizations: OPERNAME (CONTACT/OPERATOR)
, MANDERS PREMIER INC (CONTACT/OWNER)
Alternative names: CRODA INKS CORP.
PRECISION TUNE (2070 STEWART AVENUE in ATLANTA, GA)
AIR MINOR (AIRS/AFS) (Integrated Compliance Information System) - ICIS-04-1997-0483, FORMAL ENFORCEMENT ACTION Business SIC classification: GENERAL AUTOMOTIVE REPAIR SHOPS
CARVER HIGH SCHOOL (1275 CAPITOL AVENUE, SW in ATLANTA, GA)
(Geographic Names Information System) (National Center for Education Statistics) - STATE ID-3055 Organizations: ATLANTA CITY (SCHOOL DISTRICT)
LAKEWOOD ELEMENTARY SCHOOL (335 SAWTELL AVENUE, SE in ATLANTA, GA)
(Geographic Names Information System) (National Center for Education Statistics) - STATE ID-2064 Organizations: ATLANTA CITY (SCHOOL DISTRICT)
PRICE MIDDLE SCHOOL (1670 CAPITOL AVENUE, SE in ATLANTA, GA)
(Geographic Names Information System) (National Center for Education Statistics) - STATE ID-0288 Organizations: ATLANTA CITY (SCHOOL DISTRICT)
MCGILL ELEMENTARY SCHOOL (760 MARTIN STREET, SE in ATLANTA, GA)
(Geographic Names Information System) (National Center for Education Statistics) - STATE ID-0473 Organizations: ATLANTA CITY (SCHOOL DISTRICT)
ATLANTA FILM CONVERTI (1132 PRYOR RD SW in ATLANTA, GA)
AIR MAJOR (AIRS/AFS) CRITERIA AND HAZARDOUS AIR POLLUTANT INVENTORY (Inventory of air pollution sources) HAZARDOUS WASTE BIENNIAL REPORTER (Resource Conservation and Recovery Act (tracking hazardous waste)) (Resource Conservation and Recovery Act (tracking hazardous waste)) Business NAICS classification: OTHER COMMERCIAL PRINTING. Organizations: OPERNAME (CONTACT/OPERATOR)
, MITCHELL G J (CONTACT/OWNER)
Alternative names: ATLANTA FILM CONVERTING CO INC
PERKERSON ELEMENTARY SCHOOL (2895 LAKEWOOD AVENUE, SW in ATLANTA, GA)
(National Center for Education Statistics) - STATE ID-0296 Organizations: ATLANTA CITY (SCHOOL DISTRICT)
NEIGHBORHOOD CHARTER SCHOOL (688 GRANT STREET, SE in ATLANTA, GA)
(National Center for Education Statistics) - STATE ID-0603 Organizations: ATLANTA CITY (SCHOOL DISTRICT)
CLEVELAND ELEMENTARY SCHOOL (2672 OLD HAPEVILLE ROAD in ATLANTA, GA)
(National Center for Education Statistics) - STATE ID-4056 Organizations: ATLANTA CITY (SCHOOL DISTRICT)
Housing units lacking complete plumbing facilities: 3.0% Housing units lacking complete kitchen facilities: 4.6%
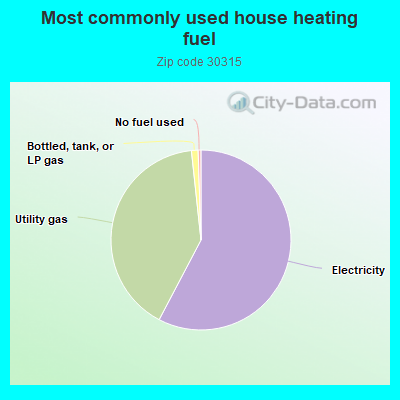
57.7%Electricity
40.6%Utility gas
1.2%Bottled, tank, or LP gas
0.5%No fuel used
Population in 1990: 41,061.
Place of birth for U.S.-born residents:
This state: 22,431
Northeast: 3,005
Midwest: 2,160
South: 4,982
West: 994
52% of the 30315 zip code residents lived in the same house 5 years ago. Out of people who lived in different houses, 65% lived in this county. Out of people who lived in different counties, 50% lived in Georgia.
85% of the 30315 zip code residents lived in the same house 1 year ago. Out of people who lived in different houses, 46% moved from this county. Out of people who lived in different houses, 39% moved from different county within same state. Out of people who lived in different houses, 10% moved from different state. Out of people who lived in different houses, 0% moved from abroad.
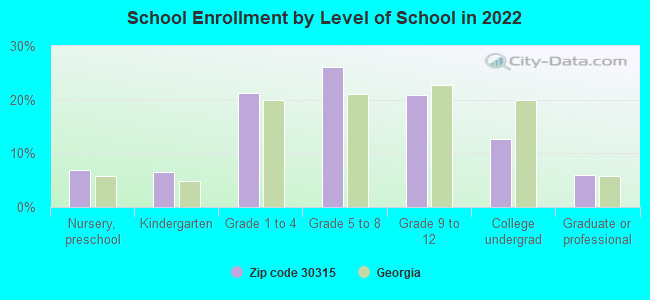
Private vs. public school enrollment:
Students in private schools in grades 1 to 8 (elementary and middle school): 430
Here:
11.6%
Georgia:
12.1%
Students in private schools in grades 9 to 12 (high school): 59
Here:
3.6%
Georgia:
10.8%
Students in private undergraduate colleges: 119
Here:
12.1%
Georgia:
17.1%
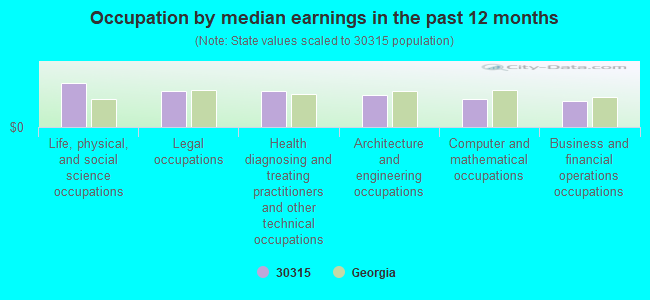
Occupation by median earnings in the past 12 months ($)
116,569Life, physical, and social science occupations
96,020Legal occupations
95,238Health diagnosing and treating practitioners and other technical occupations
84,218Architecture and engineering occupations
73,829Computer and mathematical occupations
69,504Business and financial operations occupations
Companies with federal contracts located in this zip code (ATLANTA, GA):
BHAGYAWANTI, INC (759 POLLARD BOULEVARD S W; small business) : $101,631 in 4 contractsin 2005
$51,153 with Army for Lodging - Hotel/Motel. Signed on 2005-02-03. Completion date: 2005-03-04.
$34,928, same as above.Signed on 2005-04-07. Completion date: 2005-04-21.
$15,400, same as above.Signed on 2005-02-17. Completion date: 2005-03-04.
$150, same as above.Signed on 2005-09-18. Completion date: 2005-03-04.
BOB SHELLEY'S SPECIAL EFFECTS (2000 LAKEWOOD AVE SE; small business) : $97,245 in 8 contractsfrom 2003 to 2005
Contracts for Miscellaneous Items, Facilities Operations Support Services, Miscellaneous Fire Control Equipment, Technical Representation Services -- Training Aids and Devices, and moreby Army Signed by year:2000: $0; 2001: $0; 2002: $0; 2003: $31,330; 2004: $19,259; 2005: $46,656; 2006: $0.
Biggest contracts:
$31,330 with Army for Miscellaneous Items. Signed on 2003-07-08. Completion date: 2003-07-09.
$19,259 with Army for Facilities Operations Support Services. Signed on 2004-05-19. Completion date: 2004-07-01.
$19,259 with Army for Miscellaneous Fire Control Equipment. Signed on 2004-09-25. Completion date: 2004-07-01.
$19,258 with Army for Technical Representation Services -- Training Aids and Devices. Signed on 2005-04-28. Completion date: 2005-08-05.
W W WILLIAMS SOUTHEAST INC (2849 MORELAND AVE SE) : $90,970 in 3 contractsin 2005
$55,403 with Army for Diesel Engines and Components. Signed on 2005-09-22. Completion date: 2005-09-26.
$20,118, same as above.Signed on 2005-03-22. Completion date: 2005-05-02.
$15,449 with Navy for Diesel Engines and Components. Signed on 2005-06-01. Completion date: 2005-07-13.
SOUTHEASTERN STAGES INC (260 UNIVERSITY AVE SW; small business) : $13,869 in 2 contractsfrom 2004 to 2006
$10,944 with Air Force for Other Professional Services. Taking place in AL. Signed on 2006-05-24. Completion date: 2006-06-23.
$2,925 with Army for Passenger Motor Charter Service. Signed on 2004-07-12. Completion date: 2004-07-21.
ESSENTIAL EQUIPMENT COMPANY (2150 VERBENA ST NW # 7; small business)
$6,890 with Navy for Miscellaneous Construction Materials. Signed on 2005-09-17. Completion date: 2005-10-05.
Top industries in this zip code by the number of employees in 2005:
2002 - 2018 National Fire Incident Reporting System (NFIRS) incidents
According to the data from the years 2002 - 2018 the average number of fires per year is 181. The highest number of fire incidents - 377 took place in 2002, and the least - 0 in 2004. The data has a declining trend.
When looking into fire subcategories, the most incidents belonged to: Structure Fires (44.8%), and Outside Fires (29.6%).
Fire incident types reported to NFIRS in Zip Code 30315

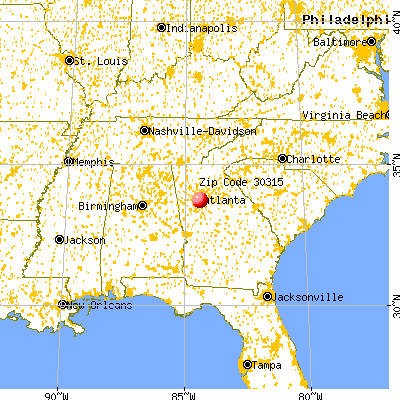


 Nearest zip codes: 30354, 30312, 30334, 30310, 30303, 30316.


 According to the data from the years 2002 - 2018 the average number of fires per year is 181. The highest number of fire incidents - 377 took place in 2002, and the least - 0 in 2004. The data has a declining trend.
 When looking into fire subcategories, the most incidents belonged to: Structure Fires (44.8%), and Outside Fires (29.6%).