East Point, Georgia

East Point: East Point City Hall
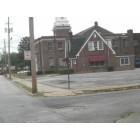
East Point: Church Street & Washington Avenue
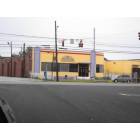
East Point: Main Street & Willingham Drive
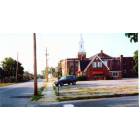
East Point: Downtown East Point
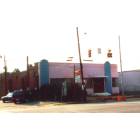
East Point: East Point's Main St.
- add
your
Submit your own pictures of this city and show them to the world
- OSM Map
- General Map
- Google Map
- MSN Map
Population change since 2000: -3.1%
| Males: 18,030 | |
| Females: 20,350 |
| Median resident age: | 35.0 years |
| Georgia median age: | 37.6 years |
Zip codes: 30344.
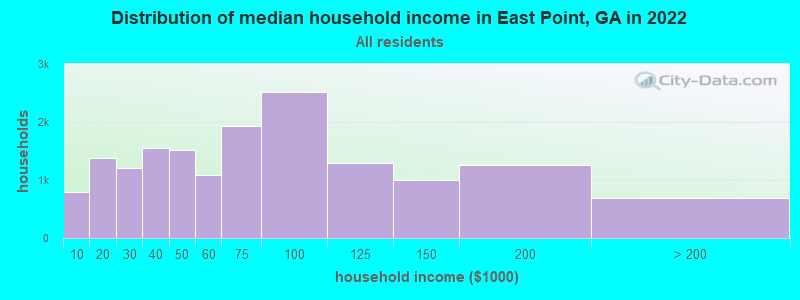
| East Point: | $62,420 |
| GA: | $72,837 |
Estimated per capita income in 2022: $34,459 (it was $15,175 in 2000)
East Point city income, earnings, and wages data
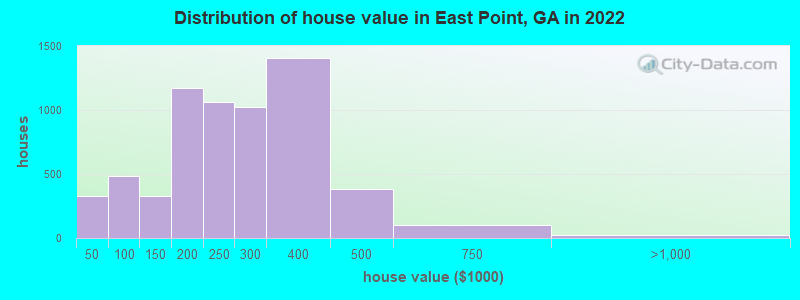
Estimated median house or condo value in 2022: $243,924 (it was $86,600 in 2000)
| East Point: | $243,924 |
| GA: | $297,400 |
Mean prices in 2022: all housing units: $251,540; detached houses: $261,621; townhouses or other attached units: $179,132; in 2-unit structures: $202,705; in 5-or-more-unit structures: $184,849; mobile homes: $37,952
Median gross rent in 2022: $1,315.
(11.3% for White Non-Hispanic residents, 21.4% for Black residents, 28.5% for Hispanic or Latino residents, 4.9% for American Indian residents, 27.9% for other race residents, 9.2% for two or more races residents)
Detailed information about poverty and poor residents in East Point, GA


Compare current foreclosures near East Point, GA:
| Photo | Address | Area | Beds / Baths | Price | Details |
|---|---|---|---|---|---|

|
#1
Clay Rd
Austell, GA 30106
|
1,412 sq. feet
|
2 baths 3 beds |
$290,000
|
show details |

|
#2
Charlotte Blvd
Stockbridge, GA 30281
|
2,200 sq. feet
|
2 baths 3 beds |
$290,000
|
show details |

|
#3
Westmont Rd SW
Atlanta, GA 30311
|
1,338 sq. feet
|
1 baths 2 beds |
$190,000
|
show details |

|
#4
Bell Flower Ct
Stone Mountain, GA 30088
|
- sq. feet
|
2 baths 4 beds |
$249,900
|
show details |

|
#5
Peachtree St NE Unit 3415
Atlanta, GA 30309
|
2,416 sq. feet
|
3 baths 3 beds |
show details | |

|
#6
Vining Ridge Ter
Decatur, GA 30034
|
1,590 sq. feet
|
2 baths 2 beds |
show details | |

|
#7
Coventry Rd Apt 11b
Decatur, GA 30030
|
923 sq. feet
|
1 baths 2 beds |
show details | |

|
#8
Ivy Ridge Dr SE
Atlanta, GA 30339
|
1,709 sq. feet
|
2 baths 2 beds |
show details | |

|
#9
Peachtree Road NE
Atlanta, GA 30309
|
741 sq. feet
|
1 baths 1 beds |
show details | |

|
#10
Grant Cir SE Unit 404
Atlanta, GA 30315
|
1,250 sq. feet
|
2 baths 2 beds |
show details |
| Photo | Address | Area | Beds / Baths | Price | Details |
|---|---|---|---|---|---|

|
#11
Mayson Turner Rd NW Unit 1419
Atlanta, GA 30314
|
872 sq. feet
|
1 baths 2 beds |
show details | |

|
#12
Saint David St
Fairburn, GA 30213
|
1,855 sq. feet
|
2 baths 3 beds |
show details | |

|
#13
Bayrose Cir
Atlanta, GA 30344
|
1,326 sq. feet
|
3 baths 3 beds |
show details | |

|
#14
Whitehall Forest Ct SE
Atlanta, GA 30316
|
1,344 sq. feet
|
2 baths 3 beds |
show details | |

|
#15
Caroline St NE Apt 203
Atlanta, GA 30307
|
1,072 sq. feet
|
1 baths 1 beds |
show details | |

|
#16
Milam Dr
Ellenwood, GA 30294
|
3,266 sq. feet
|
4 baths 5 beds |
show details | |

|
#17
Browns Mill Rd SE
Atlanta, GA 30354
|
- sq. feet
|
2 baths 3 beds |
show details | |

|
#18
Farmbrook Pkwy
Stockbridge, GA 30281
|
1,498 sq. feet
|
2 baths 3 beds |
show details | |

|
#19
Carissa Ct
Ellenwood, GA 30294
|
3,108 sq. feet
|
4 baths 4 beds |
show details | |

|
#20
Vista Creek Dr
Stockbridge, GA 30281
|
2,935 sq. feet
|
4 baths 5 beds |
show details |
| Photo | Address | Area | Beds / Baths | Price | Details |
|---|---|---|---|---|---|

|
#21
Cornell Dr
Jonesboro, GA 30238
|
1,275 sq. feet
|
2 baths 4 beds |
show details | |

|
#22
Fairburn Rd SW
Atlanta, GA 30331
|
2,624 sq. feet
|
2 baths 3 beds |
show details | |

|
#23
W Peachtree Pl NW Unit 302
Atlanta, GA 30313
|
1,380 sq. feet
|
2 baths 2 beds |
show details | |

|
#24
Salisbury Trl
Riverdale, GA 30296
|
1,152 sq. feet
|
2 baths 3 beds |
show details | |

|
#25
Elmscourt Dr
Stone Mountain, GA 30083
|
1,954 sq. feet
|
2 baths 4 beds |
show details | |

|
#26
Candace Ln SE
Atlanta, GA 30316
|
1,897 sq. feet
|
2 baths 3 beds |
show details | |

|
#27
Bentley Trace Mnr
Atlanta, GA 30327
|
4,305 sq. feet
|
5 baths 5 beds |
show details | |

|
#28
Browns Mill Rd SE
Atlanta, GA 30354
|
1,326 sq. feet
|
1 baths 3 beds |
show details | |

|
#29
Ohara Dr
Jonesboro, GA 30236
|
1,008 sq. feet
|
2 baths 2 beds |
show details | |

|
#30
Sourwood Ct
Jonesboro, GA 30238
|
- sq. feet
|
3 baths 4 beds |
show details |
| Photo | Address | Area | Beds / Baths | Price | Details |
|---|---|---|---|---|---|

|
#31
Bowen Cir SW
Atlanta, GA 30315
|
2,100 sq. feet
|
2 baths 3 beds |
show details | |

|
#32
Gable Ter
Jonesboro, GA 30236
|
1,970 sq. feet
|
2 baths 4 beds |
show details | |

|
#33
Peachtree St NE Apt 729
Atlanta, GA 30309
|
1,260 sq. feet
|
1 baths 1 beds |
show details | |

|
#34
Olympian Way SW
Atlanta, GA 30310
|
1,874 sq. feet
|
2 baths 3 beds |
show details | |

|
#35
Pahaska Ct
Ellenwood, GA 30294
|
2,836 sq. feet
|
3 baths 5 beds |
show details | |

|
#36
Platte Dr
Ellenwood, GA 30294
|
3,438 sq. feet
|
3 baths 5 beds |
show details | |

|
#37
Gretna Green Way
Decatur, GA 30035
|
2,100 sq. feet
|
2 baths 3 beds |
show details | |

|
#38
Linda Way SW
Atlanta, GA 30310
|
924 sq. feet
|
1 baths 2 beds |
show details | |

|
#39
Joe Louis Dr NW
Atlanta, GA 30314
|
972 sq. feet
|
2 baths 3 beds |
show details | |

|
#40
Ellington St
Decatur, GA 30032
|
1,424 sq. feet
|
1 baths 3 beds |
show details |
| Photo | Address | Area | Beds / Baths | Price | Details |
|---|---|---|---|---|---|

|
#41
Rollingwood Dr SE
Atlanta, GA 30316
|
1,620 sq. feet
|
2 baths 4 beds |
show details | |

|
#42
Ezra Church Dr NW
Atlanta, GA 30314
|
1,224 sq. feet
|
1 baths 3 beds |
show details | |

|
#43
Highgreen Trl
Atlanta, GA 30349
|
2,913 sq. feet
|
4 baths 4 beds |
show details | |

|
#44
Somerlane Trl
Atlanta, GA 30349
|
7,505 sq. feet
|
4 baths 5 beds |
show details | |

|
#45
Clifton Rd SE
Atlanta, GA 30316
|
1,128 sq. feet
|
1 baths 3 beds |
show details | |

|
#46
Valley Hill Dr SW
Mableton, GA 30126
|
1,468 sq. feet
|
2 baths 3 beds |
show details | |

|
#47
Roswell Road NE Apartment
Atlanta, GA 30342
|
1,051 sq. feet
|
1 baths 2 beds |
show details | |

|
#48
Canberra Dr
Stone Mountain, GA 30088
|
1,812 sq. feet
|
2 baths 3 beds |
show details | |

|
#49
Irish Red Ct
Union City, GA 30291
|
4,214 sq. feet
|
4 baths 4 beds |
show details | |

|
Check over 1 million property listings on Foreclosure.com!
|
browse all offers | |||


- 28,89674.9%Black alone
- 4,54211.8%White alone
- 3,3718.7%Hispanic
- 8892.3%Two or more races
- 5741.5%Asian alone
- 1710.4%Other race alone
- 130.03%American Indian alone
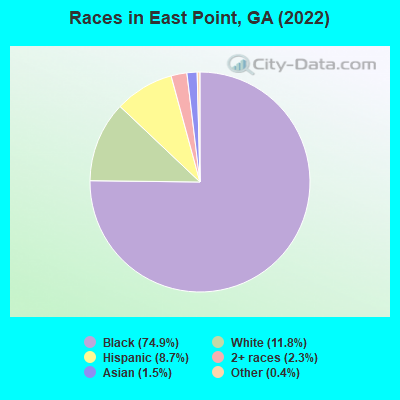
Races in East Point detailed stats: ancestries, foreign born residents, place of birth
According to our research of Georgia and other state lists, there were 103 registered sex offenders living in East Point, Georgia as of April 27, 2024.
The ratio of all residents to sex offenders in East Point is 354 to 1.
The ratio of registered sex offenders to all residents in this city is near the state average.
Type |
2009 |
2010 |
2011 |
2012 |
2013 |
2014 |
2015 |
2016 |
2017 |
2018 |
2019 |
2020 |
2021 |
2022 |
|---|---|---|---|---|---|---|---|---|---|---|---|---|---|---|
| Murders (per 100,000) | 6 (13.7) | 7 (20.8) | 3 (8.8) | 12 (34.1) | 12 (33.2) | 6 (16.7) | 4 (11.1) | 10 (27.9) | 8 (22.4) | 5 (14.1) | 10 (28.6) | 18 (51.4) | 5 (14.2) | 20 (52.5) |
| Rapes (per 100,000) | 21 (48.0) | 15 (44.5) | 9 (26.3) | 13 (37.0) | 12 (33.2) | 20 (55.7) | 18 (50.1) | 15 (41.9) | 23 (64.4) | 23 (64.8) | 19 (54.3) | 3 (8.6) | 0 (0.0) | 4 (10.5) |
| Robberies (per 100,000) | 253 (578.2) | 205 (608.1) | 236 (690.9) | 268 (762.3) | 252 (696.7) | 273 (759.8) | 219 (610.1) | 224 (625.9) | 222 (621.2) | 175 (493.2) | 147 (419.9) | 0 (0.0) | 1 (2.8) | 1 (2.6) |
| Assaults (per 100,000) | 153 (349.7) | 132 (391.6) | 146 (427.5) | 128 (364.1) | 144 (398.1) | 165 (459.2) | 166 (462.4) | 173 (483.4) | 214 (598.8) | 238 (670.7) | 199 (568.5) | 0 (0.0) | 2 (5.7) | 0 (0.0) |
| Burglaries (per 100,000) | 1,113 (2,544) | 1,228 (3,643) | 1,163 (3,405) | 1,029 (2,927) | 938 (2,593) | 935 (2,602) | 808 (2,251) | 637 (1,780) | 483 (1,351) | 531 (1,496) | 414 (1,183) | 0 (0.0) | 0 (0.0) | 0 (0.0) |
| Thefts (per 100,000) | 1,827 (4,176) | 1,955 (5,799) | 1,799 (5,267) | 2,018 (5,740) | 2,221 (6,140) | 2,275 (6,332) | 2,342 (6,524) | 2,474 (6,912) | 3,160 (8,842) | 3,145 (8,863) | 2,089 (5,968) | 0 (0.0) | 0 (0.0) | 0 (0.0) |
| Auto thefts (per 100,000) | 437 (998.8) | 461 (1,367) | 575 (1,683) | 772 (2,196) | 746 (2,062) | 546 (1,520) | 666 (1,855) | 582 (1,626) | 493 (1,379) | 584 (1,646) | 426 (1,217) | 0 (0.0) | 0 (0.0) | 0 (0.0) |
| Arson (per 100,000) | 6 (13.7) | 6 (17.8) | 1 (2.9) | 3 (8.5) | 1 (2.8) | 2 (5.6) | 3 (8.4) | 3 (8.4) | 0 (0.0) | 0 (0.0) | 0 (0.0) | 0 (0.0) | 0 (0.0) | 0 (0.0) |
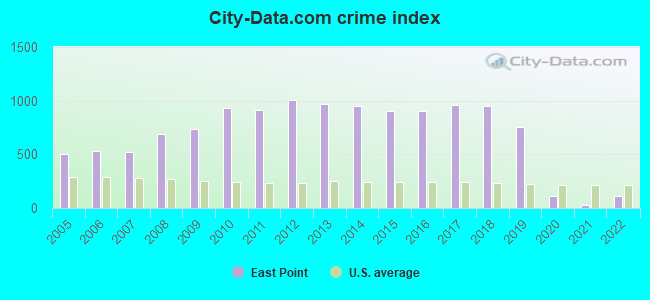
| City-Data.com crime index | 734.2 | 934.2 | 915.1 | 1009.6 | 973.6 | 954.7 | 904.8 | 905.0 | 961.0 | 953.0 | 759.1 | 109.7 | 30.4 | 114.2 |
The City-Data.com crime index weighs serious crimes and violent crimes more heavily. Higher means more crime, U.S. average is 246.1. It adjusts for the number of visitors and daily workers commuting into cities.
Crime rate in East Point detailed stats: murders, rapes, robberies, assaults, burglaries, thefts, arson
Full-time law enforcement employees in 2021, including police officers: 109 (72 officers - 50 male; 22 female).
| Officers per 1,000 residents here: | 2.05 |
| Georgia average: | 2.45 |
 Recent articles from our blog. Our writers, many of them Ph.D. graduates or candidates, create easy-to-read articles on a wide variety of topics.


Latest news from East Point, GA collected exclusively by city-data.com from local newspapers, TV, and radio stations
Ancestries: American (2.4%), African (2.1%).
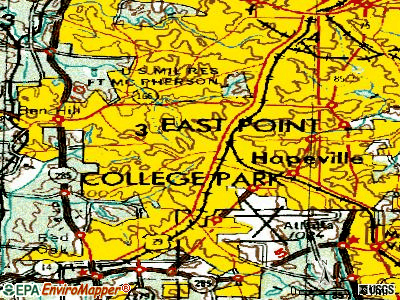
Current Local Time: EST time zone
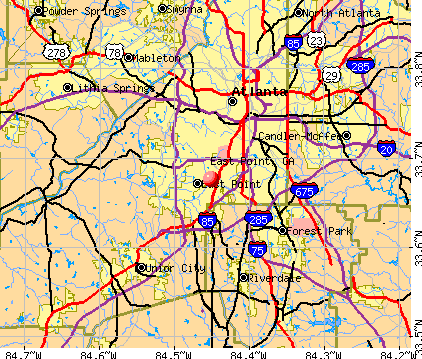
Elevation: 1020 feet
Land area: 13.8 square miles.
Population density: 2,791 people per square mile (average).
2,518 residents are foreign born (3.0% Latin America, 1.7% Africa, 1.1% Asia).
| This city: | 6.5% |
| Georgia: | 10.4% |
Median real estate property taxes paid for housing units with mortgages in 2022: $1,453 (0.6%)
Median real estate property taxes paid for housing units with no mortgage in 2022: $1,265 (0.6%)
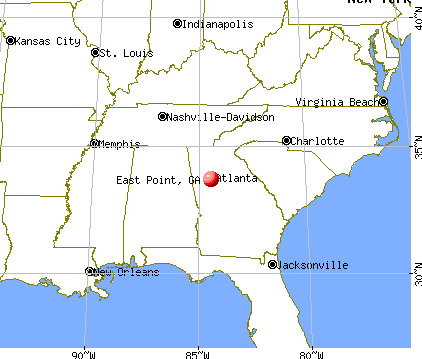
Nearest city with pop. 50,000+: Atlanta, GA  (6.4 miles , pop. 416,474).
Nearest city with pop. 1,000,000+: Chicago, IL (591.5 miles , pop. 2,896,016).
Nearest cities:
), ), ), )Latitude: 33.68 N, Longitude: 84.45 W
Daytime population change due to commuting: -3,633 (-9.4%)
Workers who live and work in this city: 4,684 (23.6%)
Property values in East Point, GA
East Point, Georgia accommodation & food services, waste management - Economy and Business Data
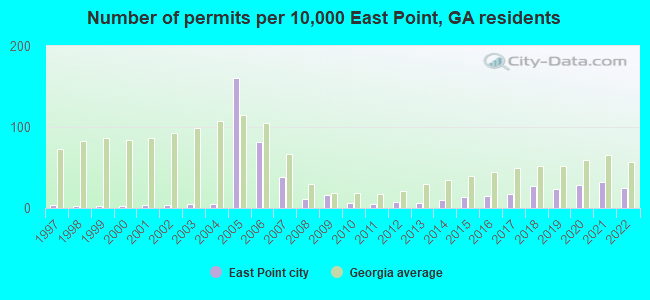
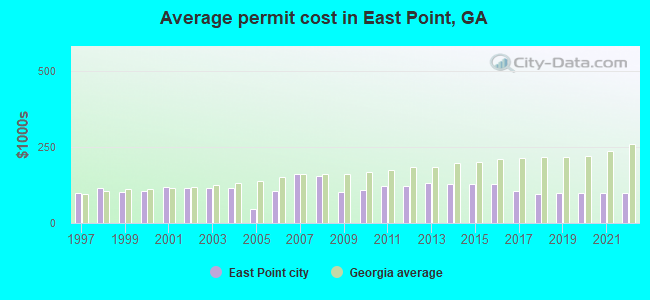
Single-family new house construction building permits:
- 2022: 99 buildings, average cost: $97,500
- 2021: 126 buildings, average cost: $97,000
- 2020: 112 buildings, average cost: $96,800
- 2019: 93 buildings, average cost: $97,700
- 2018: 106 buildings, average cost: $94,400
- 2017: 68 buildings, average cost: $105,100
- 2016: 59 buildings, average cost: $128,900
- 2015: 57 buildings, average cost: $128,700
- 2014: 40 buildings, average cost: $126,800
- 2013: 24 buildings, average cost: $130,400
- 2012: 29 buildings, average cost: $119,900
- 2011: 19 buildings, average cost: $122,000
- 2010: 23 buildings, average cost: $108,100
- 2009: 63 buildings, average cost: $102,100
- 2008: 44 buildings, average cost: $153,200
- 2007: 150 buildings, average cost: $161,900
- 2006: 325 buildings, average cost: $104,400
- 2005: 639 buildings, average cost: $45,900
- 2004: 20 buildings, average cost: $115,100
- 2003: 19 buildings, average cost: $115,200
- 2002: 17 buildings, average cost: $114,800
- 2001: 17 buildings, average cost: $116,600
- 2000: 12 buildings, average cost: $106,200
- 1999: 12 buildings, average cost: $101,400
- 1998: 13 buildings, average cost: $115,900
- 1997: 14 buildings, average cost: $97,700
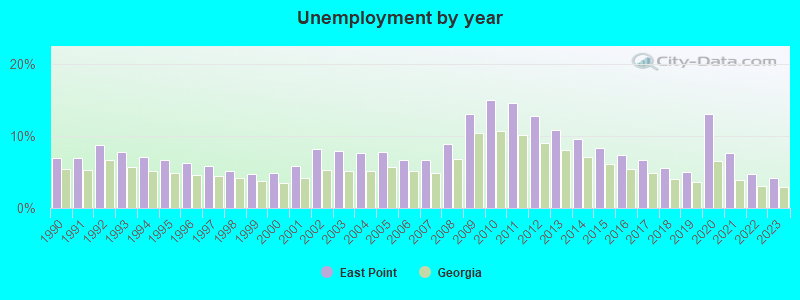
| Here: | 4.2% |
| Georgia: | 2.9% |
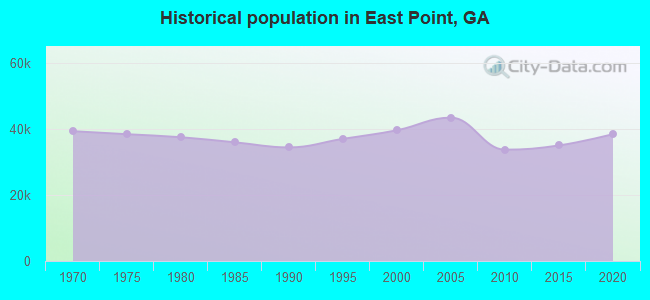
Population change in the 1990s: +5,116 (+14.8%).
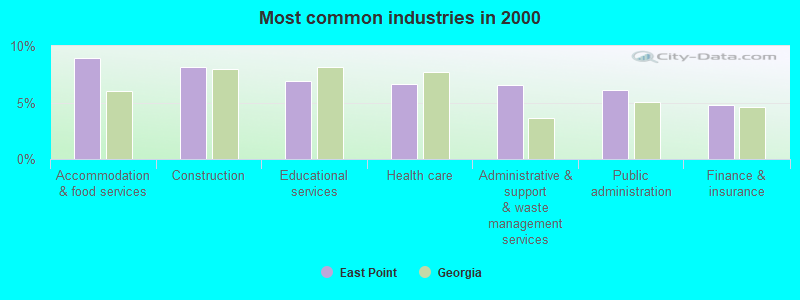
- Accommodation & food services (8.9%)
- Construction (8.1%)
- Educational services (6.9%)
- Health care (6.6%)
- Administrative & support & waste management services (6.6%)
- Public administration (6.1%)
- Finance & insurance (4.7%)
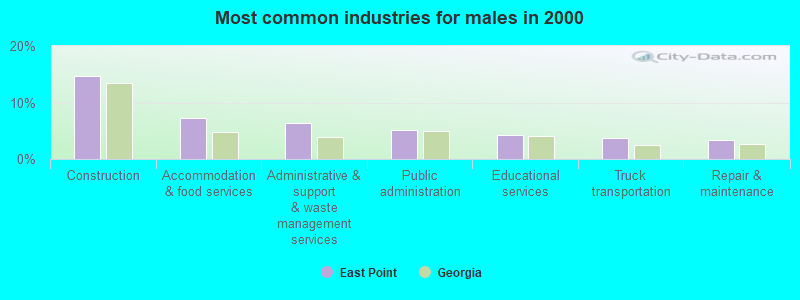
- Construction (14.6%)
- Accommodation & food services (7.3%)
- Administrative & support & waste management services (6.3%)
- Public administration (5.2%)
- Educational services (4.2%)
- Truck transportation (3.7%)
- Repair & maintenance (3.4%)
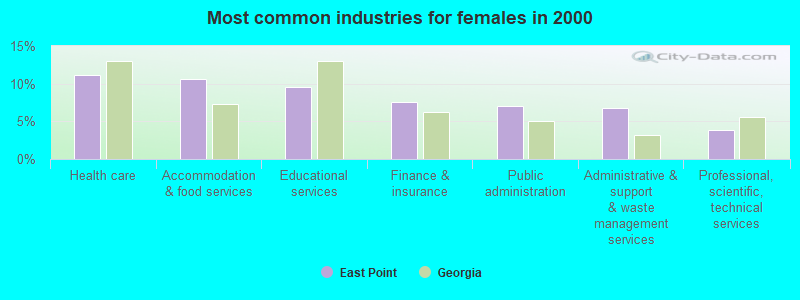
- Health care (11.2%)
- Accommodation & food services (10.6%)
- Educational services (9.6%)
- Finance & insurance (7.6%)
- Public administration (7.1%)
- Administrative & support & waste management services (6.8%)
- Professional, scientific, technical services (3.9%)
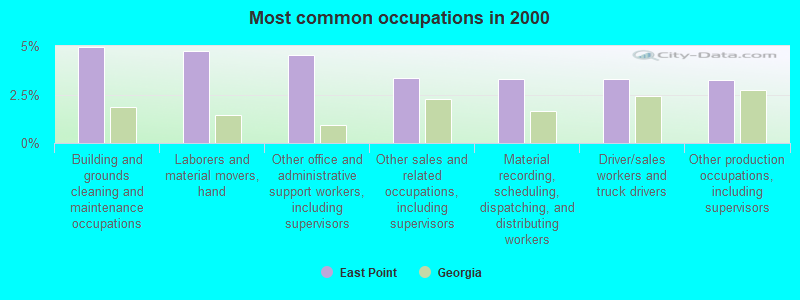
- Building and grounds cleaning and maintenance occupations (4.9%)
- Laborers and material movers, hand (4.8%)
- Other office and administrative support workers, including supervisors (4.5%)
- Other sales and related occupations, including supervisors (3.3%)
- Material recording, scheduling, dispatching, and distributing workers (3.3%)
- Driver/sales workers and truck drivers (3.3%)
- Other production occupations, including supervisors (3.3%)
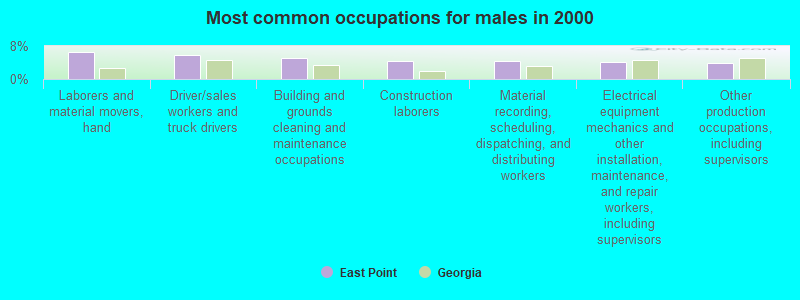
- Laborers and material movers, hand (6.6%)
- Driver/sales workers and truck drivers (5.9%)
- Building and grounds cleaning and maintenance occupations (5.1%)
- Construction laborers (4.5%)
- Material recording, scheduling, dispatching, and distributing workers (4.4%)
- Electrical equipment mechanics and other installation, maintenance, and repair workers, including supervisors (4.2%)
- Other production occupations, including supervisors (3.9%)

- Other office and administrative support workers, including supervisors (6.2%)
- Cashiers (5.5%)
- Secretaries and administrative assistants (5.1%)
- Building and grounds cleaning and maintenance occupations (4.8%)
- Customer service representatives (4.4%)
- Information and record clerks, except customer service representatives (3.9%)
- Preschool, kindergarten, elementary, and middle school teachers (3.6%)
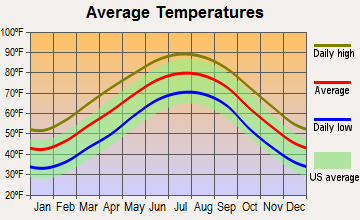
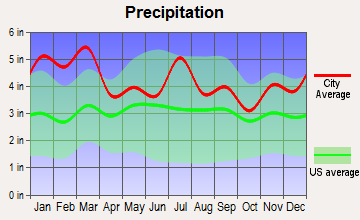
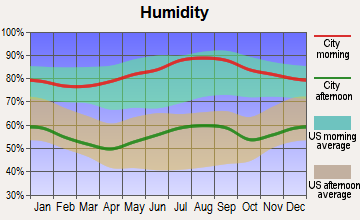
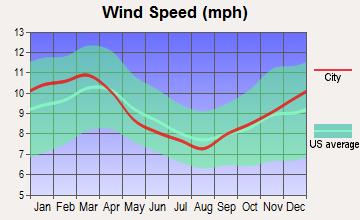
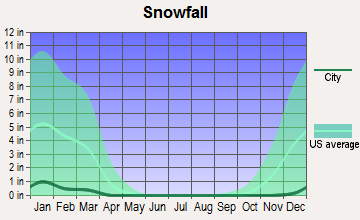
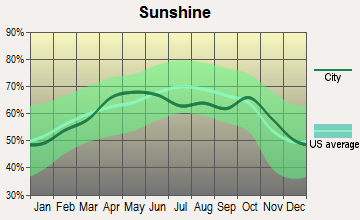
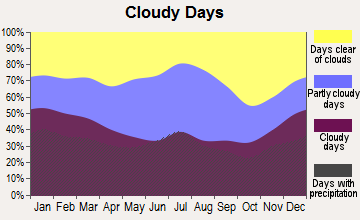
Average climate in East Point, Georgia
Based on data reported by over 4,000 weather stations
(lower is better)
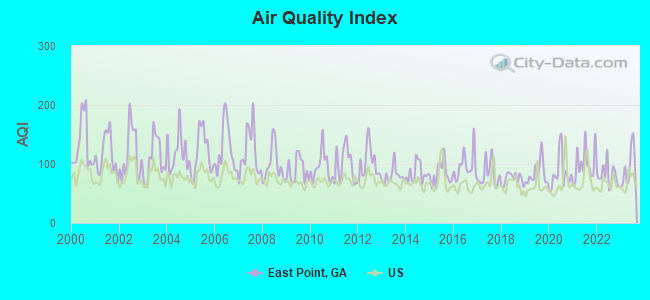
Air Quality Index (AQI) level in 2023 was 93.5. This is worse than average.
| City: | 93.5 |
| U.S.: | 72.6 |
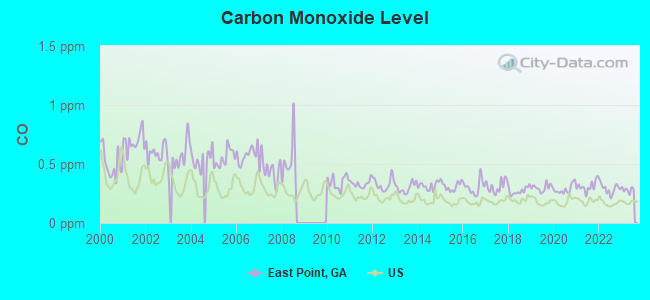
Carbon Monoxide (CO) [ppm] level in 2023 was 0.282. This is about average. Closest monitor was 1.6 miles away from the city center.
| City: | 0.282 |
| U.S.: | 0.251 |
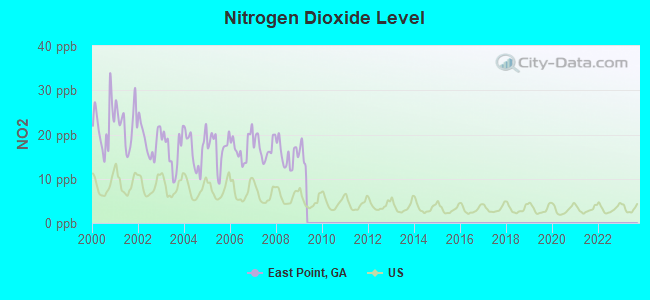
Nitrogen Dioxide (NO2) [ppb] level in 2008 was 15.3. This is significantly worse than average. Closest monitor was 1.6 miles away from the city center.
| City: | 15.3 |
| U.S.: | 5.1 |
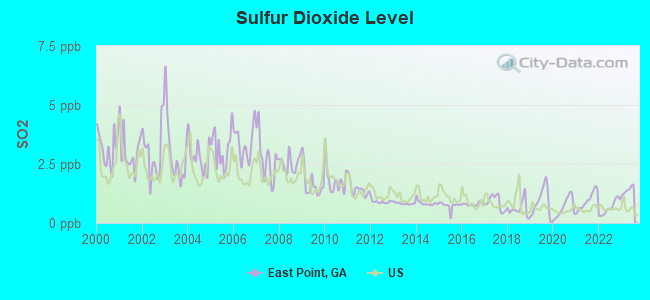
Sulfur Dioxide (SO2) [ppb] level in 2023 was 1.40. This is about average. Closest monitor was 2.3 miles away from the city center.
| City: | 1.40 |
| U.S.: | 1.51 |
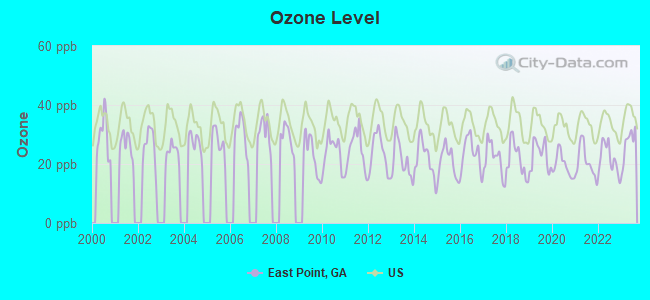
Ozone [ppb] level in 2023 was 26.8. This is better than average. Closest monitor was 1.6 miles away from the city center.
| City: | 26.8 |
| U.S.: | 33.3 |
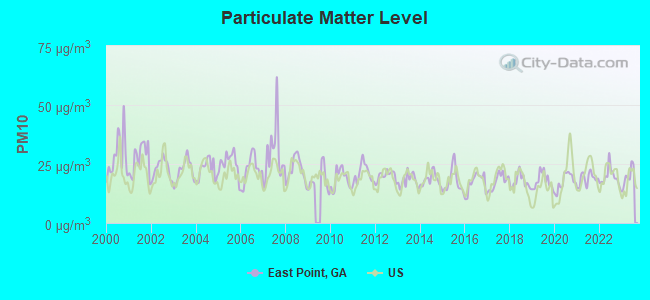
Particulate Matter (PM10) [µg/m3] level in 2023 was 19.7. This is about average. Closest monitor was 6.6 miles away from the city center.
| City: | 19.7 |
| U.S.: | 19.2 |
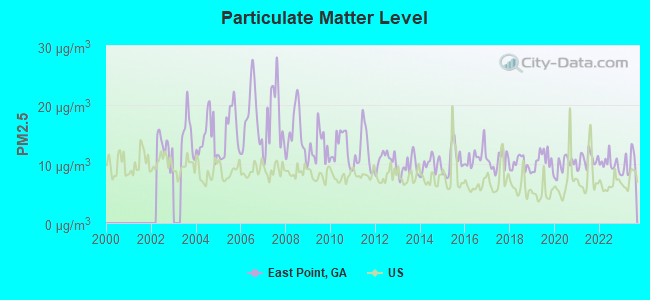
Particulate Matter (PM2.5) [µg/m3] level in 2023 was 10.1. This is worse than average. Closest monitor was 4.2 miles away from the city center.
| City: | 10.1 |
| U.S.: | 8.1 |
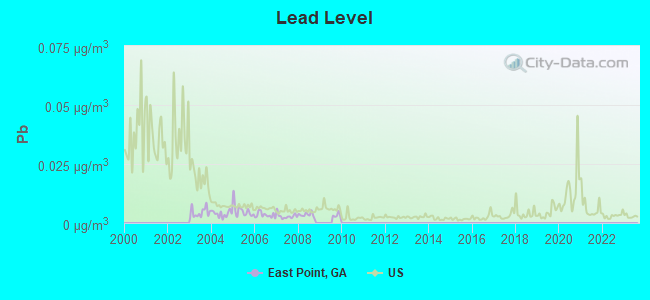
Lead (Pb) [µg/m3] level in 2008 was 0.00340. This is significantly better than average. Closest monitor was 6.6 miles away from the city center.
| City: | 0.00340 |
| U.S.: | 0.00931 |
Tornado activity:
East Point-area historical tornado activity is slightly above Georgia state average. It is 60% greater than the overall U.S. average.
On 11/22/1992, a category F4 (max. wind speeds 207-260 mph) tornado 21.0 miles away from the East Point city center injured 46 people and caused between $5,000,000 and $50,000,000 in damages.
On 1/10/1972, a category F3 (max. wind speeds 158-206 mph) tornado 3.0 miles away from the city center killed one person and injured 9 people and caused between $50,000 and $500,000 in damages.
Earthquake activity:
East Point-area historical earthquake activity is significantly above Georgia state average. It is 53% greater than the overall U.S. average.On 4/29/2003 at 08:59:39, a magnitude 4.9 (4.4 MB, 4.6 MW, 4.9 LG, Class: Light, Intensity: IV - V) earthquake occurred 88.0 miles away from the city center
On 8/2/1974 at 08:52:09, a magnitude 4.9 (4.3 MB, 4.9 LG) earthquake occurred 113.7 miles away from East Point center
On 4/29/2003 at 08:59:39, a magnitude 4.6 (4.6 MW, Depth: 12.3 mi) earthquake occurred 88.1 miles away from East Point center
On 1/18/1999 at 07:00:53, a magnitude 4.8 (4.8 MB, 4.0 LG, Depth: 0.6 mi) earthquake occurred 162.7 miles away from the city center
On 11/30/1973 at 07:48:41, a magnitude 4.7 (4.7 MB, 4.6 ML) earthquake occurred 149.5 miles away from East Point center
On 12/12/2018 at 09:14:43, a magnitude 4.4 (4.4 MW, Depth: 4.9 mi) earthquake occurred 134.9 miles away from East Point center
Magnitude types: regional Lg-wave magnitude (LG), body-wave magnitude (MB), local magnitude (ML), moment magnitude (MW)
Natural disasters:
The number of natural disasters in Fulton County (15) is near the US average (15).Major Disasters (Presidential) Declared: 10
Emergencies Declared: 4
Causes of natural disasters: Tornadoes: 5, Floods: 4, Storms: 4, Winter Storms: 4, Hurricanes: 3, Heavy Rains: 2, Drought: 1, Snowfall: 1, Tropical Storm: 1, Wind: 1, Other: 1 (Note: some incidents may be assigned to more than one category).
Hospitals and medical centers in East Point:
- HEART 2 HEART HEALTH SERVICES (2981 CHURCH ST, SUITE 104)
- REGENCY HOSP OF SOUTH ATLANTA (1170 CLEVELAND AVE 4TH FLOOR)
- SOUTH FULTON MEDICAL CENTER (1170 CLEVELAND AVENUE)
- BONTERRA NURSING CENTER (2801 FELTON DRIVE)
- SOUTH FULTON MED CTR EXTENDED CARE UNI (1170 CLEVELAND AVE)
- ATLANTA SOUTH DIALYSIS (3158 EAST MAIN STREET)
- EAST POINT DIALYSIS (2669 CHURCH STREET)
- TRINITY DIALYSIS CLINIC (1354 CLEVELAND AVENUE)
- SOUTHSIDE MEDICAL HOME HEALTH (1514 EAST CLEVELAND AVENUE STE 205)
Heliports located in East Point:
College/University in East Point:
Colleges/universities with over 2000 students nearest to East Point:
- Atlanta Metropolitan State College (about 4 miles; Atlanta, GA; Full-time enrollment: 2,437)
- Atlanta Technical College (about 4 miles; Atlanta, GA; FT enrollment: 4,217)
- Spelman College (about 6 miles; Atlanta, GA; FT enrollment: 2,383)
- Morehouse College (about 6 miles; Atlanta, GA; FT enrollment: 2,379)
- Clark Atlanta University (about 6 miles; Atlanta, GA; FT enrollment: 3,201)
- Georgia State University (about 7 miles; Atlanta, GA; FT enrollment: 30,264)
- Georgia Institute of Technology-Main Campus (about 8 miles; Atlanta, GA; FT enrollment: 24,183)
Public high schools in East Point:
Public elementary/middle schools in East Point:
- WOODLAND MIDDLE SCHOOL (Students: 1,018, Location: 2745 STONE RD, Grades: 6-8)
- PAUL D. WEST MIDDLE SCHOOL (Students: 877, Location: 2376 HEADLAND DR, Grades: 6-8)
- HAMILTON E. HOLMES ELEMENTARY (Students: 702, Location: 2301 CONNALLY DR, Grades: PK-5)
- OAK KNOLL ELEMENTARY SCHOOL (Students: 598, Location: 2626 HOGAN RD, Grades: PK-5)
- BROOKVIEW ELEMENTARY SCHOOL (Students: 566, Location: 3250 HAMMARSKJOLD DR, Grades: PK-5)
- MOUNT OLIVE ELEMENTARY SCHOOL (Students: 547, Location: 3353 MOUNT OLIVE RD, Grades: PK-5)
- CONLEY HILLS ELEMENTARY SCHOOL (Students: 541, Location: 2580 DELOWE DR, Grades: PK-5)
- PARKLANE ELEMENTARY SCHOOL (Students: 476, Location: 2809 BLOUNT ST, Grades: PK-5)
Private elementary/middle schools in East Point:
Points of interest:
Notable locations in East Point: Lakeside Country Club (A), East Point Industrial Park (B), Mullin Industrial Park (C), Tift Industrial Park (D), East Point Station (E), East Point Fire Department Station 5 (F), East Point Fire Department Station 4 (G), East Point Fire Department Station 3 (H), East Point Fire Department Station 2 (I), East Point Fire Department Station 1 (J), East Point Library (K), Charles A Green Recreation Center (L), Atlanta City Hall Annex (M), South Fulton Staff Development Center (N), East Point City Hall (O). Display/hide their locations on the map
Shopping Center: Tri-Cities Plaza Shopping Center (1). Display/hide its location on the map
Churches in East Point include: Bethel Church (A), Mount Olive Church (B), First Baptist Church of East Point (C), East Point Presbyterian Church (D), East Point First United Methodist Church (E), East Point Christian Church (F). Display/hide their locations on the map
Cemetery: Hillcrest Cemetery (1). Display/hide its location on the map
Parks in East Point include: Brookdale Park (1), South Park (2), Center Park (3), Sumner Park (4), Harris Park (5), Rankin Park (6), Spring Street Park (7), Sykes Park (8), Womack Park (9). Display/hide their locations on the map
Birthplace of: Kalimba Edwards - 2005 NFL player (Detroit Lions, born: Dec 26, 1979), Kandi Burruss - Female singer-songwriter, Nick Rogers - 2005 NFL player (Indianapolis Colts, born: May 31, 1979), Randy Thomas - 2005 NFL player (Washington Redskins, born: Jan 19, 1976), Randy Thomas (American football) - Football player, Alonso Duralde - Film critic, Harold Kite - Racing driver, Najee Mustafaa - Football player, Cristi Harris - Actor.
Drinking water stations with addresses in East Point and their reported violations in the past:
EAST POINT (Population served: 33,712, Surface water):Past health violations:
- Treatment Technique (SWTR and GWR) - In SEP-2008. Follow-up actions: St Public Notif received (OCT-01-2008)
| This city: | 2.5 people |
| Georgia: | 2.6 people |
| This city: | 58.0% |
| Whole state: | 68.5% |
| This city: | 8.4% |
| Whole state: | 5.9% |
Likely homosexual households (counted as self-reported same-sex unmarried-partner households)
- Lesbian couples: 0.9% of all households
- Gay men: 1.2% of all households
People in group quarters in East Point in 2010:
- 328 people in college/university student housing
- 31 people in emergency and transitional shelters (with sleeping facilities) for people experiencing homelessness
- 27 people in nursing facilities/skilled-nursing facilities
- 12 people in local jails and other municipal confinement facilities
- 9 people in group homes intended for adults
- 5 people in group homes for juveniles (non-correctional)
- 4 people in residential treatment centers for adults
- 4 people in workers' group living quarters and job corps centers
People in group quarters in East Point in 2000:
- 147 people in college dormitories (includes college quarters off campus)
- 142 people in other noninstitutional group quarters
- 132 people in nursing homes
- 17 people in local jails and other confinement facilities (including police lockups)
Banks with branches in East Point (2011 data):
- Regions Bank: Camp Creek Parkway Branch at 3511 Camp Creek Pkwy, branch established on 2009/11/30; East Point Branch at 2833 Main Street, branch established on 1988/03/25. Info updated 2011/02/24: Bank assets: $123,368.2 mil, Deposits: $98,301.3 mil, headquarters in Birmingham, AL, positive income, Commercial Lending Specialization, 1778 total offices, Holding Company: Regions Financial Corporation
- Citizens Trust Bank: East Point Branch at 2840 East Point Street, branch established on 1995/01/27. Info updated 2009/08/28: Bank assets: $397.1 mil, Deposits: $343.8 mil, headquarters in Atlanta, GA, positive income, Commercial Lending Specialization, 11 total offices, Holding Company: Citizens Bancshares Corporation
- SunTrust Bank: Camp Creek Parkway Branch at 3510 Camp Creek Pkwy, branch established on 2004/03/22. Info updated 2010/05/27: Bank assets: $171,291.7 mil, Deposits: $129,833.2 mil, headquarters in Atlanta, GA, positive income, Commercial Lending Specialization, 1716 total offices, Holding Company: Suntrust Banks, Inc.
- Bank of America, National Association: East Point Branch at 2818 East Point Street, branch established on 1946/09/03. Info updated 2009/11/18: Bank assets: $1,451,969.3 mil, Deposits: $1,077,176.8 mil, headquarters in Charlotte, NC, positive income, 5782 total offices, Holding Company: Bank Of America Corporation
- Wells Fargo Bank, National Association: East Point Branch at 2860 East Point Street, branch established on 1933/01/01. Info updated 2011/04/05: Bank assets: $1,161,490.0 mil, Deposits: $905,653.0 mil, headquarters in Sioux Falls, SD, positive income, 6395 total offices, Holding Company: Wells Fargo & Company
For population 15 years and over in East Point:
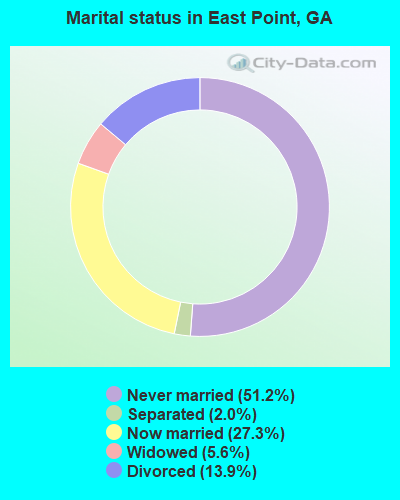
- Never married: 51.2%
- Now married: 27.3%
- Separated: 2.0%
- Widowed: 5.6%
- Divorced: 13.9%
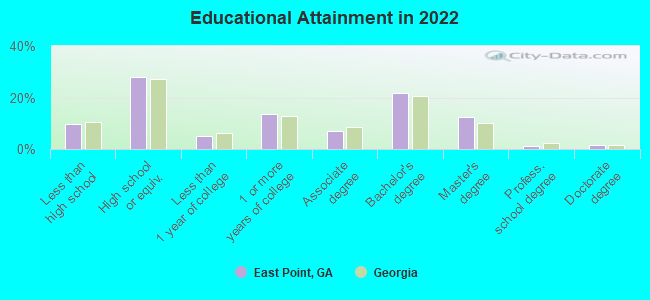
For population 25 years and over in East Point:
- High school or higher: 89.7%
- Bachelor's degree or higher: 35.5%
- Graduate or professional degree: 14.6%
- Unemployed: 8.8%
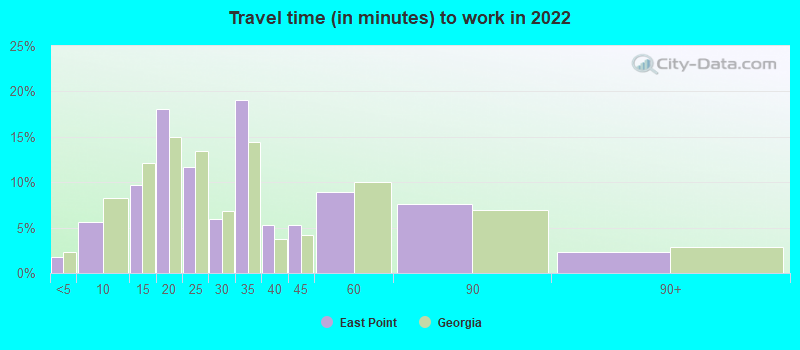
- Mean travel time to work (commute): 22.9 minutes
| Here: | 12.3 |
| Georgia average: | 12.2 |
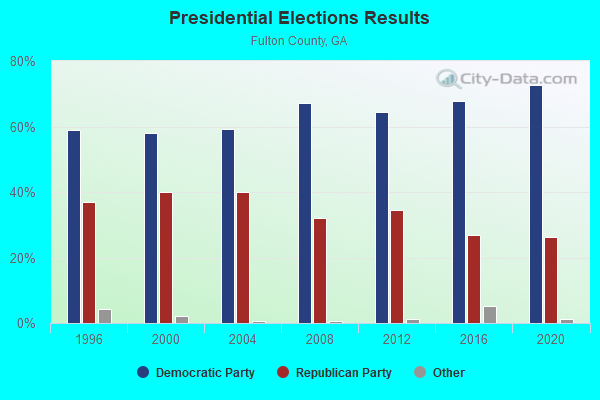
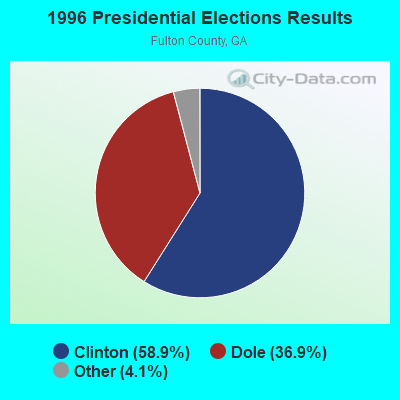
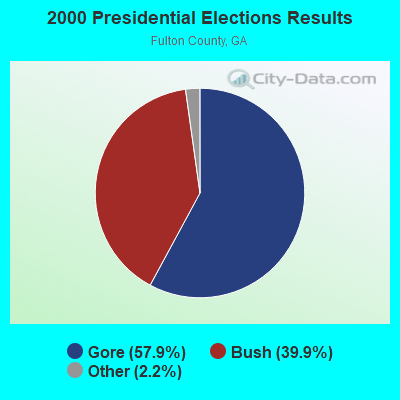

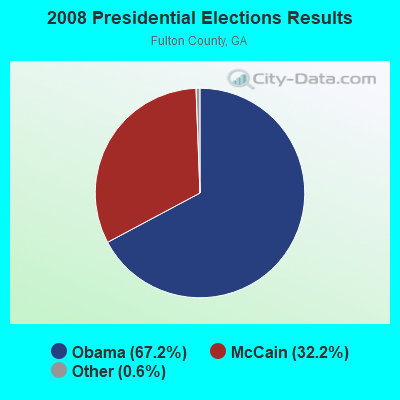


Graphs represent county-level data. Detailed 2008 Election Results
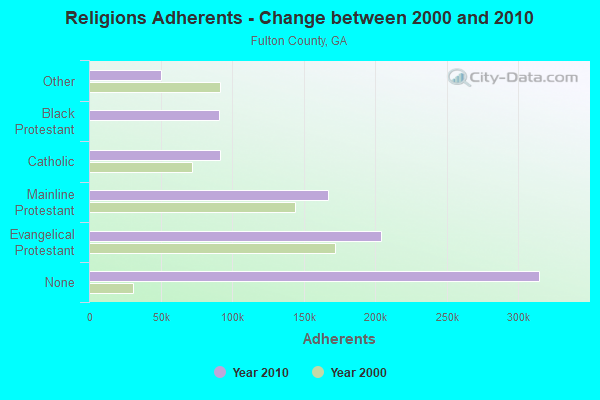
Religion statistics for East Point, GA (based on Fulton County data)
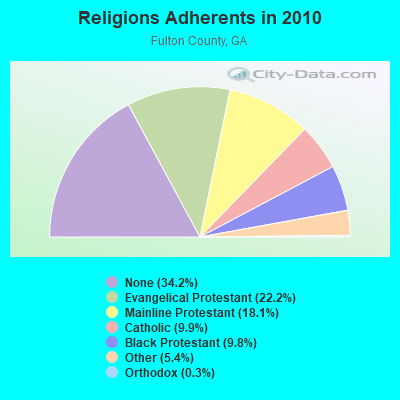
| Religion | Adherents | Congregations |
|---|---|---|
| Evangelical Protestant | 204,409 | 357 |
| Mainline Protestant | 166,727 | 153 |
| Catholic | 91,391 | 18 |
| Black Protestant | 90,642 | 135 |
| Other | 50,075 | 86 |
| Orthodox | 2,496 | 6 |
| None | 314,841 | - |
Food Environment Statistics:
| Here: | 1.91 / 10,000 pop. |
| State: | 1.91 / 10,000 pop. |
| Here: | 0.07 / 10,000 pop. |
| State: | 0.15 / 10,000 pop. |
| Fulton County: | 0.59 / 10,000 pop. |
| Georgia: | 0.86 / 10,000 pop. |
| Fulton County: | 3.00 / 10,000 pop. |
| Georgia: | 5.12 / 10,000 pop. |
| Fulton County: | 11.10 / 10,000 pop. |
| State: | 7.41 / 10,000 pop. |
| This county: | 8.6% |
| State: | 10.4% |
| Fulton County: | 23.2% |
| Georgia: | 27.8% |
| Fulton County: | 15.1% |
| Georgia: | 14.6% |
Health and Nutrition:
| East Point: | 48.2% |
| Georgia: | 48.9% |
| East Point: | 47.5% |
| Georgia: | 46.5% |
| East Point: | 29.6 |
| Georgia: | 28.9 |
| Here: | 17.8% |
| Georgia: | 20.4% |
| This city: | 12.9% |
| Georgia: | 10.8% |
| This city: | 6.6 |
| State: | 6.7 |
| East Point: | 34.9% |
| Georgia: | 33.5% |
| This city: | 55.4% |
| State: | 56.2% |
| East Point: | 83.8% |
| State: | 80.8% |
More about Health and Nutrition of East Point, GA Residents
| Local government employment and payroll (March 2022) | |||||
| Function | Full-time employees | Monthly full-time payroll | Average yearly full-time wage | Part-time employees | Monthly part-time payroll |
|---|---|---|---|---|---|
| Police Protection - Officers | 82 | $382,401 | $55,961 | 11 | $32,501 |
| Financial Administration | 68 | $348,151 | $61,438 | 0 | $0 |
| Firefighters | 58 | $269,896 | $55,841 | 0 | $0 |
| Water Supply | 45 | $165,857 | $44,229 | 0 | $0 |
| Electric Power | 33 | $150,168 | $54,607 | 0 | $0 |
| Other Government Administration | 30 | $106,032 | $42,413 | 0 | $0 |
| Solid Waste Management | 26 | $104,192 | $48,089 | 0 | $0 |
| Other and Unallocable | 24 | $106,100 | $53,050 | 0 | $0 |
| Parks and Recreation | 16 | $82,573 | $61,930 | 0 | $0 |
| Correction | 12 | $41,837 | $41,837 | 0 | $0 |
| Police - Other | 8 | $29,800 | $44,700 | 2 | $5,170 |
| Judicial and Legal | 3 | $20,992 | $83,968 | 0 | $0 |
| Streets and Highways | 2 | $5,474 | $32,844 | 0 | $0 |
| Totals for Government | 407 | $1,813,474 | $53,469 | 13 | $37,672 |
East Point government finances - Expenditure in 2021 (per resident):
- Current Operations - Electric Utilities: $44,731,000 ($1165.48)
Water Utilities: $13,422,000 ($349.71)
Sewerage: $11,409,000 ($297.26)
Police Protection: $10,924,000 ($284.63)
Local Fire Protection: $8,337,000 ($217.22)
Central Staff Services: $8,112,000 ($211.36)
Regular Highways: $7,217,000 ($188.04)
Solid Waste Management: $6,047,000 ($157.56)
General - Other: $4,966,000 ($129.39)
Judicial and Legal Services: $3,084,000 ($80.35)
General Public Buildings: $2,628,000 ($68.47)
Financial Administration: $1,568,000 ($40.85)
Parks and Recreation: $1,475,000 ($38.43)
Protective Inspection and Regulation - Other: $1,236,000 ($32.20)
Correctional Institutions: $1,194,000 ($31.11)
- Electric Utilities - Interest on Debt: $9,000 ($0.23)
- General - Interest on Debt: $2,731,000 ($71.16)
- Water Utilities - Interest on Debt: $562,000 ($14.64)
East Point government finances - Revenue in 2021 (per resident):
- Charges - Sewerage: $15,498,000 ($403.80)
Solid Waste Management: $4,489,000 ($116.96)
Other: $1,872,000 ($48.78)
- Federal Intergovernmental - Other: $2,175,000 ($56.67)
Housing and Community Development: $346,000 ($9.02)
Water Utilities: $202,000 ($5.26)
Sewerage: $174,000 ($4.53)
- Local Intergovernmental - General Local Government Support: $18,238,000 ($475.20)
Other: $54,000 ($1.41)
- Miscellaneous - General Revenue - Other: $1,182,000 ($30.80)
Rents: $189,000 ($4.92)
Sale of Property: $33,000 ($0.86)
- Revenue - Electric Utilities: $44,112,000 ($1149.35)
Water Utilities: $7,389,000 ($192.52)
- State Intergovernmental - Other: $387,000 ($10.08)
General Local Government Support: $105,000 ($2.74)
- Tax - Property: $19,126,000 ($498.33)
Other Selective Sales: $2,788,000 ($72.64)
Insurance Premiums Sales: $2,687,000 ($70.01)
Occupation and Business License - Other: $1,135,000 ($29.57)
Public Utilities Sales: $812,000 ($21.16)
Alcoholic Beverage Sales: $695,000 ($18.11)
Other License: $603,000 ($15.71)
Alcoholic Beverage License: $212,000 ($5.52)
East Point government finances - Debt in 2021 (per resident):
- Long Term Debt - Beginning Outstanding - Unspecified Public Purpose: $56,470,000 ($1471.34)
Outstanding Unspecified Public Purpose: $51,693,000 ($1346.87)
Beginning Outstanding - Public Debt for Private Purpose: $36,865,000 ($960.53)
Outstanding Nonguaranteed - Industrial Revenue: $32,329,000 ($842.34)
Retired Unspecified Public Purpose: $4,826,000 ($125.74)
Retired Nonguaranteed - Public Debt for Private Purpose: $4,536,000 ($118.19)
Issue, Unspecified Public Purpose: $49,000 ($1.28)
East Point government finances - Cash and Securities in 2021 (per resident):
- Bond Funds - Cash and Securities: $26,270,000 ($684.47)
- Other Funds - Cash and Securities: $51,645,000 ($1345.62)
- Sinking Funds - Cash and Securities: $40,539,000 ($1056.25)
11.63% of this county's 2021 resident taxpayers lived in other counties in 2020 ($85,149 average adjusted gross income)
| Here: | 11.63% |
| Georgia average: | 10.21% |
0.01% of residents moved from foreign countries ($76 average AGI)
Fulton County: 0.01% Georgia average: 0.04%
Top counties from which taxpayers relocated into this county between 2020 and 2021:
| from DeKalb County, GA | |
| from Cobb County, GA | |
| from Gwinnett County, GA |
12.21% of this county's 2020 resident taxpayers moved to other counties in 2021 ($93,086 average adjusted gross income)
| Here: | 12.21% |
| Georgia average: | 9.60% |
0.01% of residents moved to foreign countries ($58 average AGI)
Fulton County: 0.01% Georgia average: 0.03%
Top counties to which taxpayers relocated from this county between 2020 and 2021:
| to DeKalb County, GA | |
| to Cobb County, GA | |
| to Gwinnett County, GA |
| Businesses in East Point, GA | ||||
| Name | Count | Name | Count | |
|---|---|---|---|---|
| AT&T | 1 | Nike | 2 | |
| Advance Auto Parts | 1 | Old Navy | 1 | |
| CVS | 1 | Panda Express | 1 | |
| Chick-Fil-A | 2 | Payless | 1 | |
| Church's Chicken | 1 | PetSmart | 1 | |
| Comfort Inn | 1 | Pizza Hut | 1 | |
| DHL | 1 | Rite Aid | 1 | |
| Dairy Queen | 1 | Ruby Tuesday | 2 | |
| FedEx | 5 | Shoe Carnival | 1 | |
| GameStop | 2 | Sprint Nextel | 1 | |
| Goodwill | 1 | Staples | 1 | |
| H&R Block | 2 | Starbucks | 1 | |
| Hilton | 1 | T-Mobile | 1 | |
| KFC | 1 | Taco Bell | 2 | |
| Lane Bryant | 1 | Target | 1 | |
| LensCrafters | 1 | U-Haul | 2 | |
| Lowe's | 1 | UPS | 2 | |
| Marriott | 2 | Verizon Wireless | 2 | |
| Marshalls | 1 | Waffle House | 2 | |
| McDonald's | 2 | |||
Strongest AM radio stations in East Point:
- WGST (640 AM; 50 kW; ATLANTA, GA; Owner: CITICASTERS LICENSES, L.P.)
- WTJH (1260 AM; 5 kW; EAST POINT, GA; Owner: WILLIS BROADCASTING CORPORATION)
- WAOK (1380 AM; 50 kW; ATLANTA, GA; Owner: INFINITY BROADCASTING OPERATIONS, INC.)
- WGUN (1010 AM; 50 kW; ATLANTA, GA; Owner: WGUN, INC.)
- WQXI (790 AM; 28 kW; ATLANTA, GA; Owner: JEFFERSON-PILOT COMMUNICATIONS COMPANY OF GEORGIA)
- WSB (750 AM; 50 kW; ATLANTA, GA; Owner: CXR HOLDINGS, INC.)
- WMLB (1160 AM; 50 kW; EAST POINT, GA; Owner: ATLANTA AREA BROADCASTING, INC.)
- WGKA (1190 AM; 25 kW; ATLANTA, GA; Owner: SALEM MEDIA OF GEORGIA, INC.)
- WAZX (1550 AM; 50 kW; SMYRNA, GA; Owner: GA-MEX BROADCASTING, INC.)
- WCNN (680 AM; 50 kW; NORTH ATLANTA, GA; Owner: DICKEY BROADCASTING COMPANY)
- WYZE (1480 AM; 5 kW; ATLANTA, GA)
- WAEC (860 AM; 5 kW; ATLANTA, GA; Owner: WAEC LICENSE LIMITED PARTNERSHIP)
- WWWE (1100 AM; daytime; 5 kW; HAPEVILLE, GA; Owner: WAEC LICENSE LIMITED PARTNERSHP)
Strongest FM radio stations in East Point:
- WRFG (89.3 FM; ATLANTA, GA; Owner: RADIO FREE GEORGIA BROADCASTING FOUNDATION INC)
- WAMJ (102.5 FM; MABLETON, GA; Owner: NEW MABLETON BROADCASTING CORPORATION)
- WWWQ (100.5 FM; ANNISTON, AL; Owner: WNNX LICO, INC.)
- WNNX (99.7 FM; ATLANTA, GA; Owner: WNNX LICO, INC.)
- WSB-FM (98.5 FM; ATLANTA, GA; Owner: CXR HOLDINGS, INC.)
- WSTR (94.1 FM; SMYRNA, GA; Owner: JEFFERSON-PILOT COMMUNICATIONS COMPANY OF GEORGIA)
- WVEE (103.3 FM; ATLANTA, GA; Owner: INFINITY BROADCASTING OPERATIONS, INC.)
- WZGC (92.9 FM; ATLANTA, GA; Owner: INFINITY BROADCASTING CORP. OF ATLANTA)
- WKHX-FM (101.5 FM; MARIETTA, GA; Owner: ABC, INC.)
- WKLS (96.1 FM; ATLANTA, GA; Owner: CITICASTERS LICENSES, L.P.)
- WLTM (94.9 FM; ATLANTA, GA; Owner: CITICASTERS LICENSES, L.P.)
- WCLK (91.9 FM; ATLANTA, GA; Owner: CLARK ATLANTA UNIVERSITY)
- WREK (91.1 FM; ATLANTA, GA; Owner: RADIO COMMNS. BD, GEORGIA INST. TECH)
- WRAS (88.5 FM; ATLANTA, GA; Owner: GEORGIA STATE UNIVERSITY)
- WHTA (107.9 FM; HAMPTON, GA; Owner: RADIO ONE LICENSES, LLC)
- WABE (90.1 FM; ATLANTA, GA; Owner: BOARD OF EDUCATION, CITY OF ATLANTA)
- WPZE (97.5 FM; FAYETTEVILLE, GA; Owner: ROA LICENSES, LLC)
- WALR-FM (104.1 FM; LA GRANGE, GA; Owner: CXR HOLDINGS, INC.)
- WFSH-FM (104.7 FM; ATHENS, GA; Owner: SOUTH TEXAS BROADCASTING, INC.)
- WLCL (105.7 FM; CANTON, GA; Owner: CHEROKEE BROADCASTING CO., INC.)
TV broadcast stations around East Point:
- WSB-TV (Channel 2; ATLANTA, GA; Owner: WSB-TV HOLDINGS, INC.)
- WHSG (Channel 63; MONROE, GA; Owner: TRINITY BROADCASTING NETWORK)
- WUPA (Channel 69; ATLANTA, GA; Owner: VIACOM STATIONS GROUP OF ATLANTA INC.)
- WXIA-TV (Channel 11; ATLANTA, GA; Owner: GANNETT GEORGIA, L.P.)
- WANN-LP (Channel 32; ATLANTA, GA; Owner: PRISM BROADCASTING NETWORK, INC.)
- WDTA-LP (Channel 53; FAYETTEVILLE, GA; Owner: WORD OF GOD FELLOWSHIP, INC.)
- WUVG (Channel 34; ATHENS, GA; Owner: UNIVISION ATLANTA LLC)
- WANX-LP (Channel 26; ATLANTA, GA; Owner: PRISM BROADCASTING NETWORK, INC.)
- WAGA (Channel 5; ATLANTA, GA; Owner: FOX TELEVISION STATIONS, INC.)
- WPBA (Channel 30; ATLANTA, GA; Owner: BOARD OF EDUCATION OF THE CITY OF ATLANTA)
- WTHC-LP (Channel 42; ATLANTA, GA; Owner: THE ATLANTA CHANNEL, INC.)
- WATL (Channel 36; ATLANTA, GA; Owner: WATL, LLC)
- WTBS (Channel 17; ATLANTA, GA; Owner: SUPERSTATION, INC.)
- WGCL-TV (Channel 46; ATLANTA, GA; Owner: MEREDITH CORPORATION)
- WIRE-CA (Channel 40; ATLANTA, GA; Owner: COMMERCIAL BROADCASTING CORP.)
- W24AL (Channel 24; ATLANTA, GA; Owner: VENTANA TELEVISION, INC.)
- WATC (Channel 57; ATLANTA, GA; Owner: COMMUNITY TELEVISION, INC.)
- W04DB (Channel 4; ATLANTA, GA; Owner: VVILPTV, INC.)
- WSKC-LP (Channel 59; ATLANTA, GA; Owner: KM LPTV OF ATLANTA, L.L.C.)
- W52CL (Channel 52; MACON, GA; Owner: TRINITY BROADCASTING NETWORK)
- WGTV (Channel 8; ATHENS, GA; Owner: GEORGIA PUBLIC TELECOMMUNICATIONS COMMISSION)
- National Bridge Inventory (NBI) Statistics
- 62Number of bridges
- 610ft / 186mTotal length
- $27,358,000Total costs
- 2,119,728Total average daily traffic
- 28,550Total average daily truck traffic
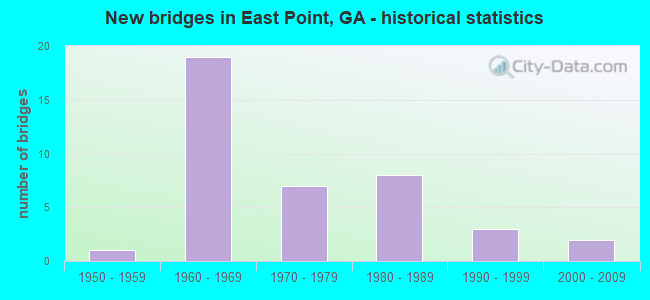
- New bridges - historical statistics
- 11950-1959
- 191960-1969
- 71970-1979
- 81980-1989
- 31990-1999
- 22000-2009
FCC Registered Antenna Towers:
210 (See the full list of FCC Registered Antenna Towers in East Point)FCC Registered Commercial Land Mobile Towers:
2 (See the full list of FCC Registered Commercial Land Mobile Towers in East Point, GA)FCC Registered Private Land Mobile Towers:
2 (See the full list of FCC Registered Private Land Mobile Towers)FCC Registered Broadcast Land Mobile Towers:
15 (See the full list of FCC Registered Broadcast Land Mobile Towers)FCC Registered Microwave Towers:
25 (See the full list of FCC Registered Microwave Towers in this town)FCC Registered Paging Towers:
3 (See the full list of FCC Registered Paging Towers)FCC Registered Maritime Coast & Aviation Ground Towers:
1 (See the full list of FCC Registered Maritime Coast & Aviation Ground Towers)FCC Registered Amateur Radio Licenses:
40 (See the full list of FCC Registered Amateur Radio Licenses in East Point)FAA Registered Aircraft:
7- Aircraft: NEW PIPER AIRCRAFT INC PA-28-181 (Category: Land, Seats: 4, Weight: Up to 12,499 Pounds), Engine: LYCOMING O-360-A4M (180 HP) (Reciprocating)
N-Number: 3126W, N3126W, N-3126W, Serial Number: 2843621, Year manufactured: 2006, Airworthiness Date: 02/02/2006, Certificate Issue Date: 03/29/2006
Registrant (LLC): Rogers Air LLC, 1188 Central Ave, East Point, GA 30344 - Aircraft: BRITISH AEROSPACE HS 125-700A (Category: Land, Engines: 2, Seats: 15, Weight: 20,000+ Pounds), Engine: Turbo-fan
N-Number: 810KB, N810KB, N-810KB, Serial Number: 257118, Certificate Issue Date: 01/13/2005
Registrant (LLC): Kba/Bridges & Shields LLC, 3645 Marketplace Blvd Ste 130-318, East Point, GA 30344 - Aircraft: GRUMMAN AMERICAN AVN. CORP. AA-1C (Category: Land, Seats: 2, Weight: Up to 12,499 Pounds), Engine: LYCOMING 0-235 SERIES (115 HP) (Reciprocating)
N-Number: 855MP, N855MP, N-855MP, Serial Number: AA1C0165, Year manufactured: 1978, Airworthiness Date: 05/02/1978, Certificate Issue Date: 01/17/2020
Registrant (Individual): Mark Huguet, 1411 Bryan Ave, East Point, GA 30344 - Aircraft: PIPER PA-22-135 (Category: Land, Seats: 4, Weight: Up to 12,499 Pounds, Speed: 94 mph), Engine: LYCOMING 0-290 SERIES (140 HP) (Reciprocating)
N-Number: 8991C, N8991C, N-8991C, Serial Number: 22-1564, Year manufactured: 1953, Airworthiness Date: 07/14/1956, Certificate Issue Date: 09/05/2019
Registrant (Individual): Patrick Kyle Houghton, 2922 Blount St, East Point, GA 30344 - Aircraft: MOONEY M20A (Category: Land, Seats: 4, Weight: Up to 12,499 Pounds, Speed: 127 mph), Engine: LYCOMING O&VO-360 SER (180 HP) (Reciprocating)
N-Number: 8366E, N8366E, N-8366E, Serial Number: 1544, Year manufactured: 1960
Registrant (Individual): Bobby L Bridges, 3100 E Point St, East Point, GA 30044
Deregistered: Cancel Date: 09/06/2019 - Aircraft: FAIRCHILD M-62A (Category: Land, Seats: 2, Weight: Up to 12,499 Pounds, Speed: 97 mph), Engine: FAIRCHILD 6-440 SERIES (200 HP) (Reciprocating)
N-Number: 66275, N66275, N-66275, Serial Number: T434428, Year manufactured: 1943, Certificate Issue Date: 04/18/1957
Registrant (Individual): J L Wright, 2636 Westchester Dr, East Point, GA 30044
Deregistered: Cancel Date: 05/23/2018 - Aircraft: CESSNA 150G (Category: Land, Seats: 2, Weight: Up to 12,499 Pounds, Speed: 90 mph), Engine: CONT MOTOR 0-200 SERIES (100 HP) (4 Cycle)
N-Number: 8607J, N8607J, N-8607J, Serial Number: 15066507, Year manufactured: 1967, Certificate Issue Date: 01/04/1974
Registrant (Individual): Rawley R Carter, 2595 Woodhaven Circle, East Point, GA 30344
Deregistered: Cancel Date: 02/04/2017
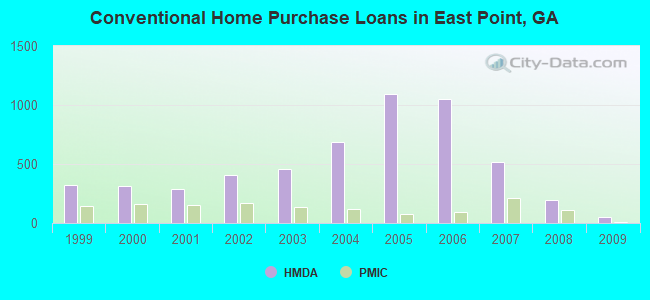
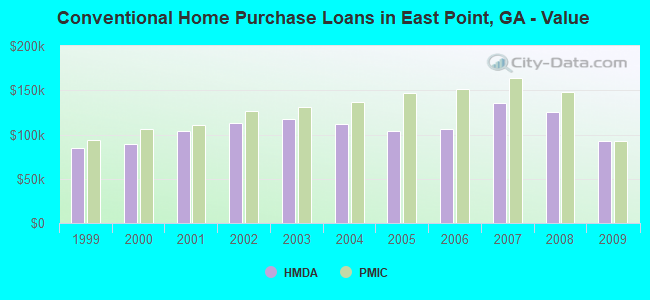
| Home Mortgage Disclosure Act Aggregated Statistics For Year 2009 (Based on 7 full and 1 partial tracts) | ||||||||||||||
| A) FHA, FSA/RHS & VA Home Purchase Loans | B) Conventional Home Purchase Loans | C) Refinancings | D) Home Improvement Loans | E) Loans on Dwellings For 5+ Families | F) Non-occupant Loans on < 5 Family Dwellings (A B C & D) | G) Loans On Manufactured Home Dwelling (A B C & D) | ||||||||
|---|---|---|---|---|---|---|---|---|---|---|---|---|---|---|
| Number | Average Value | Number | Average Value | Number | Average Value | Number | Average Value | Number | Average Value | Number | Average Value | Number | Average Value | |
| LOANS ORIGINATED | 160 | $116,912 | 51 | $92,728 | 254 | $137,851 | 13 | $38,113 | 1 | $325,900 | 49 | $119,729 | 0 | $0 |
| APPLICATIONS APPROVED, NOT ACCEPTED | 13 | $104,392 | 8 | $80,404 | 32 | $122,772 | 5 | $19,130 | 0 | $0 | 7 | $100,199 | 0 | $0 |
| APPLICATIONS DENIED | 48 | $126,716 | 28 | $72,305 | 254 | $127,491 | 25 | $38,902 | 0 | $0 | 41 | $74,296 | 1 | $10,690 |
| APPLICATIONS WITHDRAWN | 49 | $126,330 | 20 | $70,064 | 145 | $153,889 | 6 | $44,372 | 0 | $0 | 22 | $90,072 | 1 | $51,980 |
| FILES CLOSED FOR INCOMPLETENESS | 9 | $137,933 | 1 | $149,620 | 30 | $138,683 | 2 | $38,000 | 0 | $0 | 3 | $85,953 | 0 | $0 |
Detailed HMDA statistics for the following Tracts: 0109.00 , 0110.00, 0111.00, 0112.01, 0112.02, 0113.01, 0113.03, 0113.04
| Private Mortgage Insurance Companies Aggregated Statistics For Year 2009 (Based on 7 full and 1 partial tracts) | ||||||
| A) Conventional Home Purchase Loans | B) Refinancings | C) Non-occupant Loans on < 5 Family Dwellings (A & B) | ||||
|---|---|---|---|---|---|---|
| Number | Average Value | Number | Average Value | Number | Average Value | |
| LOANS ORIGINATED | 10 | $92,699 | 8 | $143,249 | 0 | $0 |
| APPLICATIONS APPROVED, NOT ACCEPTED | 10 | $134,520 | 4 | $162,398 | 2 | $158,175 |
| APPLICATIONS DENIED | 1 | $65,980 | 3 | $167,057 | 0 | $0 |
| APPLICATIONS WITHDRAWN | 2 | $100,355 | 0 | $0 | 0 | $0 |
| FILES CLOSED FOR INCOMPLETENESS | 1 | $105,000 | 1 | $160,680 | 0 | $0 |
Detailed PMIC statistics for the following Tracts: 0109.00 , 0110.00, 0111.00, 0112.01, 0112.02, 0113.01, 0113.03, 0113.04
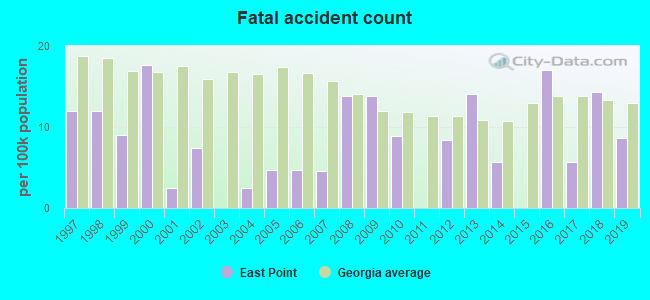
2002 - 2018 National Fire Incident Reporting System (NFIRS) incidents
- Fire incident types reported to NFIRS in East Point, GA
- 90437.7%Outside Fires
- 77632.4%Structure Fires
- 57223.9%Mobile Property/Vehicle Fires
- 1466.1%Other
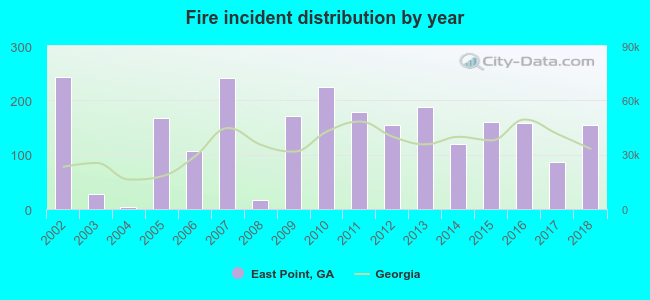 According to the data from the years 2002 - 2018 the average number of fires per year is 141. The highest number of reported fire incidents - 243 took place in 2002, and the least - 3 in 2004. The data has a decreasing trend.
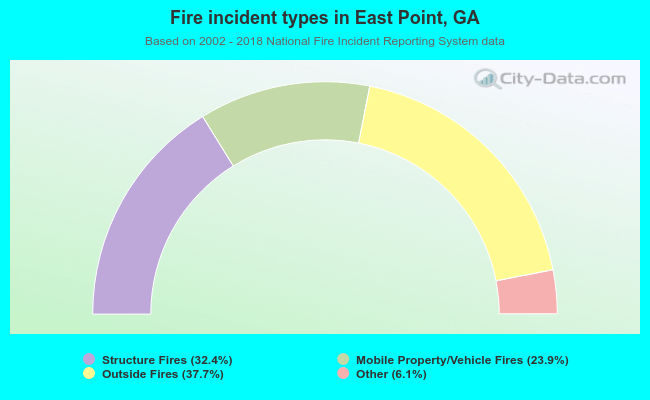 When looking into fire subcategories, the most incidents belonged to: Outside Fires (37.7%), and Structure Fires (32.4%).
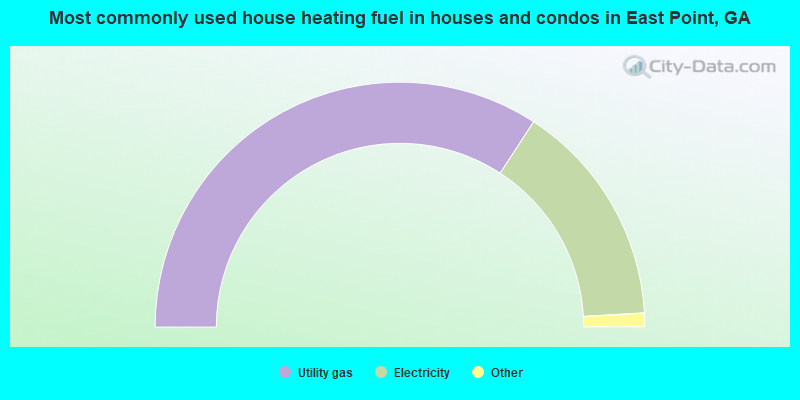
- 68.4%Utility gas
- 29.8%Electricity
- 1.0%Bottled, tank, or LP gas
- 0.4%Fuel oil, kerosene, etc.
- 0.4%Solar energy
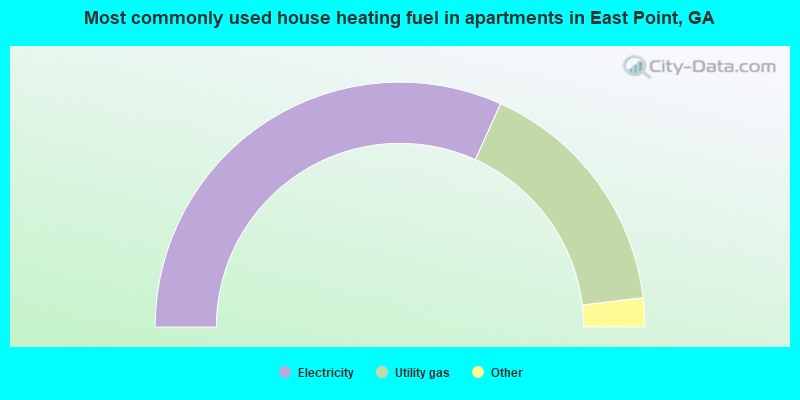
- 63.5%Electricity
- 32.7%Utility gas
- 2.5%Bottled, tank, or LP gas
- 0.9%No fuel used
- 0.3%Fuel oil, kerosene, etc.
- 0.1%Other fuel
East Point compared to Georgia state average:
- Unemployed percentage below state average.
- Black race population percentage above state average.
- Median age below state average.
- Foreign-born population percentage below state average.
- Renting percentage above state average.
- Length of stay since moving in significantly above state average.
- House age above state average.
- Percentage of population with a bachelor's degree or higher above state average.
East Point on our top lists:
- #3 on the list of "Top 101 cities with the highest number of auto thefts per 100,000 residents, excludes tourist destinations and others with a lot of outsiders visiting based on city industries data (population 5,000+)"
- #11 on the list of "Top 101 cities with the highest number of robberies per 100,000 residents, excludes tourist destinations and others with a lot of outsiders visiting based on city industries data (population 5,000+)"
- #19 on the list of "Top 101 cities with the highest city-data.com crime index, excludes tourist destinations and others with a lot of outsiders visiting based on city industries data (population 5,000+)"
- #33 on the list of "Top 101 cities with the highest number of burglaries per 100,000 residents, excludes tourist destinations and others with a lot of outsiders visiting based on city industries data (population 5,000+)"
- #42 on the list of "Top 101 cities with the largest percentage of likely gay men couples (counted as self-reported male-male unmarried-partner households) (population 5,000+)"
- #43 on the list of "Top 101 cities with the most full-time financial administration workers per 1000 residents (population 5,000+)"
- #45 on the list of "Top 101 cities with the largest percentage of likely homosexual households (counted as self-reported same-sex unmarried-partner households) (population 5,000+)"
- #52 on the list of "Top 101 cities with the highest number of murders per 100,000 residents, excludes tourist destinations and others with a lot of outsiders visiting based on city industries data (population 5,000+)"
- #52 on the list of "Top 101 cities with the most residents born in Other Central America (population 500+)"
- #73 on the list of "Top 100 least-safe cities (highest city-data.com crime index)"
- #84 on the list of "Top 101 cities with largest percentage of females in occupations: fire fighting and prevention workers including supervisors (population 5,000+)"
- #85 (30344) on the list of "Top 101 zip codes with the lowest 2012 average reported profit/loss from business (pop 5,000+)"
- #5 on the list of "Top 101 counties with the most Mainline Protestant adherents"
- #6 on the list of "Top 101 counties with the most Black Protestant adherents"
- #9 on the list of "Top 101 counties with the most Black Protestant congregations"
- #11 on the list of "Top 101 counties with the highest percentage of residents relocating from other counties between 2010 and 2011 (pop. 50,000+)"
- #13 on the list of "Top 101 counties with the highest percentage of residents relocating to other counties in 2011 (pop. 50,000+)"

|
|
Total of 34 patent applications in 2008-2024.