College Park, Georgia Submit your own pictures of this city and show them to the world
OSM Map
General Map
Google Map
MSN Map
OSM Map
General Map
Google Map
MSN Map
OSM Map
General Map
Google Map
MSN Map
OSM Map
General Map
Google Map
MSN Map
Please wait while loading the map...
Population in 2022: 13,914 (100% urban, 0% rural). Population change since 2000: -31.7%Males: 6,509 Females: 7,405
March 2022 cost of living index in College Park: 102.2 (near average, U.S. average is 100) Percentage of residents living in poverty in 2022: 18.1%for White Non-Hispanic residents , 18.7% for Black residents , 24.2% for Hispanic or Latino residents , 27.2% for other race residents , 27.9% for two or more races residents )
Profiles of local businesses
Business Search - 14 Million verified businesses
Data:
Median household income ($)
Median household income (% change since 2000)
Household income diversity
Ratio of average income to average house value (%)
Ratio of average income to average rent
Median household income ($) - White
Median household income ($) - Black or African American
Median household income ($) - Asian
Median household income ($) - Hispanic or Latino
Median household income ($) - American Indian and Alaska Native
Median household income ($) - Multirace
Median household income ($) - Other Race
Median household income for houses/condos with a mortgage ($)
Median household income for apartments without a mortgage ($)
Races - White alone (%)
Races - White alone (% change since 2000)
Races - Black alone (%)
Races - Black alone (% change since 2000)
Races - American Indian alone (%)
Races - American Indian alone (% change since 2000)
Races - Asian alone (%)
Races - Asian alone (% change since 2000)
Races - Hispanic (%)
Races - Hispanic (% change since 2000)
Races - Native Hawaiian and Other Pacific Islander alone (%)
Races - Native Hawaiian and Other Pacific Islander alone (% change since 2000)
Races - Two or more races (%)
Races - Two or more races (% change since 2000)
Races - Other race alone (%)
Races - Other race alone (% change since 2000)
Racial diversity
Unemployment (%)
Unemployment (% change since 2000)
Unemployment (%) - White
Unemployment (%) - Black or African American
Unemployment (%) - Asian
Unemployment (%) - Hispanic or Latino
Unemployment (%) - American Indian and Alaska Native
Unemployment (%) - Multirace
Unemployment (%) - Other Race
Population density (people per square mile)
Population - Males (%)
Population - Females (%)
Population - Males (%) - White
Population - Males (%) - Black or African American
Population - Males (%) - Asian
Population - Males (%) - Hispanic or Latino
Population - Males (%) - American Indian and Alaska Native
Population - Males (%) - Multirace
Population - Males (%) - Other Race
Population - Females (%) - White
Population - Females (%) - Black or African American
Population - Females (%) - Asian
Population - Females (%) - Hispanic or Latino
Population - Females (%) - American Indian and Alaska Native
Population - Females (%) - Multirace
Population - Females (%) - Other Race
Coronavirus confirmed cases (Apr 27, 2024)
Deaths caused by coronavirus (Apr 27, 2024)
Coronavirus confirmed cases (per 100k population) (Apr 27, 2024)
Deaths caused by coronavirus (per 100k population) (Apr 27, 2024)
Daily increase in number of cases (Apr 27, 2024)
Weekly increase in number of cases (Apr 27, 2024)
Cases doubled (in days) (Apr 27, 2024)
Hospitalized patients (Apr 18, 2022)
Negative test results (Apr 18, 2022)
Total test results (Apr 18, 2022)
COVID Vaccine doses distributed (per 100k population) (Sep 19, 2023)
COVID Vaccine doses administered (per 100k population) (Sep 19, 2023)
COVID Vaccine doses distributed (Sep 19, 2023)
COVID Vaccine doses administered (Sep 19, 2023)
Likely homosexual households (%)
Likely homosexual households (% change since 2000)
Likely homosexual households - Lesbian couples (%)
Likely homosexual households - Lesbian couples (% change since 2000)
Likely homosexual households - Gay men (%)
Likely homosexual households - Gay men (% change since 2000)
Cost of living index
Median gross rent ($)
Median contract rent ($)
Median monthly housing costs ($)
Median house or condo value ($)
Median house or condo value ($ change since 2000)
Mean house or condo value by units in structure - 1, detached ($)
Mean house or condo value by units in structure - 1, attached ($)
Mean house or condo value by units in structure - 2 ($)
Mean house or condo value by units in structure by units in structure - 3 or 4 ($)
Mean house or condo value by units in structure - 5 or more ($)
Mean house or condo value by units in structure - Boat, RV, van, etc. ($)
Mean house or condo value by units in structure - Mobile home ($)
Median house or condo value ($) - White
Median house or condo value ($) - Black or African American
Median house or condo value ($) - Asian
Median house or condo value ($) - Hispanic or Latino
Median house or condo value ($) - American Indian and Alaska Native
Median house or condo value ($) - Multirace
Median house or condo value ($) - Other Race
Median resident age
Resident age diversity
Median resident age - Males
Median resident age - Females
Median resident age - White
Median resident age - Black or African American
Median resident age - Asian
Median resident age - Hispanic or Latino
Median resident age - American Indian and Alaska Native
Median resident age - Multirace
Median resident age - Other Race
Median resident age - Males - White
Median resident age - Males - Black or African American
Median resident age - Males - Asian
Median resident age - Males - Hispanic or Latino
Median resident age - Males - American Indian and Alaska Native
Median resident age - Males - Multirace
Median resident age - Males - Other Race
Median resident age - Females - White
Median resident age - Females - Black or African American
Median resident age - Females - Asian
Median resident age - Females - Hispanic or Latino
Median resident age - Females - American Indian and Alaska Native
Median resident age - Females - Multirace
Median resident age - Females - Other Race
Commute - mean travel time to work (minutes)
Travel time to work - Less than 5 minutes (%)
Travel time to work - Less than 5 minutes (% change since 2000)
Travel time to work - 5 to 9 minutes (%)
Travel time to work - 5 to 9 minutes (% change since 2000)
Travel time to work - 10 to 19 minutes (%)
Travel time to work - 10 to 19 minutes (% change since 2000)
Travel time to work - 20 to 29 minutes (%)
Travel time to work - 20 to 29 minutes (% change since 2000)
Travel time to work - 30 to 39 minutes (%)
Travel time to work - 30 to 39 minutes (% change since 2000)
Travel time to work - 40 to 59 minutes (%)
Travel time to work - 40 to 59 minutes (% change since 2000)
Travel time to work - 60 to 89 minutes (%)
Travel time to work - 60 to 89 minutes (% change since 2000)
Travel time to work - 90 or more minutes (%)
Travel time to work - 90 or more minutes (% change since 2000)
Marital status - Never married (%)
Marital status - Now married (%)
Marital status - Separated (%)
Marital status - Widowed (%)
Marital status - Divorced (%)
Median family income ($)
Median family income (% change since 2000)
Median non-family income ($)
Median non-family income (% change since 2000)
Median per capita income ($)
Median per capita income (% change since 2000)
Median family income ($) - White
Median family income ($) - Black or African American
Median family income ($) - Asian
Median family income ($) - Hispanic or Latino
Median family income ($) - American Indian and Alaska Native
Median family income ($) - Multirace
Median family income ($) - Other Race
Median year house/condo built
Median year apartment built
Year house built - Built 2005 or later (%)
Year house built - Built 2000 to 2004 (%)
Year house built - Built 1990 to 1999 (%)
Year house built - Built 1980 to 1989 (%)
Year house built - Built 1970 to 1979 (%)
Year house built - Built 1960 to 1969 (%)
Year house built - Built 1950 to 1959 (%)
Year house built - Built 1940 to 1949 (%)
Year house built - Built 1939 or earlier (%)
Average household size
Household density (households per square mile)
Average household size - White
Average household size - Black or African American
Average household size - Asian
Average household size - Hispanic or Latino
Average household size - American Indian and Alaska Native
Average household size - Multirace
Average household size - Other Race
Occupied housing units (%)
Vacant housing units (%)
Owner occupied housing units (%)
Renter occupied housing units (%)
Vacancy status - For rent (%)
Vacancy status - For sale only (%)
Vacancy status - Rented or sold, not occupied (%)
Vacancy status - For seasonal, recreational, or occasional use (%)
Vacancy status - For migrant workers (%)
Vacancy status - Other vacant (%)
Residents with income below the poverty level (%)
Residents with income below 50% of the poverty level (%)
Children below poverty level (%)
Poor families by family type - Married-couple family (%)
Poor families by family type - Male, no wife present (%)
Poor families by family type - Female, no husband present (%)
Poverty status for native-born residents (%)
Poverty status for foreign-born residents (%)
Poverty among high school graduates not in families (%)
Poverty among people who did not graduate high school not in families (%)
Residents with income below the poverty level (%) - White
Residents with income below the poverty level (%) - Black or African American
Residents with income below the poverty level (%) - Asian
Residents with income below the poverty level (%) - Hispanic or Latino
Residents with income below the poverty level (%) - American Indian and Alaska Native
Residents with income below the poverty level (%) - Multirace
Residents with income below the poverty level (%) - Other Race
Air pollution - Air Quality Index (AQI)
Air pollution - CO
Air pollution - NO2
Air pollution - SO2
Air pollution - Ozone
Air pollution - PM10
Air pollution - PM25
Air pollution - Pb
Crime - Murders per 100,000 population
Crime - Rapes per 100,000 population
Crime - Robberies per 100,000 population
Crime - Assaults per 100,000 population
Crime - Burglaries per 100,000 population
Crime - Thefts per 100,000 population
Crime - Auto thefts per 100,000 population
Crime - Arson per 100,000 population
Crime - City-data.com crime index
Crime - Violent crime index
Crime - Property crime index
Crime - Murders per 100,000 population (5 year average)
Crime - Rapes per 100,000 population (5 year average)
Crime - Robberies per 100,000 population (5 year average)
Crime - Assaults per 100,000 population (5 year average)
Crime - Burglaries per 100,000 population (5 year average)
Crime - Thefts per 100,000 population (5 year average)
Crime - Auto thefts per 100,000 population (5 year average)
Crime - Arson per 100,000 population (5 year average)
Crime - City-data.com crime index (5 year average)
Crime - Violent crime index (5 year average)
Crime - Property crime index (5 year average)
1996 Presidential Elections Results (%) - Democratic Party (Clinton)
1996 Presidential Elections Results (%) - Republican Party (Dole)
1996 Presidential Elections Results (%) - Other
2000 Presidential Elections Results (%) - Democratic Party (Gore)
2000 Presidential Elections Results (%) - Republican Party (Bush)
2000 Presidential Elections Results (%) - Other
2004 Presidential Elections Results (%) - Democratic Party (Kerry)
2004 Presidential Elections Results (%) - Republican Party (Bush)
2004 Presidential Elections Results (%) - Other
2008 Presidential Elections Results (%) - Democratic Party (Obama)
2008 Presidential Elections Results (%) - Republican Party (McCain)
2008 Presidential Elections Results (%) - Other
2012 Presidential Elections Results (%) - Democratic Party (Obama)
2012 Presidential Elections Results (%) - Republican Party (Romney)
2012 Presidential Elections Results (%) - Other
2016 Presidential Elections Results (%) - Democratic Party (Clinton)
2016 Presidential Elections Results (%) - Republican Party (Trump)
2016 Presidential Elections Results (%) - Other
2020 Presidential Elections Results (%) - Democratic Party (Biden)
2020 Presidential Elections Results (%) - Republican Party (Trump)
2020 Presidential Elections Results (%) - Other
Ancestries Reported - Arab (%)
Ancestries Reported - Czech (%)
Ancestries Reported - Danish (%)
Ancestries Reported - Dutch (%)
Ancestries Reported - English (%)
Ancestries Reported - French (%)
Ancestries Reported - French Canadian (%)
Ancestries Reported - German (%)
Ancestries Reported - Greek (%)
Ancestries Reported - Hungarian (%)
Ancestries Reported - Irish (%)
Ancestries Reported - Italian (%)
Ancestries Reported - Lithuanian (%)
Ancestries Reported - Norwegian (%)
Ancestries Reported - Polish (%)
Ancestries Reported - Portuguese (%)
Ancestries Reported - Russian (%)
Ancestries Reported - Scotch-Irish (%)
Ancestries Reported - Scottish (%)
Ancestries Reported - Slovak (%)
Ancestries Reported - Subsaharan African (%)
Ancestries Reported - Swedish (%)
Ancestries Reported - Swiss (%)
Ancestries Reported - Ukrainian (%)
Ancestries Reported - United States (%)
Ancestries Reported - Welsh (%)
Ancestries Reported - West Indian (%)
Ancestries Reported - Other (%)
Educational Attainment - No schooling completed (%)
Educational Attainment - Less than high school (%)
Educational Attainment - High school or equivalent (%)
Educational Attainment - Less than 1 year of college (%)
Educational Attainment - 1 or more years of college (%)
Educational Attainment - Associate degree (%)
Educational Attainment - Bachelor's degree (%)
Educational Attainment - Master's degree (%)
Educational Attainment - Professional school degree (%)
Educational Attainment - Doctorate degree (%)
School Enrollment - Nursery, preschool (%)
School Enrollment - Kindergarten (%)
School Enrollment - Grade 1 to 4 (%)
School Enrollment - Grade 5 to 8 (%)
School Enrollment - Grade 9 to 12 (%)
School Enrollment - College undergrad (%)
School Enrollment - Graduate or professional (%)
School Enrollment - Not enrolled in school (%)
School enrollment - Public schools (%)
School enrollment - Private schools (%)
School enrollment - Not enrolled (%)
Median number of rooms in houses and condos
Median number of rooms in apartments
Housing units lacking complete plumbing facilities (%)
Housing units lacking complete kitchen facilities (%)
Density of houses
Urban houses (%)
Rural houses (%)
Households with people 60 years and over (%)
Households with people 65 years and over (%)
Households with people 75 years and over (%)
Households with one or more nonrelatives (%)
Households with no nonrelatives (%)
Population in households (%)
Family households (%)
Nonfamily households (%)
Population in families (%)
Family households with own children (%)
Median number of bedrooms in owner occupied houses
Mean number of bedrooms in owner occupied houses
Median number of bedrooms in renter occupied houses
Mean number of bedrooms in renter occupied houses
Median number of vehichles in owner occupied houses
Mean number of vehichles in owner occupied houses
Median number of vehichles in renter occupied houses
Mean number of vehichles in renter occupied houses
Mortgage status - with mortgage (%)
Mortgage status - with second mortgage (%)
Mortgage status - with home equity loan (%)
Mortgage status - with both second mortgage and home equity loan (%)
Mortgage status - without a mortgage (%)
Average family size
Average family size - White
Average family size - Black or African American
Average family size - Asian
Average family size - Hispanic or Latino
Average family size - American Indian and Alaska Native
Average family size - Multirace
Average family size - Other Race
Geographical mobility - Same house 1 year ago (%)
Geographical mobility - Moved within same county (%)
Geographical mobility - Moved from different county within same state (%)
Geographical mobility - Moved from different state (%)
Geographical mobility - Moved from abroad (%)
Place of birth - Born in state of residence (%)
Place of birth - Born in other state (%)
Place of birth - Native, outside of US (%)
Place of birth - Foreign born (%)
Housing units in structures - 1, detached (%)
Housing units in structures - 1, attached (%)
Housing units in structures - 2 (%)
Housing units in structures - 3 or 4 (%)
Housing units in structures - 5 to 9 (%)
Housing units in structures - 10 to 19 (%)
Housing units in structures - 20 to 49 (%)
Housing units in structures - 50 or more (%)
Housing units in structures - Mobile home (%)
Housing units in structures - Boat, RV, van, etc. (%)
House/condo owner moved in on average (years ago)
Renter moved in on average (years ago)
Year householder moved into unit - Moved in 1999 to March 2000 (%)
Year householder moved into unit - Moved in 1995 to 1998 (%)
Year householder moved into unit - Moved in 1990 to 1994 (%)
Year householder moved into unit - Moved in 1980 to 1989 (%)
Year householder moved into unit - Moved in 1970 to 1979 (%)
Year householder moved into unit - Moved in 1969 or earlier (%)
Means of transportation to work - Drove car alone (%)
Means of transportation to work - Carpooled (%)
Means of transportation to work - Public transportation (%)
Means of transportation to work - Bus or trolley bus (%)
Means of transportation to work - Streetcar or trolley car (%)
Means of transportation to work - Subway or elevated (%)
Means of transportation to work - Railroad (%)
Means of transportation to work - Ferryboat (%)
Means of transportation to work - Taxicab (%)
Means of transportation to work - Motorcycle (%)
Means of transportation to work - Bicycle (%)
Means of transportation to work - Walked (%)
Means of transportation to work - Other means (%)
Working at home (%)
Industry diversity
Most Common Industries - Agriculture, forestry, fishing and hunting, and mining (%)
Most Common Industries - Agriculture, forestry, fishing and hunting (%)
Most Common Industries - Mining, quarrying, and oil and gas extraction (%)
Most Common Industries - Construction (%)
Most Common Industries - Manufacturing (%)
Most Common Industries - Wholesale trade (%)
Most Common Industries - Retail trade (%)
Most Common Industries - Transportation and warehousing, and utilities (%)
Most Common Industries - Transportation and warehousing (%)
Most Common Industries - Utilities (%)
Most Common Industries - Information (%)
Most Common Industries - Finance and insurance, and real estate and rental and leasing (%)
Most Common Industries - Finance and insurance (%)
Most Common Industries - Real estate and rental and leasing (%)
Most Common Industries - Professional, scientific, and management, and administrative and waste management services (%)
Most Common Industries - Professional, scientific, and technical services (%)
Most Common Industries - Management of companies and enterprises (%)
Most Common Industries - Administrative and support and waste management services (%)
Most Common Industries - Educational services, and health care and social assistance (%)
Most Common Industries - Educational services (%)
Most Common Industries - Health care and social assistance (%)
Most Common Industries - Arts, entertainment, and recreation, and accommodation and food services (%)
Most Common Industries - Arts, entertainment, and recreation (%)
Most Common Industries - Accommodation and food services (%)
Most Common Industries - Other services, except public administration (%)
Most Common Industries - Public administration (%)
Occupation diversity
Most Common Occupations - Management, business, science, and arts occupations (%)
Most Common Occupations - Management, business, and financial occupations (%)
Most Common Occupations - Management occupations (%)
Most Common Occupations - Business and financial operations occupations (%)
Most Common Occupations - Computer, engineering, and science occupations (%)
Most Common Occupations - Computer and mathematical occupations (%)
Most Common Occupations - Architecture and engineering occupations (%)
Most Common Occupations - Life, physical, and social science occupations (%)
Most Common Occupations - Education, legal, community service, arts, and media occupations (%)
Most Common Occupations - Community and social service occupations (%)
Most Common Occupations - Legal occupations (%)
Most Common Occupations - Education, training, and library occupations (%)
Most Common Occupations - Arts, design, entertainment, sports, and media occupations (%)
Most Common Occupations - Healthcare practitioners and technical occupations (%)
Most Common Occupations - Health diagnosing and treating practitioners and other technical occupations (%)
Most Common Occupations - Health technologists and technicians (%)
Most Common Occupations - Service occupations (%)
Most Common Occupations - Healthcare support occupations (%)
Most Common Occupations - Protective service occupations (%)
Most Common Occupations - Fire fighting and prevention, and other protective service workers including supervisors (%)
Most Common Occupations - Law enforcement workers including supervisors (%)
Most Common Occupations - Food preparation and serving related occupations (%)
Most Common Occupations - Building and grounds cleaning and maintenance occupations (%)
Most Common Occupations - Personal care and service occupations (%)
Most Common Occupations - Sales and office occupations (%)
Most Common Occupations - Sales and related occupations (%)
Most Common Occupations - Office and administrative support occupations (%)
Most Common Occupations - Natural resources, construction, and maintenance occupations (%)
Most Common Occupations - Farming, fishing, and forestry occupations (%)
Most Common Occupations - Construction and extraction occupations (%)
Most Common Occupations - Installation, maintenance, and repair occupations (%)
Most Common Occupations - Production, transportation, and material moving occupations (%)
Most Common Occupations - Production occupations (%)
Most Common Occupations - Transportation occupations (%)
Most Common Occupations - Material moving occupations (%)
People in Group quarters - Institutionalized population (%)
People in Group quarters - Correctional institutions (%)
People in Group quarters - Federal prisons and detention centers (%)
People in Group quarters - Halfway houses (%)
People in Group quarters - Local jails and other confinement facilities (including police lockups) (%)
People in Group quarters - Military disciplinary barracks (%)
People in Group quarters - State prisons (%)
People in Group quarters - Other types of correctional institutions (%)
People in Group quarters - Nursing homes (%)
People in Group quarters - Hospitals/wards, hospices, and schools for the handicapped (%)
People in Group quarters - Hospitals/wards and hospices for chronically ill (%)
People in Group quarters - Hospices or homes for chronically ill (%)
People in Group quarters - Military hospitals or wards for chronically ill (%)
People in Group quarters - Other hospitals or wards for chronically ill (%)
People in Group quarters - Hospitals or wards for drug/alcohol abuse (%)
People in Group quarters - Mental (Psychiatric) hospitals or wards (%)
People in Group quarters - Schools, hospitals, or wards for the mentally retarded (%)
People in Group quarters - Schools, hospitals, or wards for the physically handicapped (%)
People in Group quarters - Institutions for the deaf (%)
People in Group quarters - Institutions for the blind (%)
People in Group quarters - Orthopedic wards and institutions for the physically handicapped (%)
People in Group quarters - Wards in general hospitals for patients who have no usual home elsewhere (%)
People in Group quarters - Wards in military hospitals for patients who have no usual home elsewhere (%)
People in Group quarters - Juvenile institutions (%)
People in Group quarters - Long-term care (%)
People in Group quarters - Homes for abused, dependent, and neglected children (%)
People in Group quarters - Residential treatment centers for emotionally disturbed children (%)
People in Group quarters - Training schools for juvenile delinquents (%)
People in Group quarters - Short-term care, detention or diagnostic centers for delinquent children (%)
People in Group quarters - Type of juvenile institution unknown (%)
People in Group quarters - Noninstitutionalized population (%)
People in Group quarters - College dormitories (includes college quarters off campus) (%)
People in Group quarters - Military quarters (%)
People in Group quarters - On base (%)
People in Group quarters - Barracks, unaccompanied personnel housing (UPH), (Enlisted/Officer), ;and similar group living quarters for military personnel (%)
People in Group quarters - Transient quarters for temporary residents (%)
People in Group quarters - Military ships (%)
People in Group quarters - Group homes (%)
People in Group quarters - Homes or halfway houses for drug/alcohol abuse (%)
People in Group quarters - Homes for the mentally ill (%)
People in Group quarters - Homes for the mentally retarded (%)
People in Group quarters - Homes for the physically handicapped (%)
People in Group quarters - Other group homes (%)
People in Group quarters - Religious group quarters (%)
People in Group quarters - Dormitories (%)
People in Group quarters - Agriculture workers' dormitories on farms (%)
People in Group quarters - Job Corps and vocational training facilities (%)
People in Group quarters - Other workers' dormitories (%)
People in Group quarters - Crews of maritime vessels (%)
People in Group quarters - Other nonhousehold living situations (%)
People in Group quarters - Other noninstitutional group quarters (%)
Residents speaking English at home (%)
Residents speaking English at home - Born in the United States (%)
Residents speaking English at home - Native, born elsewhere (%)
Residents speaking English at home - Foreign born (%)
Residents speaking Spanish at home (%)
Residents speaking Spanish at home - Born in the United States (%)
Residents speaking Spanish at home - Native, born elsewhere (%)
Residents speaking Spanish at home - Foreign born (%)
Residents speaking other language at home (%)
Residents speaking other language at home - Born in the United States (%)
Residents speaking other language at home - Native, born elsewhere (%)
Residents speaking other language at home - Foreign born (%)
Class of Workers - Employee of private company (%)
Class of Workers - Self-employed in own incorporated business (%)
Class of Workers - Private not-for-profit wage and salary workers (%)
Class of Workers - Local government workers (%)
Class of Workers - State government workers (%)
Class of Workers - Federal government workers (%)
Class of Workers - Self-employed workers in own not incorporated business and Unpaid family workers (%)
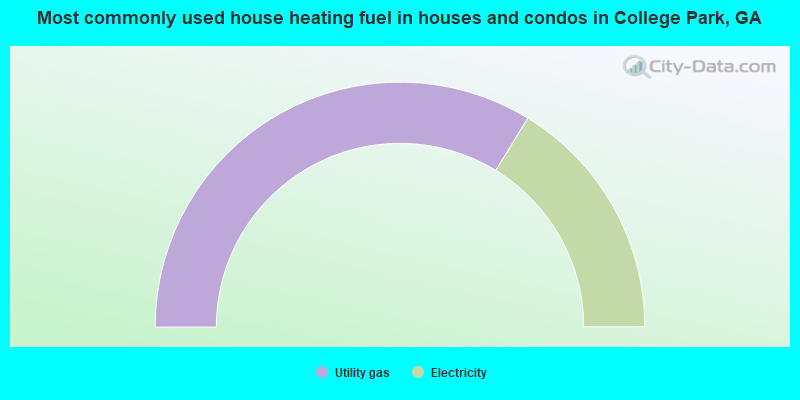
House heating fuel used in houses and condos - Utility gas (%)
House heating fuel used in houses and condos - Bottled, tank, or LP gas (%)
House heating fuel used in houses and condos - Electricity (%)
House heating fuel used in houses and condos - Fuel oil, kerosene, etc. (%)
House heating fuel used in houses and condos - Coal or coke (%)
House heating fuel used in houses and condos - Wood (%)
House heating fuel used in houses and condos - Solar energy (%)
House heating fuel used in houses and condos - Other fuel (%)
House heating fuel used in houses and condos - No fuel used (%)
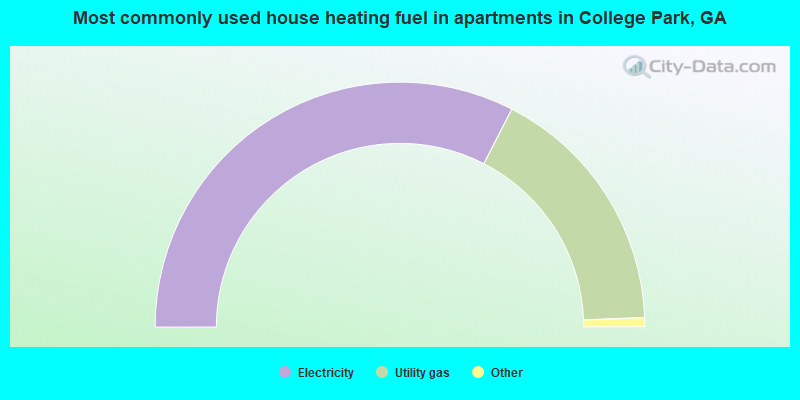
House heating fuel used in apartments - Utility gas (%)
House heating fuel used in apartments - Bottled, tank, or LP gas (%)
House heating fuel used in apartments - Electricity (%)
House heating fuel used in apartments - Fuel oil, kerosene, etc. (%)
House heating fuel used in apartments - Coal or coke (%)
House heating fuel used in apartments - Wood (%)
House heating fuel used in apartments - Solar energy (%)
House heating fuel used in apartments - Other fuel (%)
House heating fuel used in apartments - No fuel used (%)
Armed forces status - In Armed Forces (%)
Armed forces status - Civilian (%)
Armed forces status - Civilian - Veteran (%)
Armed forces status - Civilian - Nonveteran (%)
Fatal accidents locations in years 2005-2021
Fatal accidents locations in 2005
Fatal accidents locations in 2006
Fatal accidents locations in 2007
Fatal accidents locations in 2008
Fatal accidents locations in 2009
Fatal accidents locations in 2010
Fatal accidents locations in 2011
Fatal accidents locations in 2012
Fatal accidents locations in 2013
Fatal accidents locations in 2014
Fatal accidents locations in 2015
Fatal accidents locations in 2016
Fatal accidents locations in 2017
Fatal accidents locations in 2018
Fatal accidents locations in 2019
Fatal accidents locations in 2020
Fatal accidents locations in 2021
Alcohol use - People drinking some alcohol every month (%)
Alcohol use - People not drinking at all (%)
Alcohol use - Average days/month drinking alcohol
Alcohol use - Average drinks/week
Alcohol use - Average days/year people drink much
Audiometry - Average condition of hearing (%)
Audiometry - People that can hear a whisper from across a quiet room (%)
Audiometry - People that can hear normal voice from across a quiet room (%)
Audiometry - Ears ringing, roaring, buzzing (%)
Audiometry - Had a job exposure to loud noise (%)
Audiometry - Had off-work exposure to loud noise (%)
Blood Pressure & Cholesterol - Has high blood pressure (%)
Blood Pressure & Cholesterol - Checking blood pressure at home (%)
Blood Pressure & Cholesterol - Frequently checking blood cholesterol (%)
Blood Pressure & Cholesterol - Has high cholesterol level (%)
Consumer Behavior - Money monthly spent on food at supermarket/grocery store
Consumer Behavior - Money monthly spent on food at other stores
Consumer Behavior - Money monthly spent on eating out
Consumer Behavior - Money monthly spent on carryout/delivered foods
Consumer Behavior - Income spent on food at supermarket/grocery store (%)
Consumer Behavior - Income spent on food at other stores (%)
Consumer Behavior - Income spent on eating out (%)
Consumer Behavior - Income spent on carryout/delivered foods (%)
Current Health Status - General health condition (%)
Current Health Status - Blood donors (%)
Current Health Status - Has blood ever tested for HIV virus (%)
Current Health Status - Left-handed people (%)
Dermatology - People using sunscreen (%)
Diabetes - Diabetics (%)
Diabetes - Had a blood test for high blood sugar (%)
Diabetes - People taking insulin (%)
Diet Behavior & Nutrition - Diet health (%)
Diet Behavior & Nutrition - Milk product consumption (# of products/month)
Diet Behavior & Nutrition - Meals not home prepared (#/week)
Diet Behavior & Nutrition - Meals from fast food or pizza place (#/week)
Diet Behavior & Nutrition - Ready-to-eat foods (#/month)
Diet Behavior & Nutrition - Frozen meals/pizza (#/month)
Drug Use - People that ever used marijuana or hashish (%)
Drug Use - Ever used hard drugs (%)
Drug Use - Ever used any form of cocaine (%)
Drug Use - Ever used heroin (%)
Drug Use - Ever used methamphetamine (%)
Health Insurance - People covered by health insurance (%)
Kidney Conditions-Urology - Avg. # of times urinating at night
Medical Conditions - People with asthma (%)
Medical Conditions - People with anemia (%)
Medical Conditions - People with psoriasis (%)
Medical Conditions - People with overweight (%)
Medical Conditions - Elderly people having difficulties in thinking or remembering (%)
Medical Conditions - People who ever received blood transfusion (%)
Medical Conditions - People having trouble seeing even with glass/contacts (%)
Medical Conditions - People with arthritis (%)
Medical Conditions - People with gout (%)
Medical Conditions - People with congestive heart failure (%)
Medical Conditions - People with coronary heart disease (%)
Medical Conditions - People with angina pectoris (%)
Medical Conditions - People who ever had heart attack (%)
Medical Conditions - People who ever had stroke (%)
Medical Conditions - People with emphysema (%)
Medical Conditions - People with thyroid problem (%)
Medical Conditions - People with chronic bronchitis (%)
Medical Conditions - People with any liver condition (%)
Medical Conditions - People who ever had cancer or malignancy (%)
Mental Health - People who have little interest in doing things (%)
Mental Health - People feeling down, depressed, or hopeless (%)
Mental Health - People who have trouble sleeping or sleeping too much (%)
Mental Health - People feeling tired or having little energy (%)
Mental Health - People with poor appetite or overeating (%)
Mental Health - People feeling bad about themself (%)
Mental Health - People who have trouble concentrating on things (%)
Mental Health - People moving or speaking slowly or too fast (%)
Mental Health - People having thoughts they would be better off dead (%)
Oral Health - Average years since last visit a dentist
Oral Health - People embarrassed because of mouth (%)
Oral Health - People with gum disease (%)
Oral Health - General health of teeth and gums (%)
Oral Health - Average days a week using dental floss/device
Oral Health - Average days a week using mouthwash for dental problem
Oral Health - Average number of teeth
Pesticide Use - Households using pesticides to control insects (%)
Pesticide Use - Households using pesticides to kill weeds (%)
Physical Activity - People doing vigorous-intensity work activities (%)
Physical Activity - People doing moderate-intensity work activities (%)
Physical Activity - People walking or bicycling (%)
Physical Activity - People doing vigorous-intensity recreational activities (%)
Physical Activity - People doing moderate-intensity recreational activities (%)
Physical Activity - Average hours a day doing sedentary activities
Physical Activity - Average hours a day watching TV or videos
Physical Activity - Average hours a day using computer
Physical Functioning - People having limitations keeping them from working (%)
Physical Functioning - People limited in amount of work they can do (%)
Physical Functioning - People that need special equipment to walk (%)
Physical Functioning - People experiencing confusion/memory problems (%)
Physical Functioning - People requiring special healthcare equipment (%)
Prescription Medications - Average number of prescription medicines taking
Preventive Aspirin Use - Adults 40+ taking low-dose aspirin (%)
Reproductive Health - Vaginal deliveries (%)
Reproductive Health - Cesarean deliveries (%)
Reproductive Health - Deliveries resulted in a live birth (%)
Reproductive Health - Pregnancies resulted in a delivery (%)
Reproductive Health - Women breastfeeding newborns (%)
Reproductive Health - Women that had a hysterectomy (%)
Reproductive Health - Women that had both ovaries removed (%)
Reproductive Health - Women that have ever taken birth control pills (%)
Reproductive Health - Women taking birth control pills (%)
Reproductive Health - Women that have ever used Depo-Provera or injectables (%)
Reproductive Health - Women that have ever used female hormones (%)
Sexual Behavior - People 18+ that ever had sex (vaginal, anal, or oral) (%)
Sexual Behavior - Males 18+ that ever had vaginal sex with a woman (%)
Sexual Behavior - Males 18+ that ever performed oral sex on a woman (%)
Sexual Behavior - Males 18+ that ever had anal sex with a woman (%)
Sexual Behavior - Males 18+ that ever had any sex with a man (%)
Sexual Behavior - Females 18+ that ever had vaginal sex with a man (%)
Sexual Behavior - Females 18+ that ever performed oral sex on a man (%)
Sexual Behavior - Females 18+ that ever had anal sex with a man (%)
Sexual Behavior - Females 18+ that ever had any kind of sex with a woman (%)
Sexual Behavior - Average age people first had sex
Sexual Behavior - Average number of female sex partners in lifetime (males 18+)
Sexual Behavior - Average number of female vaginal sex partners in lifetime (males 18+)
Sexual Behavior - Average age people first performed oral sex on a woman (18+)
Sexual Behavior - Average number of woman performed oral sex on in lifetime (18+)
Sexual Behavior - Average number of male sex partners in lifetime (males 18+)
Sexual Behavior - Average number of male anal sex partners in lifetime (males 18+)
Sexual Behavior - Average age people first performed oral sex on a man (18+)
Sexual Behavior - Average number of male oral sex partners in lifetime (18+)
Sexual Behavior - People using protection when performing oral sex (%)
Sexual Behavior - Average number of times people have vaginal or anal sex a year
Sexual Behavior - People having sex without condom (%)
Sexual Behavior - Average number of male sex partners in lifetime (females 18+)
Sexual Behavior - Average number of male vaginal sex partners in lifetime (females 18+)
Sexual Behavior - Average number of female sex partners in lifetime (females 18+)
Sexual Behavior - Circumcised males 18+ (%)
Sleep Disorders - Average hours sleeping at night
Sleep Disorders - People that has trouble sleeping (%)
Smoking-Cigarette Use - People smoking cigarettes (%)
Taste & Smell - People 40+ having problems with smell (%)
Taste & Smell - People 40+ having problems with taste (%)
Taste & Smell - People 40+ that ever had wisdom teeth removed (%)
Taste & Smell - People 40+ that ever had tonsils teeth removed (%)
Taste & Smell - People 40+ that ever had a loss of consciousness because of a head injury (%)
Taste & Smell - People 40+ that ever had a broken nose or other serious injury to face or skull (%)
Taste & Smell - People 40+ that ever had two or more sinus infections (%)
Weight - Average height (inches)
Weight - Average weight (pounds)
Weight - Average BMI
Weight - People that are obese (%)
Weight - People that ever were obese (%)
Weight - People trying to lose weight (%)
Officers per 1,000 residents here:
5.05Georgia average:
2.45
Latest news from College Park, GA collected exclusively by city-data.com from local newspapers, TV, and radio stations
Ancestries: American (3.5%), African (1.7%), Ghanaian (1.1%).
Current Local Time:
Land area: 9.71 square miles.
Population density: 1,433 people per square mile (low).
890 residents are foreign born (2.6% Latin America , 2.0% Africa , 1.2% Asia ).
This city:
6.2%Georgia:
10.4%
Median real estate property taxes paid for housing units in 2000: College Park city:
0.9% ($903)Georgia:
0.9% ($919)
Nearest city with pop. 50,000+: Atlanta, GA
Nearest city with pop. 1,000,000+: Chicago, IL
Nearest cities:
Latitude: 33.65 N, Longitude: 84.46 W
Daytime population change due to commuting: +31,399 (+219.9%)Workers who live and work in this city: 2,030 (30.1%)
Property values in College Park, GA
Single-family new house construction building permits:
2022: 125 buildings , average cost: $154,2002021: 33 buildings , average cost: $135,6002020: 73 buildings , average cost: $98,3002019: 42 buildings , average cost: $185,5002018: 10 buildings , average cost: $287,5002017: 56 buildings , average cost: $162,5002016: 26 buildings , average cost: $176,9002015: 2 buildings , average cost: $360,0002014: 5 buildings , average cost: $160,2002013: 1 building , cost: $110,0002012: 4 buildings , average cost: $277,5002011: 7 buildings , average cost: $180,4002009: 1 building , cost: $220,0002008: 5 buildings , average cost: $222,0002007: 18 buildings , average cost: $236,7002006: 87 buildings , average cost: $139,1002005: 95 buildings , average cost: $194,8002004: 33 buildings , average cost: $199,8002003: 77 buildings , average cost: $91,6002002: 37 buildings , average cost: $95,7002001: 9 buildings , average cost: $127,1002000: 5 buildings , average cost: $86,1001999: 2 buildings , average cost: $110,0001998: 3 buildings , average cost: $57,3001997: 2 buildings , average cost: $123,500Unemployment in December 2023:
Population change in the 1990s: +379 (+1.9%).
Most common occupations in College Park, GA (%)
Both Males Females
Other office and administrative support workers, including supervisors (5.0%)
Building and grounds cleaning and maintenance occupations (4.8%)
Customer service representatives (4.7%)
Other production occupations, including supervisors (4.4%)
Driver/sales workers and truck drivers (4.2%)
Cashiers (4.1%)
Material recording, scheduling, dispatching, and distributing workers (3.9%)
Driver/sales workers and truck drivers (7.8%)
Other production occupations, including supervisors (6.0%)
Material recording, scheduling, dispatching, and distributing workers (5.2%)
Building and grounds cleaning and maintenance occupations (5.1%)
Other management occupations, except farmers and farm managers (4.6%)
Electrical equipment mechanics and other installation, maintenance, and repair workers, including supervisors (4.2%)
Laborers and material movers, hand (4.0%)
Other office and administrative support workers, including supervisors (7.5%)
Customer service representatives (7.1%)
Cashiers (6.8%)
Secretaries and administrative assistants (4.7%)
Information and record clerks, except customer service representatives (4.5%)
Building and grounds cleaning and maintenance occupations (4.4%)
Laborers and material movers, hand (3.6%)
Tornado activity:
College Park-area historical tornado activity is slightly above Georgia state average. It is 60% greater than the overall U.S. average.
On 11/22/1992, a category F4 (max. wind speeds 207-260 mph) tornado 22.5 miles away from the College Park city center injured 46 people and caused between $5,000,000 and $50,000,000 in damages.
On 1/10/1972, a category F3 (max. wind speeds 158-206 mph) tornado 3.6 miles away from the city center killed one person and injured 9 people and caused between $50,000 and $500,000 in damages.
Earthquake activity:
College Park-area historical earthquake activity is significantly above Georgia state average. It is 52% greater than the overall U.S. average. On 4/29/2003 at 08:59:39, a magnitude 4.9 (4.4 MB, 4.6 MW, 4.9 LG, Class: Light, Intensity: IV - V) earthquake occurred 89.1 miles away from College Park center On 8/2/1974 at 08:52:09, a magnitude 4.9 (4.3 MB, 4.9 LG) earthquake occurred 114.2 miles away from College Park center On 4/29/2003 at 08:59:39, a magnitude 4.6 (4.6 MW, Depth: 12.3 mi) earthquake occurred 89.1 miles away from College Park center On 1/18/1999 at 07:00:53, a magnitude 4.8 (4.8 MB, 4.0 LG, Depth: 0.6 mi) earthquake occurred 162.3 miles away from the city center On 11/30/1973 at 07:48:41, a magnitude 4.7 (4.7 MB, 4.6 ML) earthquake occurred 151.4 miles away from the city center On 12/12/2018 at 09:14:43, a magnitude 4.4 (4.4 MW, Depth: 4.9 mi) earthquake occurred 136.8 miles away from College Park center Magnitude types: regional Lg-wave magnitude (LG), body-wave magnitude (MB), local magnitude (ML), moment magnitude (MW) Natural disasters: The number of natural disasters in Fulton County (15) is near the US average (15).Major Disasters (Presidential) Declared: 10Emergencies Declared: 4Tornadoes: 5, Floods: 4, Storms: 4, Winter Storms: 4, Hurricanes: 3, Heavy Rains: 2, Drought: 1, Snowfall: 1, Tropical Storm: 1, Wind: 1, Other: 1 (Note: some incidents may be assigned to more than one category). Hospitals and medical centers in College Park: ANCHOR HOSPITAL (5454 YORKTOWNE DRIVE) DIVINE HOSPICE CARE (5532 OLD NATIONAL HWY, BLDG-G, SUITE 150) COLLEGE PARK HEALTH CARE CTR (1765 TEMPLE AVENUE)
BMA OF ATLANTA INC (1720 PHOENIX PARKWAY)
COLLEGE PARK DIALYSIS CENTER LLC (2545 SULLIVAN ROAD)
Amtrak station near College Park: 12 miles: ATLANTA (1688 PEACHTREE ST. NW) Services: ticket office, partially wheelchair accessible, enclosed waiting area, public restrooms, public payphones, vending machines, paid short-term parking, paid long-term parking, taxi stand, public transit connection.
Colleges/universities with over 2000 students nearest to College Park:
Atlanta Metropolitan State College (about 6 miles; Atlanta, GA ; Full-time enrollment: 2,437)
Atlanta Technical College (about 6 miles; Atlanta, GA ; FT enrollment: 4,217)
Spelman College (about 8 miles; Atlanta, GA ; FT enrollment: 2,383)
Morehouse College (about 8 miles; Atlanta, GA ; FT enrollment: 2,379)
Clark Atlanta University (about 8 miles; Atlanta, GA ; FT enrollment: 3,201)
Georgia State University (about 9 miles; Atlanta, GA ; FT enrollment: 30,264)
Clayton State University (about 9 miles; Morrow, GA ; FT enrollment: 5,844)
Public high schools in College Park: BANNEKER HIGH SCHOOL Students: 1,735, Location: 5935 FELDWOOD RD, Grades: 9-12)NORTH CLAYTON HIGH SCHOOL Students: 1,488, Location: 1525 NORMAN DR, Grades: 9-12)ATLANTA YOUTH DETENTION CENTER Location: 5651 STONEWALL TELL RD, Grades: 9-12)
MCCLARIN HIGH SCHOOL Location: 3605 MAIN ST, Grades: 9-12)
Private high school in College Park: UPPER ROOM MINISTRIES CHRISTIAN ACADEMY Students: 32, Location: 587 GARDEN WALK BLVD, Grades: PK-11)
Biggest public elementary/middle schools in College Park: STONEWALL TELL ELEMENTARY SCHOOL Students: 1,085, Location: 3310 STONEWALL TELL RD, Grades: PK-5)NORTH CLAYTON MIDDLE SCHOOL Students: 942, Location: 5517 W FAYETTEVILLE RD, Grades: 6-8)MARTIN LUTHER KING- JR. ELEMENTARY SCHOOL Students: 876, Location: 5745 W LEES MILL RD, Grades: PK-5)NOLAN ELEMENTARY SCHOOL Students: 817, Location: 2725 CREEL RD, Grades: PK-5)S. L. LEWIS ELEMENTARY SCHOOL Students: 727, Location: 6201 CONNELL RD, Grades: PK-5)NORTHCUTT ELEMENTARY SCHOOL Students: 657, Location: 5451 W FAYETTEVILLE RD, Grades: PK-5)LEE ELEMENTARY SCHOOL Students: 644, Location: 4600 SCARBOROUGH RD, Grades: PK-5)TUBMAN ELEMENTARY SCHOOL Students: 541, Location: 2861 LAKESHORE DR, Grades: PK-5)WEST CLAYTON ELEMENTARY SCHOOL Students: 533, Location: 5580 RIVERDALE RD, Grades: PK-5)MCNAIR MIDDLE SCHOOL Location: 2800 BURDETT RD, Grades: 6-8)
Private elementary/middle schools in College Park: NEW CHANGE EARLY LEARNING CENTER Students: 100, Location: 2500 BURDETT RD, Grades: PK-1)
PRIME CARE LEARNING CENTER Students: 52, Location: 6755 OLD NATIONAL HWY, Grades: PK-1)
See full list of schools located in College Park
Notable locations in College Park: (A) , Royal Phoenix Business Park (B) , Gordon Morris Memorial Golf Course (C) , Airport Station (D) , S.D. Sid Truitt 4-H Camp (E) , College Street Recreation Center (F) , College Park Fire Department Station 1 Headquarters (G) , College Park Police Station (H) , Atlanta Fire / Rescue Station 32 Airport Division (I) , College Park Fire Department Station 2 (J) , Fulton County School Supply Warehouse (K) , College Park City Hall (L) , College Park Branch Atlanta-Fulton Library (M) . Display/hide their locations on the map
Shopping Centers: (1) , Jamestown Shopping Center (2) , Virginia Plaza Shopping Center (3) . Display/hide their locations on the map
Churches in College Park include: (A) , College Park First United Methodist Church (B) , Richard C Gresham Chapel (C) , Liberty Church of God in Christ (D) , Liberty Church of God In Christ (E) , Hyatt Memorial Methodist Church (F) , Emmaus Road Baptist Church (G) , Mercer Avenue Church (H) , Mount Zion Church (I) . Display/hide their locations on the map
Cemeteries: (1) , College Park View Cemetery (2) . Display/hide their locations on the map
Parks in College Park include: (1) , Tenneco Park (2) , Barrett Park (3) , Brandon Memorial Park (4) , Brenningham Park (5) , Jamestown Park (6) , Peter Pan Park (7) . Display/hide their locations on the map
Hotels:
Birthplace of: Bill Curry - College football player, Monica (entertainer) - Singer, Fletcher Thompson - Politician, Jonas Jennings - 2005 NFL player (San Francisco 49ers, born : Nov 21, 1977), Josh Smith - NBA player (Atlanta Hawks, born : Dec 5, 1985), Pacman Jones - 2005 NFL player (Tennessee Titans, born : Sep 30, 1983), Tameka Cottle - Singer-songwriter, Delino DeShields, Jr. - Baseball player, Carlos Smith - College basketball player (South Alabama Jaguars), Carlos Thomas - Player of and football.
Fulton County has a predicted average indoor radon screening level greater than 4 pCi/L (pico curies per liter) - Highest Potential Drinking water stations with addresses in College Park and their reported violations in the past:
COLLEGE PARK (Population served: 20,382, Purch surface water):
Past monitoring violations:
Follow-up Or Routine LCR Tap M/R - In OCT-01-2006, Contaminant: Lead and Copper Rule. Follow-up actions: St Public Notif requested (MAR-02-2007), St Violation/Reminder Notice (MAR-02-2007), St Compliance achieved (SEP-14-2010)
Average household size: This city:
2.5 peopleGeorgia:
2.6 people
Percentage of family households: This city:
57.2%Whole state:
68.5%
Percentage of households with unmarried partners: This city:
9.8%Whole state:
5.9%
Likely homosexual households (counted as self-reported same-sex unmarried-partner households)
Lesbian couples: 0.6% of all households Gay men: 0.6% of all households
7 people in group homes for juveniles (non-correctional) in 2010people in group homes intended for adults in 2010People in group quarters in College Park in 2000:
94 people in nursing homes
31 people in other noninstitutional group quarters
27 people in homes or halfway houses for drug/alcohol abuse
14 people in local jails and other confinement facilities (including police lockups)
Banks with branches in College Park (2011 data):
SunTrust Bank: River Station Branch at 5420 W Fayetteville Rd, branch established on 2009/05/04; Historic Downtown College Park Branc at 3857 Main Street, branch established on 2010/01/19. Info updated 2010/05/27: Bank assets: $171,291.7 mil, Deposits: $129,833.2 mil, headquarters in Atlanta, GA, positive income , Commercial Lending Specialization, 1716 total offices , Holding Company: Suntrust Banks, Inc.
Wells Fargo Bank, National Association: Old National at 5060 Old Bill Cook Road, branch established on 1974/09/16. Info updated 2011/04/05: Bank assets: $1,161,490.0 mil, Deposits: $905,653.0 mil, headquarters in Sioux Falls, SD, positive income , 6395 total offices , Holding Company: Wells Fargo & Company
Bank of America, National Association: Old National Highway Branch at 5199 Old National Highway, branch established on 1973/03/19. Info updated 2009/11/18: Bank assets: $1,451,969.3 mil, Deposits: $1,077,176.8 mil, headquarters in Charlotte, NC, positive income , 5782 total offices , Holding Company: Bank Of America Corporation
For population 15 years and over in College Park:
Never married: 50.3%Now married: 30.1%Separated: 3.2%Widowed: 3.6%Divorced: 12.9% For population 25 years and over in College Park:
High school or higher: 91.6%Bachelor's degree or higher: 28.3%Graduate or professional degree: 11.1%Unemployed: 8.3%Mean travel time to work (commute): 19.5 minutes
Education Gini index (Inequality in education) Here:
10.8Georgia average:
12.2
Religion statistics for College Park, GA (based on Fulton County data)
Religion Adherents Congregations Evangelical Protestant 204,409 357 Mainline Protestant 166,727 153 Catholic 91,391 18 Black Protestant 90,642 135 Other 50,075 86 Orthodox 2,496 6 None 314,841 -
Source: Clifford Grammich, Kirk Hadaway, Richard Houseal, Dale E.Jones, Alexei Krindatch, Richie Stanley and Richard H.Taylor. 2012. 2010 U.S.Religion Census: Religious Congregations & Membership Study. Association of Statisticians of American Religious Bodies. Jones, Dale E., et al. 2002. Congregations and Membership in the United States 2000. Nashville, TN: Glenmary Research Center. Graphs represent county-level data
Food Environment Statistics: Number of grocery stores : 190Fulton County :
1.91 / 10,000 pop.Georgia :
1.91 / 10,000 pop.
Number of supercenters and club stores : 7This county :
0.07 / 10,000 pop.Georgia :
0.15 / 10,000 pop.
Number of convenience stores (no gas) : 59Here :
0.59 / 10,000 pop.Georgia :
0.86 / 10,000 pop.
Number of convenience stores (with gas) : 298This county :
3.00 / 10,000 pop.Georgia :
5.12 / 10,000 pop.
Number of full-service restaurants : 1,102This county :
11.10 / 10,000 pop.State :
7.41 / 10,000 pop.
Adult diabetes rate : Fulton County :
8.6%Georgia :
10.4%
Adult obesity rate : Fulton County :
23.2%Georgia :
27.8%
Low-income preschool obesity rate : Fulton County :
15.1%State :
14.6%
Health and Nutrition: Healthy diet rate : College Park:
47.2%State:
48.9%
Average overall health of teeth and gums : College Park:
47.3%Georgia:
46.5%
Average BMI : This city:
29.7Georgia:
28.9
People feeling badly about themselves : This city:
17.9%Georgia:
20.4%
People not drinking alcohol at all : This city:
12.3%Georgia:
10.8%
Average hours sleeping at night : College Park:
6.6Georgia:
6.7
General health condition : This city:
55.9%Georgia:
56.2%
Average condition of hearing : College Park:
85.0%State:
80.8%
More about Health and Nutrition of College Park, GA Residents
Local government employment and payroll (March 2022)
Function
Full-time employees
Monthly full-time payroll
Average yearly full-time wage
Part-time employees
Monthly part-time payroll
Police Protection - Officers
77 $355,177 $55,352 0 $0 Other and Unallocable
75 $364,575 $58,332 9 $7,860 Firefighters
67 $310,405 $55,595 0 $0 Solid Waste Management
22 $70,379 $38,389 0 $0 Parks and Recreation
16 $119,038 $89,279 10 $9,840 Water Supply
16 $57,922 $43,442 0 $0 Financial Administration
15 $62,343 $49,874 0 $0 Other Government Administration
15 $73,916 $59,133 0 $0 Electric Power
11 $68,874 $75,135 0 $0 Streets and Highways
8 $30,202 $45,303 0 $0 Judicial and Legal
5 $19,802 $47,525 0 $0 Fire - Other
5 $28,350 $68,040 0 $0 Housing and Community Development (Local)
4 $24,236 $72,708 0 $0 Correction
4 $13,441 $40,323 0 $0 Sewerage
3 $10,030 $40,120 0 $0 Natural Resources
1 $2,736 $32,832 0 $0 Police - Other
0 $0 9 $6,146
Totals for Government
344 $1,611,426 $56,213 28 $23,846
College Park government finances - Expenditure in 2021 (per resident):
Construction - Parks and Recreation: $254,000 ($18.25)
Regular Highways: $164,000 ($11.79)Current Operations - Electric Utilities: $33,708,000 ($2422.60)
General - Other: $17,971,000 ($1291.58)Police Protection: $10,577,000 ($760.17)Local Fire Protection: $6,071,000 ($436.32)Central Staff Services: $5,068,000 ($364.24)Sewerage: $4,592,000 ($330.03)Water Utilities: $4,159,000 ($298.91)Solid Waste Management: $2,875,000 ($206.63)Parks and Recreation: $2,577,000 ($185.21)Financial Administration: $2,210,000 ($158.83)Regular Highways: $1,650,000 ($118.59)Correctional Institutions: $398,000 ($28.60)Judicial and Legal Services: $341,000 ($24.51)Protective Inspection and Regulation - Other: $332,000 ($23.86)General - Interest on Debt: $10,452,000 ($751.19)
Intergovernmental to Local - Other - Regular Highways: $59,000 ($4.24)
Other - Police Protection: $4,000 ($0.29)Other Capital Outlay - Police Protection: $312,000 ($22.42)
Local Fire Protection: $27,000 ($1.94)Water Utilities - Interest on Debt: $133,000 ($9.56)
College Park government finances - Revenue in 2021 (per resident):
Charges - Other: $10,400,000 ($747.45)
Sewerage: $7,220,000 ($518.90)Solid Waste Management: $3,210,000 ($230.70)Parks and Recreation: $452,000 ($32.49)Local Intergovernmental - General Local Government Support: $4,406,000 ($316.66)
Other: $3,930,000 ($282.45)Miscellaneous - Fines and Forfeits: $652,000 ($46.86)
General Revenue - Other: $503,000 ($36.15)Interest Earnings: $2,000 ($0.14)Revenue - Electric Utilities: $35,899,000 ($2580.06)
Water Utilities: $2,880,000 ($206.99)State Intergovernmental - General Local Government Support: $93,000 ($6.68)
Tax - Property: $17,423,000 ($1252.19)
Other Selective Sales: $6,225,000 ($447.39)Occupation and Business License - Other: $3,122,000 ($224.38)Public Utilities Sales: $1,996,000 ($143.45)Insurance Premiums Sales: $1,175,000 ($84.45)Alcoholic Beverage Sales: $895,000 ($64.32)Other License: $687,000 ($49.37)Other: $580,000 ($41.68)
College Park government finances - Debt in 2021 (per resident):
Long Term Debt - Beginning Outstanding - Unspecified Public Purpose: $160,410,000 ($11528.68)
Outstanding Unspecified Public Purpose: $148,724,000 ($10688.80)Retired Unspecified Public Purpose: $11,685,000 ($839.80)Short Term Debt Outstanding - End of Fiscal Year: $12,575,000 ($903.77)
Beginning: $11,691,000 ($840.23)
College Park government finances - Cash and Securities in 2021 (per resident):
Other Funds - Cash and Securities: $35,378,000 ($2542.62)
11.63% of this county's 2021 resident taxpayers lived in other counties in 2020 ($85,149 average adjusted gross income )
Here:
11.63%Georgia average:
10.21%
0.01% of residents moved from foreign countries ($76 average AGI )Fulton County:
0.01%Georgia average:
0.04%
Top counties from which taxpayers relocated into this county between 2020 and 2021:
12.21% of this county's 2020 resident taxpayers moved to other counties in 2021 ($93,086 average adjusted gross income )
Here:
12.21%Georgia average:
9.60%
0.01% of residents moved to foreign countries ($58 average AGI )Fulton County:
0.01%Georgia average:
0.03%
Top counties to which taxpayers relocated from this county between 2020 and 2021:
Businesses in College Park, GA
Name Count Name Count
ALDI 1 McDonald's 3 Advance Auto Parts 2 Microtel 1 AutoZone 1 Motel 6 1 Best Western 1 Pizza Hut 1 Budget Car Rental 1 Popeyes 1 Burger King 1 Quality 2 CVS 1 Ruby Tuesday 1 Church's Chicken 2 SAS Shoes 1 Comfort Inn 2 SONIC Drive-In 1 DHL 1 Sears 2 Dairy Queen 1 Sleep Inn 1 Days Inn 1 Super 8 3 Econo Lodge 1 T-Mobile 1 FedEx 5 Taco Bell 1 H&R Block 2 True Value 1 Hilton 1 U-Haul 7 Holiday Inn 1 Waffle House 3 Kroger 1 Walgreens 1 LA Fitness 1 Walmart 1 Marriott 3
Strongest AM radio stations in College Park:
WGST (640 AM; 50 kW; ATLANTA, GA; Owner: CITICASTERS LICENSES, L.P.)
WAOK (1380 AM; 50 kW; ATLANTA, GA; Owner: INFINITY BROADCASTING OPERATIONS, INC.)
WGUN (1010 AM; 50 kW; ATLANTA, GA; Owner: WGUN, INC.)
WTJH (1260 AM; 5 kW; EAST POINT, GA; Owner: WILLIS BROADCASTING CORPORATION)
WQXI (790 AM; 28 kW; ATLANTA, GA; Owner: JEFFERSON-PILOT COMMUNICATIONS COMPANY OF GEORGIA)
WSB (750 AM; 50 kW; ATLANTA, GA; Owner: CXR HOLDINGS, INC.)
WMLB (1160 AM; 50 kW; EAST POINT, GA; Owner: ATLANTA AREA BROADCASTING, INC.)
WGKA (1190 AM; 25 kW; ATLANTA, GA; Owner: SALEM MEDIA OF GEORGIA, INC.)
WCNN (680 AM; 50 kW; NORTH ATLANTA, GA; Owner: DICKEY BROADCASTING COMPANY)
WAZX (1550 AM; 50 kW; SMYRNA, GA; Owner: GA-MEX BROADCASTING, INC.)
WYZE (1480 AM; 5 kW; ATLANTA, GA)
WAEC (860 AM; 5 kW; ATLANTA, GA; Owner: WAEC LICENSE LIMITED PARTNERSHIP)
WFTD (1080 AM; daytime; 50 kW; MARIETTA, GA; Owner: PRIETO ENTERPRISES, INC.)
Strongest FM radio stations in College Park:
WAMJ (102.5 FM; MABLETON, GA; Owner: NEW MABLETON BROADCASTING CORPORATION)
WRFG (89.3 FM; ATLANTA, GA; Owner: RADIO FREE GEORGIA BROADCASTING FOUNDATION INC)
WWWQ (100.5 FM; ANNISTON, AL; Owner: WNNX LICO, INC.)
WNNX (99.7 FM; ATLANTA, GA; Owner: WNNX LICO, INC.)
WSB-FM (98.5 FM; ATLANTA, GA; Owner: CXR HOLDINGS, INC.)
WSTR (94.1 FM; SMYRNA, GA; Owner: JEFFERSON-PILOT COMMUNICATIONS COMPANY OF GEORGIA)
WVEE (103.3 FM; ATLANTA, GA; Owner: INFINITY BROADCASTING OPERATIONS, INC.)
WZGC (92.9 FM; ATLANTA, GA; Owner: INFINITY BROADCASTING CORP. OF ATLANTA)
WKHX-FM (101.5 FM; MARIETTA, GA; Owner: ABC, INC.)
WKLS (96.1 FM; ATLANTA, GA; Owner: CITICASTERS LICENSES, L.P.)
WLTM (94.9 FM; ATLANTA, GA; Owner: CITICASTERS LICENSES, L.P.)
WHTA (107.9 FM; HAMPTON, GA; Owner: RADIO ONE LICENSES, LLC)
WCLK (91.9 FM; ATLANTA, GA; Owner: CLARK ATLANTA UNIVERSITY)
WPZE (97.5 FM; FAYETTEVILLE, GA; Owner: ROA LICENSES, LLC)
WRAS (88.5 FM; ATLANTA, GA; Owner: GEORGIA STATE UNIVERSITY)
WREK (91.1 FM; ATLANTA, GA; Owner: RADIO COMMNS. BD, GEORGIA INST. TECH)
WABE (90.1 FM; ATLANTA, GA; Owner: BOARD OF EDUCATION, CITY OF ATLANTA)
WALR-FM (104.1 FM; LA GRANGE, GA; Owner: CXR HOLDINGS, INC.)
WFSH-FM (104.7 FM; ATHENS, GA; Owner: SOUTH TEXAS BROADCASTING, INC.)
WBZY-FM (96.7 FM; PEACHTREE CITY, GA; Owner: CITICASTERS LICENSES, L.P.)
TV broadcast stations around College Park:
WSB-TV (Channel 2; ATLANTA, GA; Owner: WSB-TV HOLDINGS, INC.)
WHSG (Channel 63; MONROE, GA; Owner: TRINITY BROADCASTING NETWORK)
WUPA (Channel 69; ATLANTA, GA; Owner: VIACOM STATIONS GROUP OF ATLANTA INC.)
WXIA-TV (Channel 11; ATLANTA, GA; Owner: GANNETT GEORGIA, L.P.)
WUVG (Channel 34; ATHENS, GA; Owner: UNIVISION ATLANTA LLC)
WANN-LP (Channel 32; ATLANTA, GA; Owner: PRISM BROADCASTING NETWORK, INC.)
WDTA-LP (Channel 53; FAYETTEVILLE, GA; Owner: WORD OF GOD FELLOWSHIP, INC.)
WAGA (Channel 5; ATLANTA, GA; Owner: FOX TELEVISION STATIONS, INC.)
WPBA (Channel 30; ATLANTA, GA; Owner: BOARD OF EDUCATION OF THE CITY OF ATLANTA)
WANX-LP (Channel 26; ATLANTA, GA; Owner: PRISM BROADCASTING NETWORK, INC.)
WTHC-LP (Channel 42; ATLANTA, GA; Owner: THE ATLANTA CHANNEL, INC.)
WATL (Channel 36; ATLANTA, GA; Owner: WATL, LLC)
WTBS (Channel 17; ATLANTA, GA; Owner: SUPERSTATION, INC.)
WGCL-TV (Channel 46; ATLANTA, GA; Owner: MEREDITH CORPORATION)
WIRE-CA (Channel 40; ATLANTA, GA; Owner: COMMERCIAL BROADCASTING CORP.)
W24AL (Channel 24; ATLANTA, GA; Owner: VENTANA TELEVISION, INC.)
WATC (Channel 57; ATLANTA, GA; Owner: COMMUNITY TELEVISION, INC.)
W04DB (Channel 4; ATLANTA, GA; Owner: VVILPTV, INC.)
WSKC-LP (Channel 59; ATLANTA, GA; Owner: KM LPTV OF ATLANTA, L.L.C.)
W52CL (Channel 52; MACON, GA; Owner: TRINITY BROADCASTING NETWORK)
WGTV (Channel 8; ATHENS, GA; Owner: GEORGIA PUBLIC TELECOMMUNICATIONS COMMISSION)
National Bridge Inventory (NBI) Statistics 191 Number of bridges2,054ft / 626m Total length $171,960,000 Total costs5,787,450 Total average daily traffic119,823 Total average daily truck traffic
New bridges - historical statistics
1 1930-1939 3 1950-1959 8 1960-1969 6 1970-1979 35 1980-1989 1 1990-1999 3 2000-2009 5 2010-2019 1 2020-2022
See full National Bridge Inventory statistics for College Park, GA
Home Mortgage Disclosure Act Aggregated Statistics For Year 2009(Based on 3 full and 5 partial tracts) A) FHA, FSA/RHS & VA B) Conventional C) Refinancings D) Home Improvement Loans E) Loans on Dwellings For 5+ Families F) Non-occupant Loans on Number Average Value Number Average Value Number Average Value Number Average Value Number Average Value Number Average Value
LOANS ORIGINATED 51 $133,327 23 $120,093 109 $161,669 4 $33,380 2 $374,020 17 $102,402 APPLICATIONS APPROVED, NOT ACCEPTED 2 $108,225 2 $54,240 14 $198,694 1 $14,530 0 $0 2 $80,465 APPLICATIONS DENIED 13 $96,898 13 $131,612 106 $150,614 13 $38,446 0 $0 22 $101,312 APPLICATIONS WITHDRAWN 15 $121,203 6 $260,513 50 $161,876 2 $62,650 0 $0 6 $106,823 FILES CLOSED FOR INCOMPLETENESS 3 $190,983 3 $207,073 11 $97,738 1 $23,280 0 $0 1 $82,780
Aggregated Statistics For Year 2008(Based on 3 full and 5 partial tracts) A) FHA, FSA/RHS & VA B) Conventional C) Refinancings D) Home Improvement Loans E) Loans on Dwellings For 5+ Families F) Non-occupant Loans on G) Loans On Manufactured Number Average Value Number Average Value Number Average Value Number Average Value Number Average Value Number Average Value Number Average Value
LOANS ORIGINATED 71 $151,329 74 $155,590 111 $157,278 11 $48,873 1 $773,870 48 $114,804 0 $0 APPLICATIONS APPROVED, NOT ACCEPTED 5 $147,120 17 $305,229 23 $158,743 3 $113,103 0 $0 12 $161,146 1 $13,760 APPLICATIONS DENIED 22 $161,783 42 $260,358 150 $140,387 39 $51,412 0 $0 39 $126,159 0 $0 APPLICATIONS WITHDRAWN 15 $159,627 21 $194,004 68 $139,722 3 $129,617 0 $0 24 $115,020 0 $0 FILES CLOSED FOR INCOMPLETENESS 4 $192,945 3 $203,360 13 $147,842 2 $30,330 0 $0 2 $157,040 0 $0
Aggregated Statistics For Year 2007(Based on 3 full and 5 partial tracts) A) FHA, FSA/RHS & VA B) Conventional C) Refinancings D) Home Improvement Loans E) Loans on Dwellings For 5+ Families F) Non-occupant Loans on Number Average Value Number Average Value Number Average Value Number Average Value Number Average Value Number Average Value
LOANS ORIGINATED 30 $154,772 206 $166,123 177 $146,602 24 $85,640 3 $716,827 80 $129,251 APPLICATIONS APPROVED, NOT ACCEPTED 2 $188,480 34 $158,864 56 $143,907 5 $64,104 0 $0 20 $135,270 APPLICATIONS DENIED 7 $140,960 115 $168,993 278 $157,131 48 $94,541 0 $0 74 $147,505 APPLICATIONS WITHDRAWN 7 $144,877 35 $296,268 112 $151,874 9 $121,837 3 $718,967 27 $295,094 FILES CLOSED FOR INCOMPLETENESS 1 $138,020 22 $233,820 22 $191,782 1 $32,160 0 $0 8 $221,230
Aggregated Statistics For Year 2006(Based on 3 full and 5 partial tracts) A) FHA, FSA/RHS & VA B) Conventional C) Refinancings D) Home Improvement Loans E) Loans on Dwellings For 5+ Families F) Non-occupant Loans on G) Loans On Manufactured Number Average Value Number Average Value Number Average Value Number Average Value Number Average Value Number Average Value Number Average Value
LOANS ORIGINATED 24 $145,525 378 $126,080 258 $133,669 30 $81,313 3 $2,661,247 175 $122,960 1 $67,900 APPLICATIONS APPROVED, NOT ACCEPTED 2 $114,195 66 $110,648 61 $126,235 10 $46,528 0 $0 47 $109,983 1 $67,900 APPLICATIONS DENIED 5 $190,286 176 $130,625 267 $140,769 62 $51,035 1 $3,028,020 109 $140,704 3 $28,660 APPLICATIONS WITHDRAWN 7 $148,404 77 $134,271 158 $142,847 14 $96,327 0 $0 44 $139,275 1 $32,900 FILES CLOSED FOR INCOMPLETENESS 1 $90,000 28 $197,200 43 $148,370 2 $143,005 0 $0 15 $176,361 0 $0
Aggregated Statistics For Year 2005(Based on 3 full and 5 partial tracts) A) FHA, FSA/RHS & VA B) Conventional C) Refinancings D) Home Improvement Loans E) Loans on Dwellings For 5+ Families F) Non-occupant Loans on G) Loans On Manufactured Number Average Value Number Average Value Number Average Value Number Average Value Number Average Value Number Average Value Number Average Value
LOANS ORIGINATED 32 $154,725 359 $104,657 258 $127,476 30 $76,049 4 $1,423,152 164 $105,015 0 $0 APPLICATIONS APPROVED, NOT ACCEPTED 2 $136,935 57 $95,356 58 $113,227 4 $38,055 0 $0 20 $96,914 1 $99,150 APPLICATIONS DENIED 7 $127,689 146 $111,885 312 $140,153 45 $53,694 0 $0 80 $122,211 4 $76,748 APPLICATIONS WITHDRAWN 6 $151,760 102 $122,378 140 $133,090 16 $125,398 0 $0 40 $128,239 0 $0 FILES CLOSED FOR INCOMPLETENESS 1 $206,980 23 $107,789 70 $138,022 1 $76,130 0 $0 10 $114,353 0 $0
Aggregated Statistics For Year 2004(Based on 3 full and 5 partial tracts) A) FHA, FSA/RHS & VA B) Conventional C) Refinancings D) Home Improvement Loans E) Loans on Dwellings For 5+ Families F) Non-occupant Loans on G) Loans On Manufactured Number Average Value Number Average Value Number Average Value Number Average Value Number Average Value Number Average Value Number Average Value
LOANS ORIGINATED 75 $146,878 314 $121,714 305 $119,856 25 $87,782 3 $548,350 153 $108,099 1 $24,230 APPLICATIONS APPROVED, NOT ACCEPTED 2 $99,605 38 $122,906 69 $126,130 5 $45,454 0 $0 21 $109,823 0 $0 APPLICATIONS DENIED 7 $140,789 108 $119,740 268 $116,971 39 $40,346 0 $0 56 $106,921 1 $72,710 APPLICATIONS WITHDRAWN 14 $155,264 64 $114,812 96 $117,599 6 $41,818 0 $0 25 $113,758 0 $0 FILES CLOSED FOR INCOMPLETENESS 0 $0 19 $118,366 53 $123,613 4 $47,455 1 $4,234,270 8 $99,532 0 $0
Aggregated Statistics For Year 2003(Based on 3 full and 5 partial tracts) A) FHA, FSA/RHS & VA B) Conventional C) Refinancings D) Home Improvement Loans E) Loans on Dwellings For 5+ Families F) Non-occupant Loans on Number Average Value Number Average Value Number Average Value Number Average Value Number Average Value Number Average Value
LOANS ORIGINATED 58 $136,694 209 $129,244 455 $116,902 17 $32,284 4 $515,578 131 $122,300 APPLICATIONS APPROVED, NOT ACCEPTED 2 $147,500 26 $133,880 70 $114,679 3 $56,517 0 $0 21 $119,047 APPLICATIONS DENIED 10 $132,783 56 $119,016 240 $112,342 25 $24,996 2 $309,595 53 $120,629 APPLICATIONS WITHDRAWN 11 $133,365 35 $136,623 85 $116,019 1 $58,990 0 $0 30 $127,401 FILES CLOSED FOR INCOMPLETENESS 0 $0 18 $144,848 28 $122,682 0 $0 0 $0 8 $134,732
Aggregated Statistics For Year 2002(Based on 2 full and 2 partial tracts) A) FHA, FSA/RHS & VA B) Conventional C) Refinancings D) Home Improvement Loans E) Loans on Dwellings For 5+ Families F) Non-occupant Loans on Number Average Value Number Average Value Number Average Value Number Average Value Number Average Value Number Average Value
LOANS ORIGINATED 26 $121,318 108 $125,830 169 $122,456 11 $45,133 1 $519,220 85 $109,657 APPLICATIONS APPROVED, NOT ACCEPTED 1 $79,750 13 $111,311 24 $124,228 4 $11,858 0 $0 15 $112,973 APPLICATIONS DENIED 6 $127,750 15 $117,683 58 $108,604 4 $23,928 0 $0 12 $88,190 APPLICATIONS WITHDRAWN 5 $101,010 13 $164,228 31 $102,968 0 $0 1 $299,070 13 $113,687 FILES CLOSED FOR INCOMPLETENESS 0 $0 8 $99,121 16 $115,916 0 $0 0 $0 6 $124,327
Aggregated Statistics For Year 2001(Based on 2 full and 2 partial tracts) A) FHA, FSA/RHS & VA B) Conventional C) Refinancings D) Home Improvement Loans E) Loans on Dwellings For 5+ Families F) Non-occupant Loans on Number Average Value Number Average Value Number Average Value Number Average Value Number Average Value Number Average Value
LOANS ORIGINATED 11 $120,288 81 $111,474 185 $112,679 10 $19,733 0 $0 74 $99,303 APPLICATIONS APPROVED, NOT ACCEPTED 1 $79,750 5 $78,670 28 $114,710 2 $76,665 1 $115,830 8 $114,489 APPLICATIONS DENIED 2 $94,190 26 $95,911 71 $89,738 16 $24,417 1 $157,760 20 $95,010 APPLICATIONS WITHDRAWN 1 $54,420 14 $133,566 38 $92,961 5 $21,944 0 $0 7 $105,194 FILES CLOSED FOR INCOMPLETENESS 0 $0 2 $128,465 7 $95,531 0 $0 0 $0 2 $125,670
Aggregated Statistics For Year 2000(Based on 2 full and 2 partial tracts) A) FHA, FSA/RHS & VA B) Conventional C) Refinancings D) Home Improvement Loans E) Loans on Dwellings For 5+ Families F) Non-occupant Loans on Number Average Value Number Average Value Number Average Value Number Average Value Number Average Value Number Average Value
LOANS ORIGINATED 14 $111,647 80 $105,306 59 $97,989 11 $26,930 5 $257,316 41 $97,905 APPLICATIONS APPROVED, NOT ACCEPTED 2 $82,190 13 $111,428 17 $78,726 9 $21,171 0 $0 5 $103,102 APPLICATIONS DENIED 1 $70,000 42 $83,231 47 $70,998 16 $31,248 0 $0 11 $110,625 APPLICATIONS WITHDRAWN 1 $92,340 13 $108,161 22 $79,008 4 $33,418 0 $0 3 $87,423 FILES CLOSED FOR INCOMPLETENESS 0 $0 7 $119,621 17 $97,098 0 $0 0 $0 3 $167,710
Aggregated Statistics For Year 1999(Based on 2 full and 4 partial tracts) A) FHA, FSA/RHS & VA B) Conventional C) Refinancings D) Home Improvement Loans E) Loans on Dwellings For 5+ Families F) Non-occupant Loans on Number Average Value Number Average Value Number Average Value Number Average Value Number Average Value Number Average Value
LOANS ORIGINATED 45 $97,473 122 $95,738 156 $77,392 24 $37,540 4 $3,289,700 56 $69,904 APPLICATIONS APPROVED, NOT ACCEPTED 2 $99,900 34 $67,603 44 $81,533 12 $27,338 1 $6,720 11 $74,450 APPLICATIONS DENIED 5 $89,216 76 $61,364 143 $78,390 38 $19,172 0 $0 42 $83,703 APPLICATIONS WITHDRAWN 3 $97,210 37 $107,259 101 $76,664 6 $28,613 0 $0 10 $107,234 FILES CLOSED FOR INCOMPLETENESS 0 $0 4 $63,012 30 $77,132 0 $0 0 $0 3 $59,883
Detailed HMDA statistics for the following Tracts:
0105.07
, 0106.01 , 0106.03 , 0106.04 , 0107.00 , 0108.00 , 0401.00 , 0402.01
Private Mortgage Insurance Companies Aggregated Statistics For Year 2009(Based on 3 full and 3 partial tracts) A) Conventional B) Refinancings C) Non-occupant Loans on Number Average Value Number Average Value Number Average Value
LOANS ORIGINATED 4 $319,460 3 $142,080 0 $0 APPLICATIONS APPROVED, NOT ACCEPTED 3 $269,813 1 $45,640 1 $78,140 APPLICATIONS DENIED 0 $0 0 $0 0 $0 APPLICATIONS WITHDRAWN 0 $0 1 $207,690 0 $0 FILES CLOSED FOR INCOMPLETENESS 0 $0 0 $0 0 $0
Aggregated Statistics For Year 2008(Based on 3 full and 4 partial tracts) A) Conventional B) Refinancings C) Non-occupant Loans on Number Average Value Number Average Value Number Average Value
LOANS ORIGINATED 43 $185,359 15 $203,387 9 $121,452 APPLICATIONS APPROVED, NOT ACCEPTED 15 $162,487 10 $170,951 4 $132,602 APPLICATIONS DENIED 9 $227,359 5 $207,504 5 $182,226 APPLICATIONS WITHDRAWN 2 $169,500 1 $191,570 0 $0 FILES CLOSED FOR INCOMPLETENESS 2 $235,065 1 $229,290 0 $0
Aggregated Statistics For Year 2007(Based on 3 full and 5 partial tracts) A) Conventional B) Refinancings C) Non-occupant Loans on Number Average Value Number Average Value Number Average Value
LOANS ORIGINATED 62 $194,674 23 $152,447 13 $134,838 APPLICATIONS APPROVED, NOT ACCEPTED 9 $185,250 8 $196,394 3 $165,150 APPLICATIONS DENIED 3 $294,280 2 $124,860 2 $105,555 APPLICATIONS WITHDRAWN 4 $313,195 2 $264,500 1 $70,360 FILES CLOSED FOR INCOMPLETENESS 0 $0 0 $0 0 $0
Aggregated Statistics For Year 2006(Based on 3 full and 4 partial tracts) A) Conventional B) Refinancings C) Non-occupant Loans on Number Average Value Number Average Value Number Average Value
LOANS ORIGINATED 19 $149,948 18 $168,273 5 $145,922 APPLICATIONS APPROVED, NOT ACCEPTED 5 $151,874 11 $165,940 3 $116,007 APPLICATIONS DENIED 0 $0 0 $0 0 $0 APPLICATIONS WITHDRAWN 1 $209,400 1 $195,470 2 $192,425 FILES CLOSED FOR INCOMPLETENESS 0 $0 1 $250,230 0 $0
Aggregated Statistics For Year 2005(Based on 3 full and 4 partial tracts) A) Conventional B) Refinancings C) Non-occupant Loans on Number Average Value Number Average Value Number Average Value
LOANS ORIGINATED 19 $133,389 26 $155,836 8 $114,119 APPLICATIONS APPROVED, NOT ACCEPTED 7 $185,409 8 $196,502 6 $193,522 APPLICATIONS DENIED 0 $0 0 $0 0 $0 APPLICATIONS WITHDRAWN 3 $158,040 2 $207,100 1 $286,570 FILES CLOSED FOR INCOMPLETENESS 0 $0 0 $0 0 $0
Aggregated Statistics For Year 2004(Based on 3 full and 4 partial tracts) A) Conventional B) Refinancings C) Non-occupant Loans on Number Average Value Number Average Value Number Average Value
LOANS ORIGINATED 44 $132,657 31 $139,648 24 $134,408 APPLICATIONS APPROVED, NOT ACCEPTED 14 $143,584 10 $140,985 8 $149,820 APPLICATIONS DENIED 0 $0 1 $120,620 0 $0 APPLICATIONS WITHDRAWN 5 $95,778 6 $122,602 3 $101,540 FILES CLOSED FOR INCOMPLETENESS 0 $0 0 $0 0 $0
Aggregated Statistics For Year 2003(Based on 3 full and 5 partial tracts) A) Conventional B) Refinancings C) Non-occupant Loans on Number Average Value Number Average Value Number Average Value
LOANS ORIGINATED 68 $143,857 44 $134,133 29 $113,331 APPLICATIONS APPROVED, NOT ACCEPTED 15 $176,355 10 $131,351 5 $111,890 APPLICATIONS DENIED 4 $118,732 2 $118,430 2 $138,315 APPLICATIONS WITHDRAWN 4 $188,938 6 $155,163 2 $159,565 FILES CLOSED FOR INCOMPLETENESS 0 $0 1 $167,630 0 $0
Aggregated Statistics For Year 2002(Based on 2 full and 2 partial tracts) A) Conventional B) Refinancings C) Non-occupant Loans on Number Average Value Number Average Value Number Average Value
LOANS ORIGINATED 35 $143,963 17 $156,771 22 $132,302 APPLICATIONS APPROVED, NOT ACCEPTED 3 $87,650 4 $155,348 2 $176,755 APPLICATIONS DENIED 3 $110,730 0 $0 1 $76,880 APPLICATIONS WITHDRAWN 1 $194,400 1 $84,860 0 $0 FILES CLOSED FOR INCOMPLETENESS 1 $197,250 0 $0 1 $197,250
Aggregated Statistics For Year 2001(Based on 2 full and 2 partial tracts) A) Conventional B) Refinancings C) Non-occupant Loans on Number Average Value Number Average Value Number Average Value
LOANS ORIGINATED 31 $120,483 10 $129,580 12 $105,132 APPLICATIONS APPROVED, NOT ACCEPTED 3 $95,937 2 $134,020 3 $70,497 APPLICATIONS DENIED 1 $137,400 2 $153,220 1 $101,930 APPLICATIONS WITHDRAWN 0 $0 0 $0 0 $0 FILES CLOSED FOR INCOMPLETENESS 1 $139,570 0 $0 0 $0
Aggregated Statistics For Year 2000(Based on 2 full and 2 partial tracts) A) Conventional B) Refinancings C) Non-occupant Loans on Number Average Value Number Average Value Number Average Value
LOANS ORIGINATED 48 $99,004 7 $88,716 26 $89,237 APPLICATIONS APPROVED, NOT ACCEPTED 2 $129,995 0 $0 2 $122,610 APPLICATIONS DENIED 1 $186,170 0 $0 1 $158,190 APPLICATIONS WITHDRAWN 4 $94,908 0 $0 4 $91,048 FILES CLOSED FOR INCOMPLETENESS 0 $0 0 $0 0 $0
Aggregated Statistics For Year 1999(Based on 2 full and 4 partial tracts) A) Conventional B) Refinancings C) Non-occupant Loans on Number Average Value Number Average Value Number Average Value
LOANS ORIGINATED 40 $92,902 10 $92,464 16 $76,574 APPLICATIONS APPROVED, NOT ACCEPTED 2 $110,285 3 $103,300 0 $0 APPLICATIONS DENIED 6 $77,660 0 $0 5 $78,748 APPLICATIONS WITHDRAWN 1 $44,430 1 $141,490 0 $0 FILES CLOSED FOR INCOMPLETENESS 0 $0 0 $0 0 $0
Detailed PMIC statistics for the following Tracts:
0105.07
, 0106.01 , 0106.03 , 0106.04 , 0107.00 , 0108.00 , 0401.00 , 0402.01 Fire-safe hotels and motels in College Park, Georgia:
Super 8 Atlanta Airport - College Park, 2010 Sullivan Rd, College Park, Georgia 30337 Phone: (770) 991-8985, Fax: (770) 907-7427
Days Inn & Suites, 2451 Old National Pkwy, College Park, Georgia 30349 Phone: (404) 761-8371, Fax: (404) 559-3483
La Quinta Inn & Suites-Atlanta Airport, 4820 Massachusetts Blvd, College Park, Georgia 30337 Phone: (770) 996-0000, Fax: (770) 996-9260
Atlanta Airport West - Days Inn, 4979 Old National Hwy, College Park, Georgia 30349 Phone: (404) 669-8616, Fax: (404) 669-8616
Sheraton Atlanta Airport, 1900 Sullivan Rd, College Park, Georgia 30337 Phone: (770) 997-1100, Fax: (770) 997-1921
Quality Hotel And Conference Center, 1551 Phoenix Blvd, College Park, Georgia 30349 Phone: (770) 996-4321, Fax: (770) 991-5795
Sleep Inn Atlanta Airport, 1911 Sullivan Rd, College Park, Georgia 30337 Phone: (770) 996-6100, Fax: (770) 996-4060
Days Inn Atlanta Airport, 4505 Best Rd, College Park, Georgia 30337 Phone: (404) 767-1224, Fax: (404) 767-0714
Country Inn & Suites Atlanta Airport South, 5100 W Fayetteville Rd, College Park, Georgia 30349 Phone: (770) 991-1099, Fax: (770) 991-1076
All 9 fire-safe hotels and motels in College Park, Georgia College Park compared to Georgia state average:
Unemployed percentage below state average. Black race population percentage above state average. Hispanic race population percentage significantly below state average. Median age significantly below state average. Foreign-born population percentage significantly below state average. Renting percentage above state average. Length of stay since moving in significantly above state average. Number of rooms per house below state average. House age above state average. College Park on our top lists :
#2 on the list of "Top 101 cities with the highest number of auto thefts per 100,000 residents, excludes tourist destinations and others with a lot of outsiders visiting based on city industries data (population 5,000+)"
#2 on the list of "Top 101 cities with the most local government spending on current operations of parks and recreation per resident (population 10,000+)"
#2 on the list of "Top 101 cities with the most residents born in Africa, n.e.c. (population 500+)"
#3 on the list of "Top 101 cities with the highest number of robberies per 100,000 residents, excludes tourist destinations and others with a lot of outsiders visiting based on city industries data (population 5,000+)"
#6 on the list of "Top 101 cities with the highest number of police officers per 1000 residents (population 5,000+)"
#8 on the list of "Top 101 cities with the most full-time firefighters per 1000 residents (population 5,000+)"
#12 on the list of "Top 101 cities with the largest percentage population decrease from 2000 (population 5,000+)"
#13 on the list of "Top 101 cities with the highest number of rapes per 100,000 residents, excludes tourist destinations and others with a lot of outsiders visiting based on city industries data (population 5,000+)"
#15 on the list of "Top 101 cities with largest percentage of females in occupations: transportation occupations (population 5,000+)"
#22 on the list of "Top 101 cities with largest percentage of males in industries: accommodation and food services (population 5,000+)"
#29 on the list of "Top 100 cities with declining populations from 2000 to 2014 (pop. 5,000+)"
#32 on the list of "Top 101 cities with the highest city-data.com crime index, excludes tourist destinations and others with a lot of outsiders visiting based on city industries data (population 5,000+)"
#34 on the list of "Top 101 cities with the highest percentage of single-parent households, population 5,000+"
#34 on the list of "Top 100 least-safe cities (highest city-data.com crime index)"
#37 on the list of "Top 101 cities with the highest number of burglaries per 100,000 residents, excludes tourist destinations and others with a lot of outsiders visiting based on city industries data (population 5,000+)"
#49 on the list of "Top 101 cities with the highest number of murders per 100,000 residents, excludes tourist destinations and others with a lot of outsiders visiting based on city industries data (population 5,000+)"
#53 on the list of "Top 101 cities with the highest number of thefts per 100,000 residents, excludes tourist destinations and others with a lot of outsiders visiting based on city industries data (population 5,000+)"
#66 on the list of "Top 101 cities with the most residents born in Other Western Africa (population 500+)"
#67 on the list of "Top 101 cities with the most full-time park and recreation workers per 1000 residents (population 5,000+)"
#68 on the list of "Top 101 cities with largest percentage of females in industries: transportation and warehousing (population 5,000+)"
#1 (30349) on the list of "Top 101 zip codes with the lowest 2012 average reported profit/loss from business (pop 5,000+)"
#64 (30349) on the list of "Top 101 zip codes with the largest percentage of Subsaharan African first ancestries"
#5 on the list of "Top 101 counties with the most Mainline Protestant adherents"
#6 on the list of "Top 101 counties with the most Black Protestant adherents"
#9 on the list of "Top 101 counties with the most Black Protestant congregations"
#11 on the list of "Top 101 counties with the highest percentage of residents relocating from other counties between 2010 and 2011 (pop. 50,000+)"
#13 on the list of "Top 101 counties with the highest percentage of residents relocating to other counties in 2011 (pop. 50,000+)"
Top Patent Applicants
Jacquelyn S. Sampson (9)
John Gabriel Aldridge (3)
Leronzo Lidell Tatum (2)
Monica Senior (2)
Meredith W. Hodges (2)
Precia Carraway (2)
Selso Tello (1)
Jacqueline S. Geter (1)
Donald Long (1)
Yejide Talibah Shabazz (1)
Total of 34 patent applications in 2008-2024.
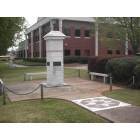

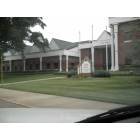
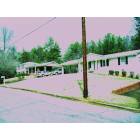
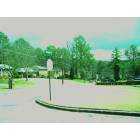
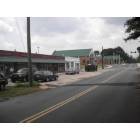
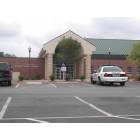
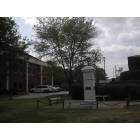
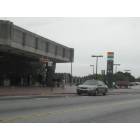
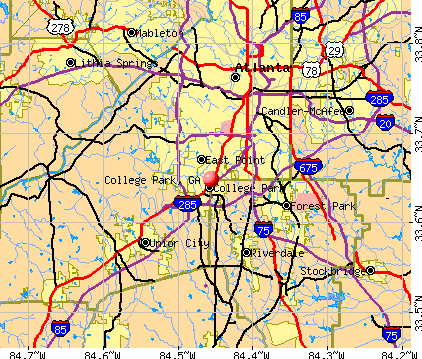


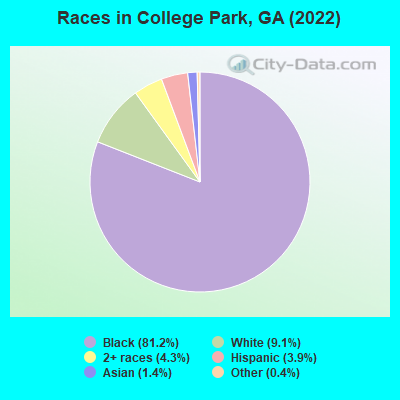
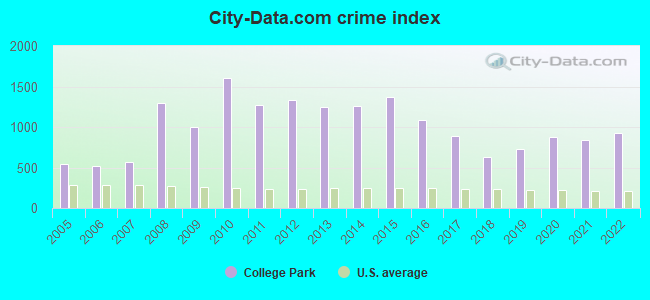
 Recent articles from our blog. Our writers, many of them Ph.D. graduates or candidates, create easy-to-read articles on a wide variety of topics.

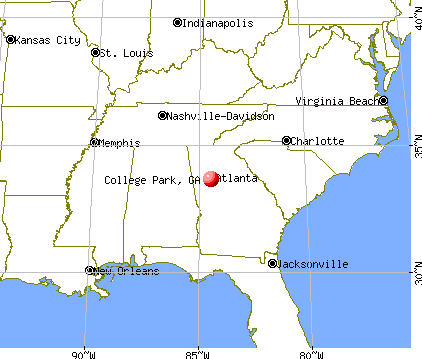
 (8.3 miles
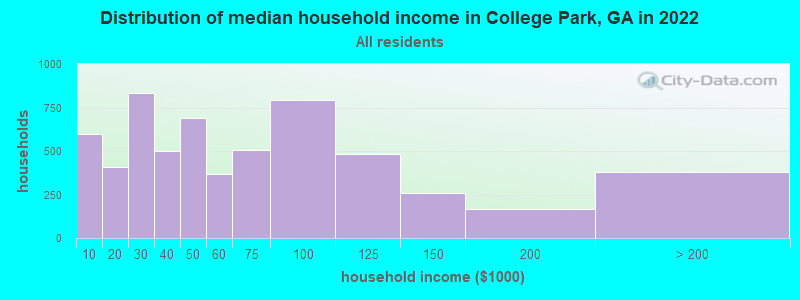
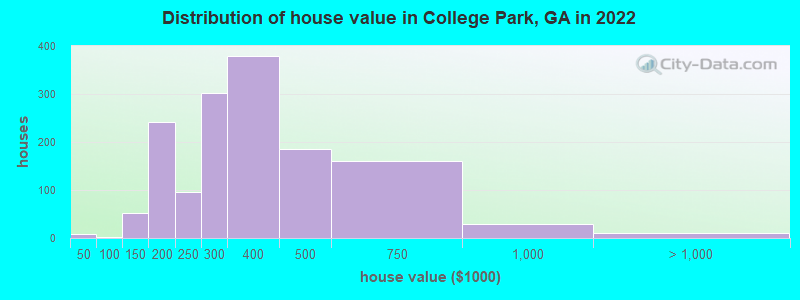

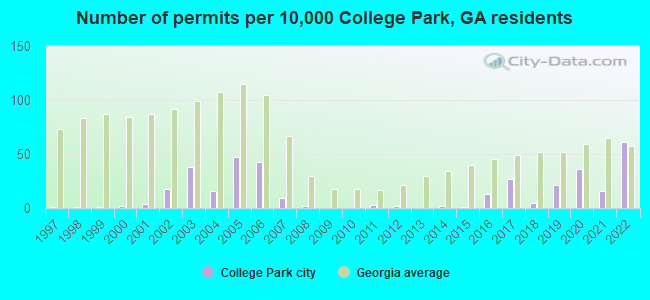
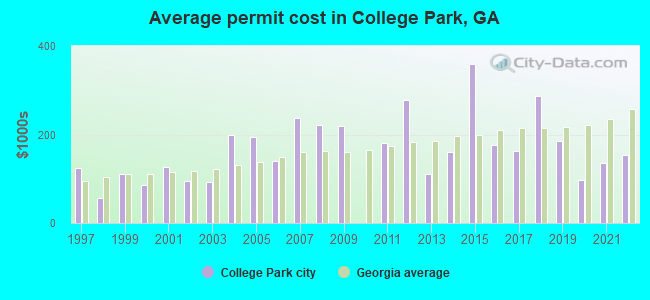
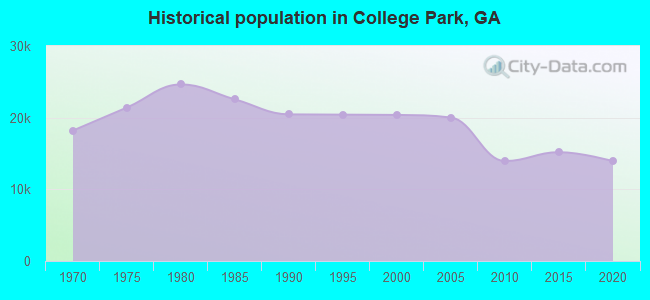
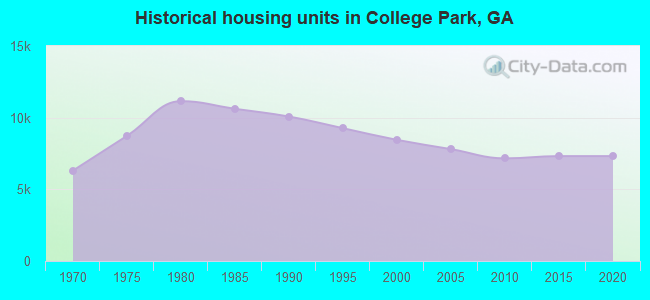
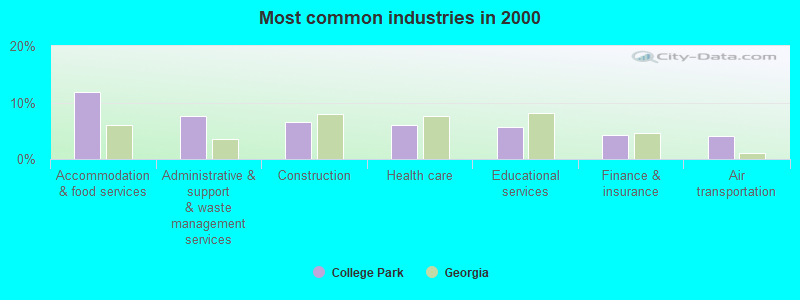

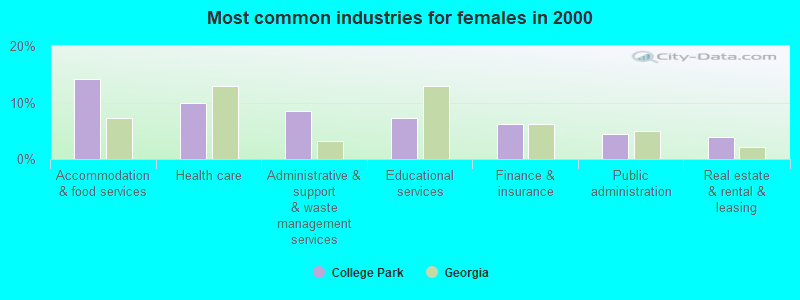
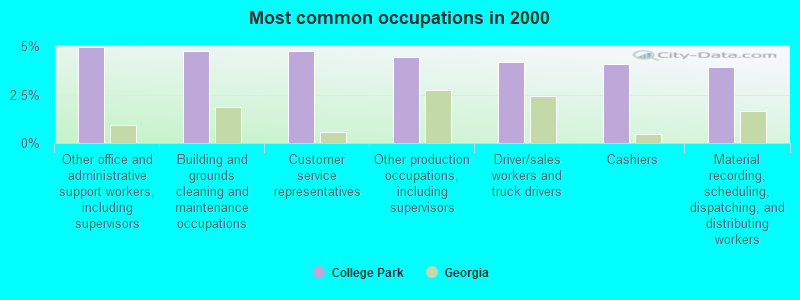
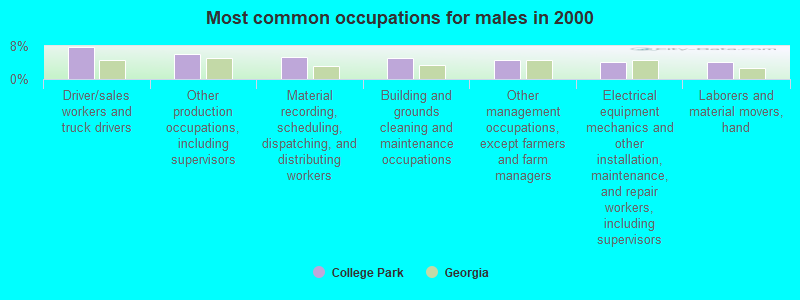
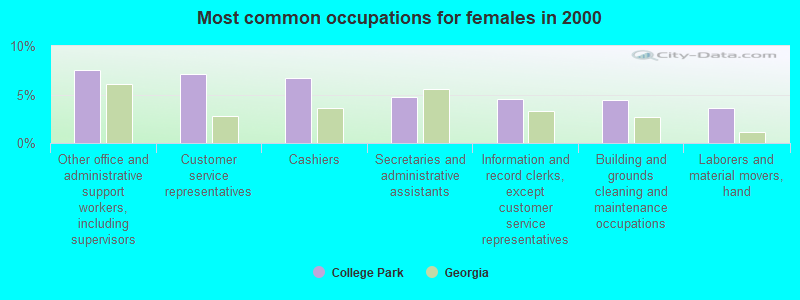
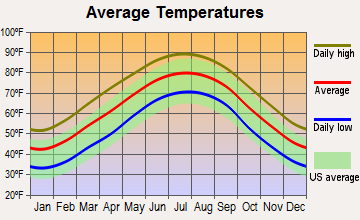
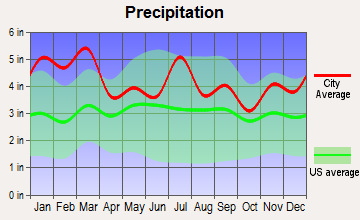
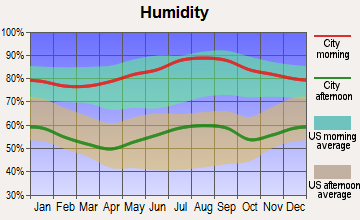
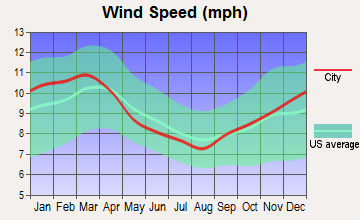
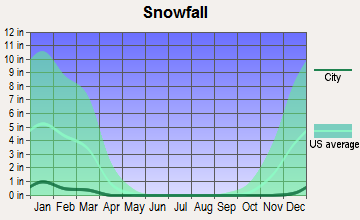
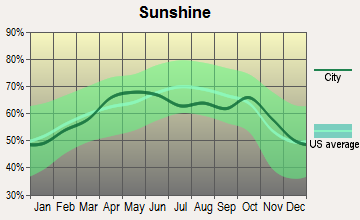
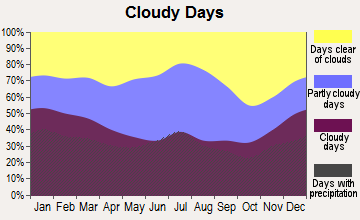
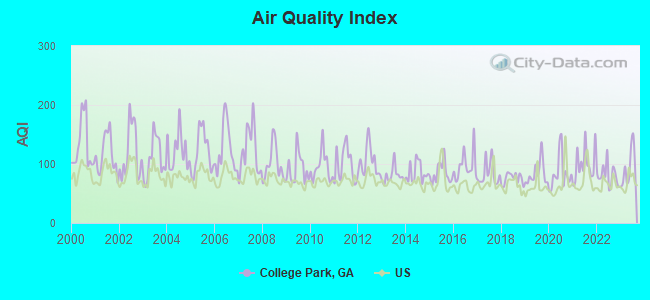
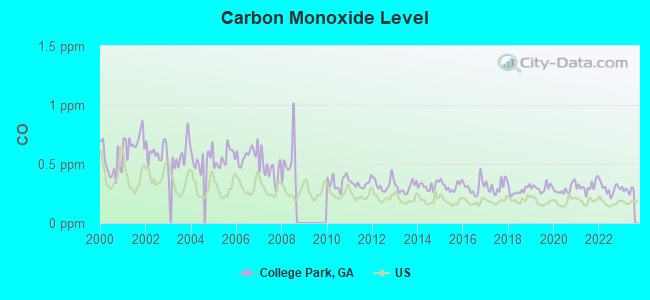
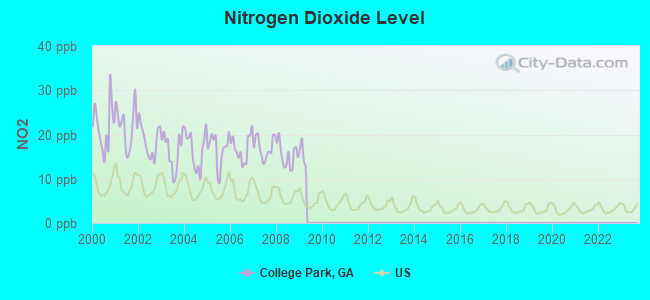
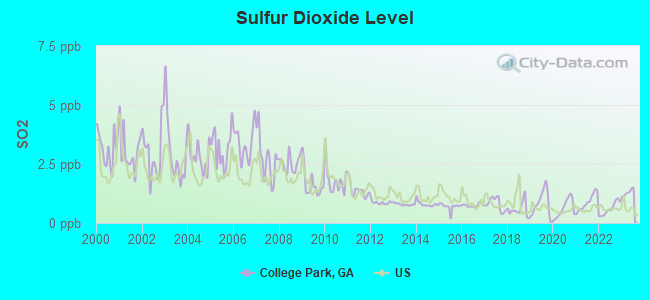
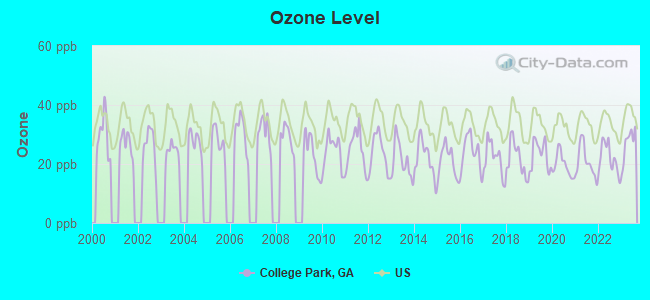
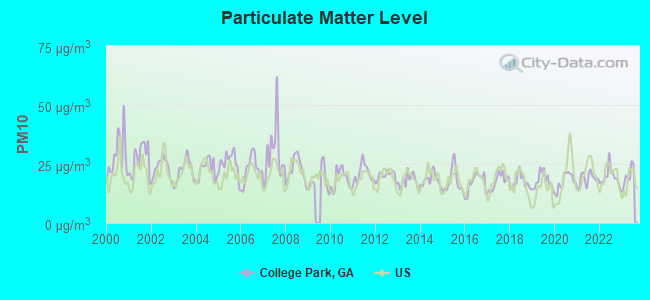
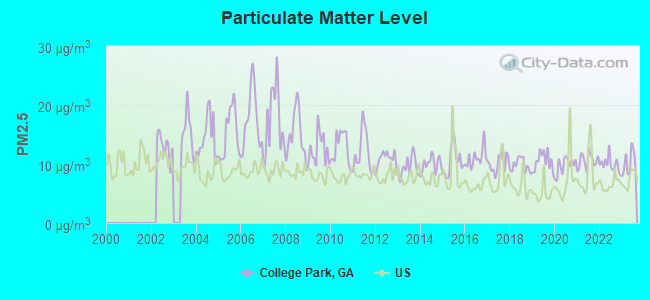
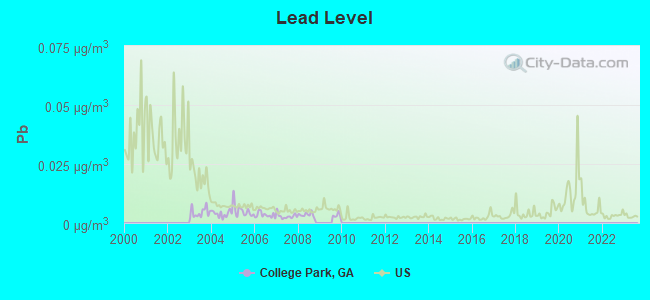
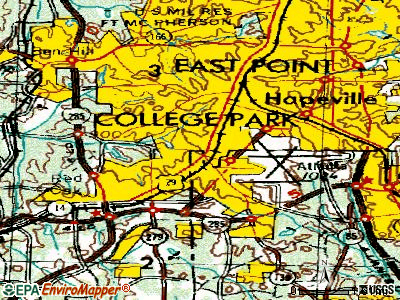
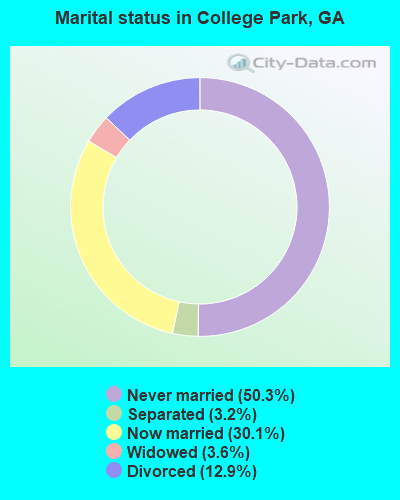
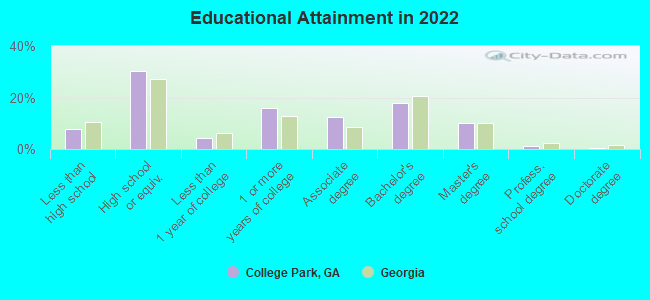
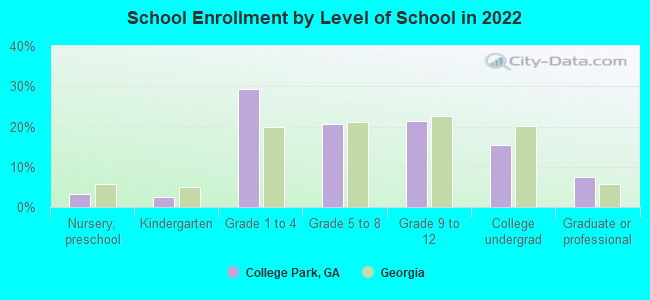
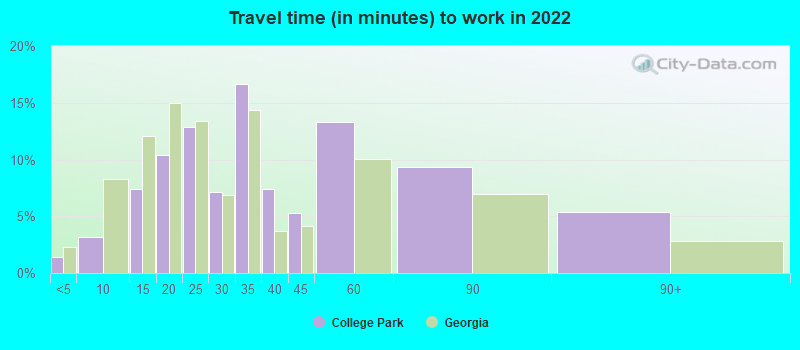
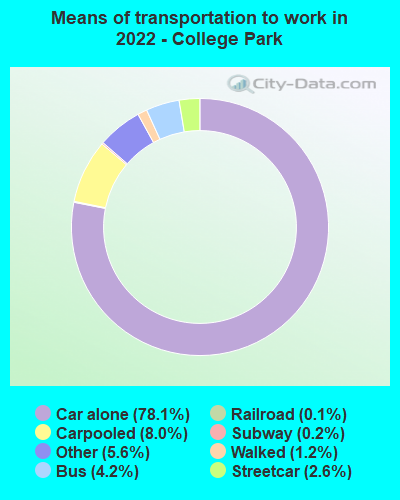
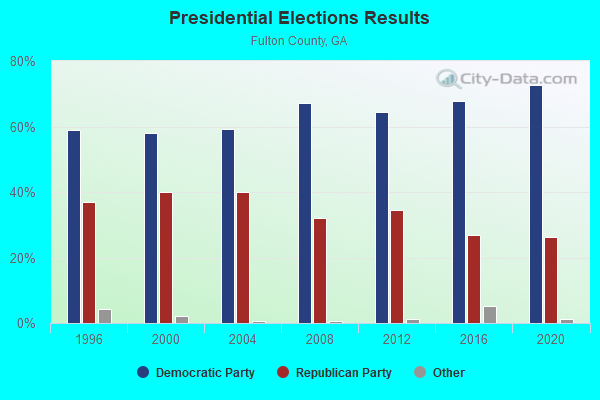
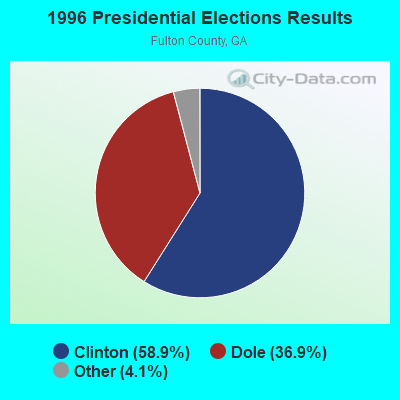
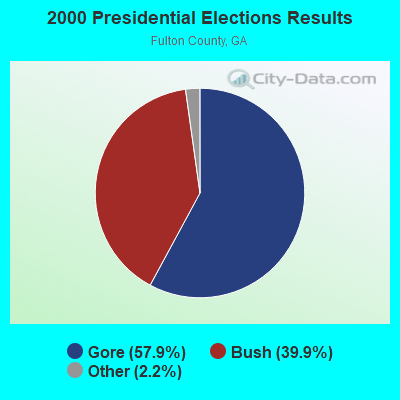
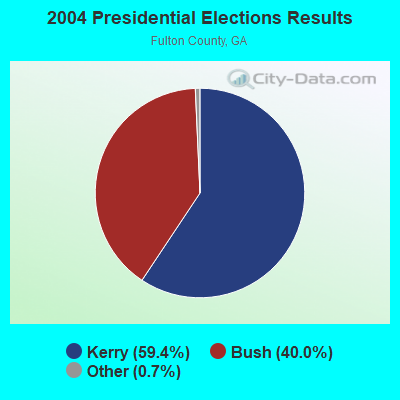
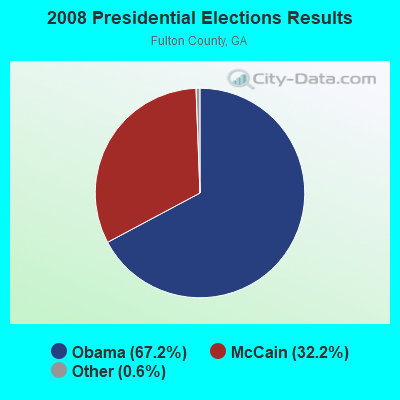
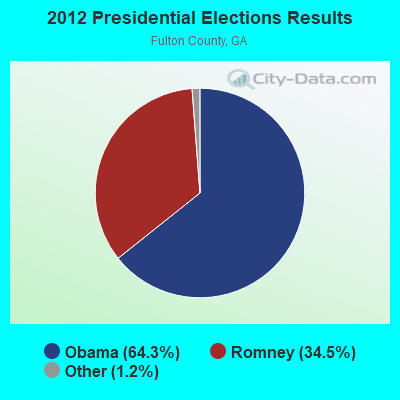
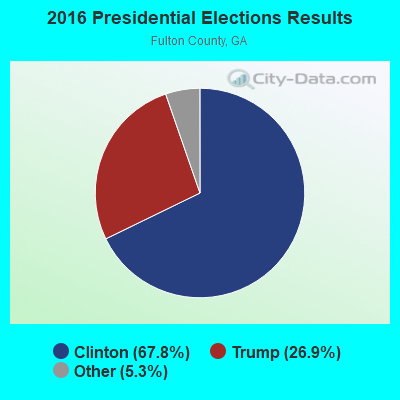
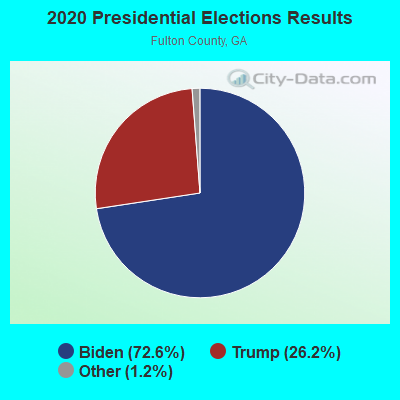
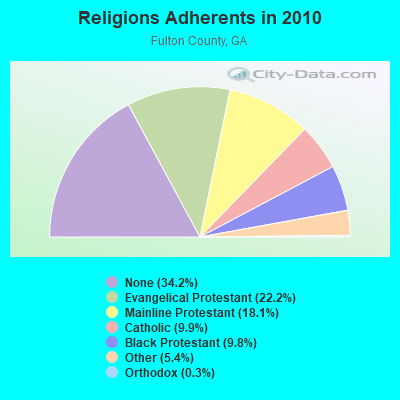
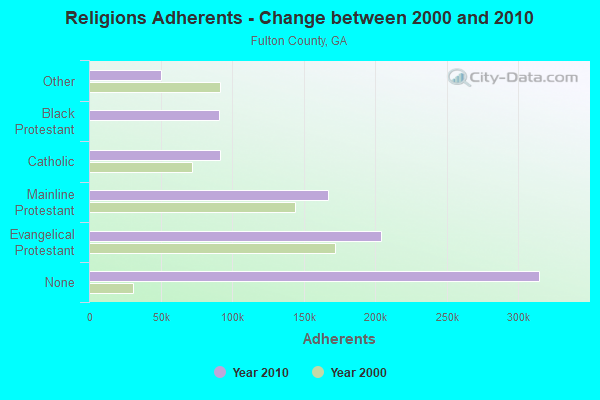
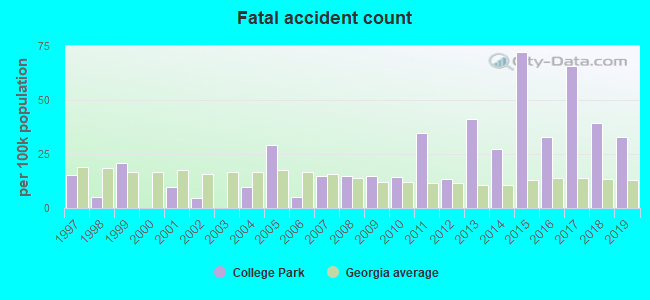
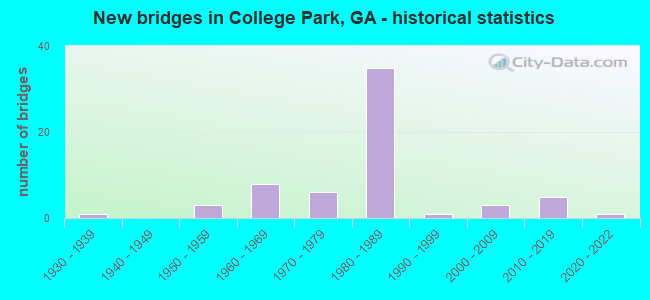
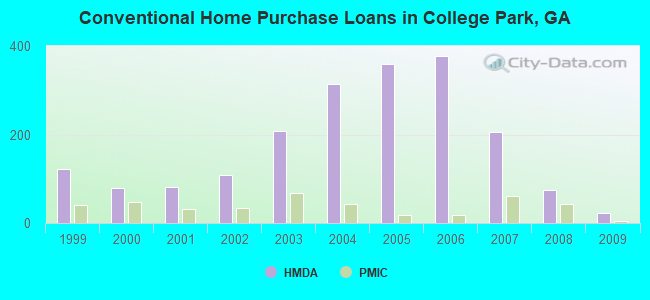

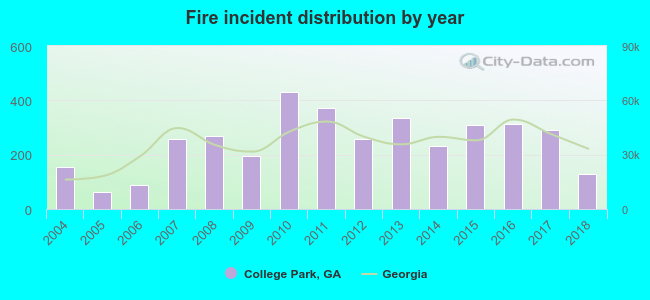 Based on the data from the years 2004 - 2018 the average number of fires per year is 247. The highest number of reported fire incidents - 431 took place in 2010, and the least - 62 in 2005. The data has a decreasing trend.
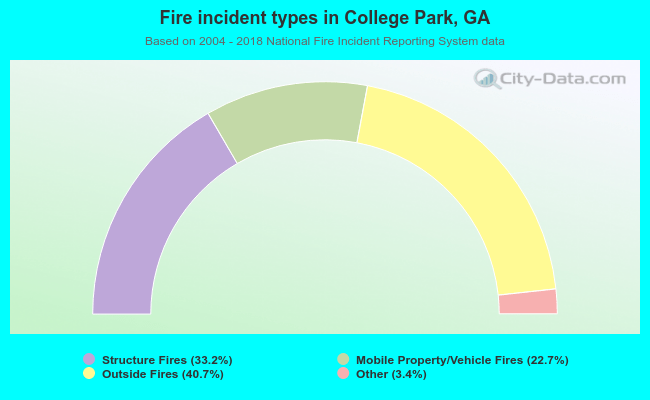 When looking into fire subcategories, the most incidents belonged to: Outside Fires (40.7%), and Structure Fires (33.2%).