Estimated zip code population in 2022: 29,819 Zip code population in 2010: 24,267 Zip code population in 2000: 20,317
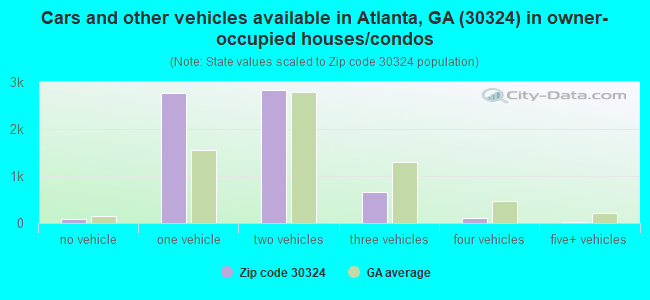
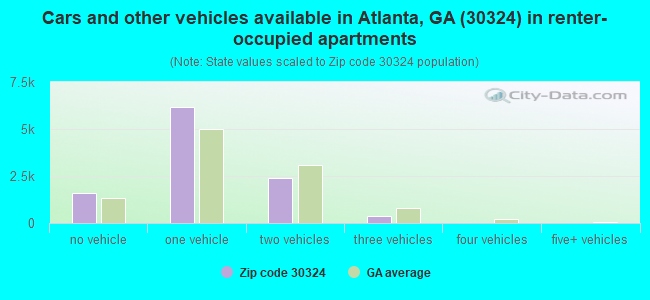
Houses and condos: 18,470 Renter-occupied apartments: 10,558
% of renters here:
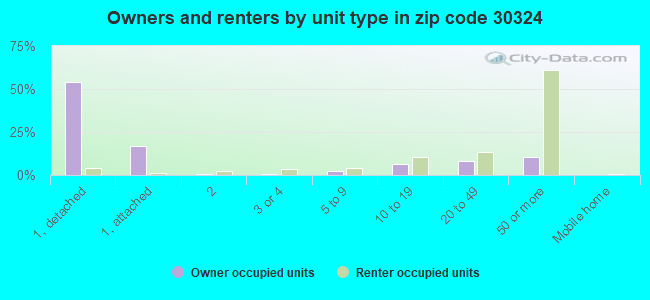
62%
State:
34%
March 2022 cost of living index in zip code 30324: 105.4 (more than average, U.S. average is 100)
Land area: 5.3 sq. mi. Water area: 0.0 sq. mi.
Population density: 5,667 people per square mile
(average).
OSM Map
General Map
Google Map
MSN Map
OSM Map
General Map
Google Map
MSN Map
OSM Map
General Map
Google Map
MSN Map
OSM Map
General Map
Google Map
MSN Map
Please wait while loading the map...
Real estate property taxes paid for housing units in 2022:
This zip code:
0.9% ($5,490)
Georgia:
0.7% ($2,160)
Median real estate property taxes paid for housing units with mortgages in 2022: $5,533 (0.9%) Median real estate property taxes paid for housing units with no mortgage in 2022: $5,253 (0.9%)
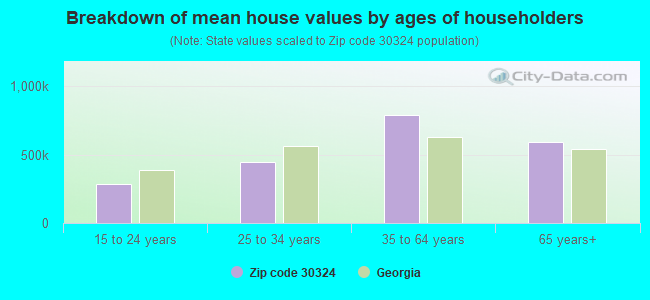
Estimated median house/condo value in 2022: $599,880
30324:
$599,880
Georgia:
$297,400
According to our research of Georgia and other state lists, there were 20 registered sex offenders living in 30324 zip code as of April 27, 2024. The ratio of all residents to sex offenders in zip code 30324 is 1,317 to 1. The ratio of registered sex offenders to all residents in this zip code is much lower than the state average.
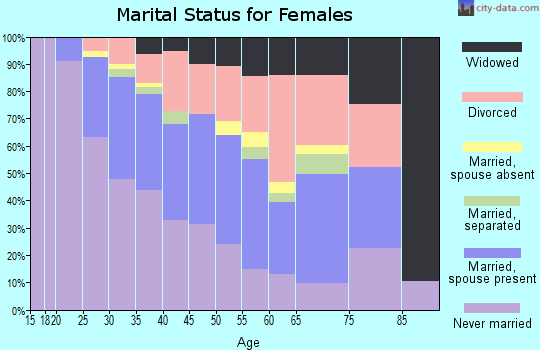
Median resident age:
This zip code:
35.1 years
Georgia median age:
37.6 years
Average household size:
This zip code:
1.7 people
Georgia:
2.6 people
Averages for the 2020 tax year for zip code 30324, filed in 2021:
Average Adjusted Gross Income (AGI) in 2020: $112,615 (Individual Income Tax Returns)
Here:
$112,615
State:
$70,847
Salary/wage: $93,658 (reported on 85.6% of returns)
Here:
$93,658
State:
$59,126
(% of AGI for various income ranges: 1253.7% for AGIs below $25k, 4117.1% for AGIs $25k-50k, 7667.3% for AGIs $50k-75k, 11186.7% for AGIs $75k-100k, 19701.4% for AGIs $100k-200k, 100740.4% for AGIs over 200k)
Taxable interest for individuals: $1,730 (reported on 30.6% of returns)
This zip code:
$1,730
Georgia:
$2,011
(% of AGI for various income ranges: 13.8% for AGIs below $25k, 14.4% for AGIs $25k-50k, 21.0% for AGIs $50k-75k, 47.0% for AGIs $75k-100k, 126.4% for AGIs $100k-200k, 853.3% for AGIs over 200k)
Ordinary dividends: $8,679 (reported on 28.9% of returns)
Here:
$8,679
State:
$8,996
(% of AGI for various income ranges: 34.2% for AGIs below $25k, 60.9% for AGIs $25k-50k, 102.3% for AGIs $50k-75k, 181.9% for AGIs $75k-100k, 500.9% for AGIs $100k-200k, 4508.9% for AGIs over 200k)
Net capital gain/loss in AGI: +$41,715 (reported on 27.9% of returns)
Here:
+$41,715
State:
+$28,402
(% of AGI for various income ranges: 23.3% for AGIs below $25k, 58.6% for AGIs $25k-50k, 155.5% for AGIs $50k-75k, 277.2% for AGIs $75k-100k, 856.7% for AGIs $100k-200k, 28130.4% for AGIs over 200k)
Profit/loss from business: +$10,540 (reported on 23.6% of returns)
Here:
+$10,540
State:
+$6,707
(% of AGI for various income ranges: 77.7% for AGIs below $25k, 94.3% for AGIs $25k-50k, 211.5% for AGIs $50k-75k, 258.0% for AGIs $75k-100k, 603.5% for AGIs $100k-200k, 3349.8% for AGIs over 200k)
Taxable individual retirement arrangement distribution: $22,913 (reported on 5.8% of returns)
30324:
$22,913
Georgia:
$20,525
(% of AGI for various income ranges: 31.4% for AGIs below $25k, 71.5% for AGIs $25k-50k, 111.8% for AGIs $50k-75k, 173.4% for AGIs $75k-100k, 547.1% for AGIs $100k-200k, 1179.8% for AGIs over 200k)
Self-employed (Keogh) retirement plans: $29,329 (reported on 1.1% of returns)
30324:
$29,329
Georgia:
$27,751
(% of AGI for various income ranges: 19.7% for AGIs $50k-75k, 52.9% for AGIs $100k-200k, 685.3% for AGIs over 200k)
Total itemized deductions: $34,662 (reported on 19.8% of returns)
Here:
$34,662
State:
$34,001
(% of AGI for various income ranges: 73.8% for AGIs below $25k, 158.4% for AGIs $25k-50k, 382.2% for AGIs $50k-75k, 773.9% for AGIs $75k-100k, 1822.0% for AGIs $100k-200k, 10568.8% for AGIs over 200k)
Charity contributions: $13,869 (reported on 16.2% of returns)
Here:
$13,869
State:
$14,164
(% of AGI for various income ranges: 7.1% for AGIs below $25k, 25.1% for AGIs $25k-50k, 66.5% for AGIs $50k-75k, 126.4% for AGIs $75k-100k, 333.3% for AGIs $100k-200k, 4723.7% for AGIs over 200k)
Taxes paid: $8,521 (reported on 19.8% of returns)
30324:
$8,521
State:
$7,540
(% of AGI for various income ranges: 17.3% for AGIs below $25k, 34.5% for AGIs $25k-50k, 95.1% for AGIs $50k-75k, 254.0% for AGIs $75k-100k, 651.9% for AGIs $100k-200k, 2019.1% for AGIs over 200k)
Earned income credit: $1,434 (reported on 9.1% of returns)
Here:
$1,434
State:
$2,530
(% of AGI for various income ranges: 55.8% for AGIs below $25k, 20.9% for AGIs $25k-50k)
Percentage of individuals using paid preparers for their 2020 taxes: 92.8%
Here:
93%
State:
93%
(% for various income ranges: 89.4% for AGIs below $25k, 92.9% for AGIs $25k-50k, 93.7% for AGIs $50k-75k, 93.4% for AGIs $75k-100k, 94.5% for AGIs $100k-200k, 95.6% for AGIs over 200k)
Averages for the 2012 tax year for zip code 30324, filed in 2013:
Average Adjusted Gross Income (AGI) in 2012: $74,095 (Individual Income Tax Returns)
Here:
$74,095
State:
$56,131
Salary/wage: $65,536 (reported on 88.9% of returns)
Here:
$65,536
State:
$47,942
(% of AGI for various income ranges: 86.3% for AGIs below $25k, 92.8% for AGIs $25k-50k, 89.1% for AGIs $50k-75k, 84.1% for AGIs $75k-100k, 82.2% for AGIs $100k-200k, 64.8% for AGIs over 200k)
Taxable interest for individuals: $1,594 (reported on 30.3% of returns)
This zip code:
$1,594
Georgia:
$1,706
(% of AGI for various income ranges: 1.1% for AGIs below $25k, 0.4% for AGIs $25k-50k, 0.3% for AGIs $50k-75k, 0.6% for AGIs $75k-100k, 0.7% for AGIs $100k-200k, 0.8% for AGIs over 200k)
Ordinary dividends: $7,389 (reported on 22.6% of returns)
Here:
$7,389
State:
$7,265
(% of AGI for various income ranges: 2.1% for AGIs below $25k, 0.9% for AGIs $25k-50k, 1.9% for AGIs $50k-75k, 2.2% for AGIs $75k-100k, 2.1% for AGIs $100k-200k, 3.0% for AGIs over 200k)
Net capital gain/loss in AGI: +$13,476 (reported on 18.9% of returns)
Here:
+$13,476
State:
+$16,323
(% of AGI for various income ranges: 0.3% for AGIs $25k-50k, 0.3% for AGIs $50k-75k, 0.8% for AGIs $75k-100k, 1.6% for AGIs $100k-200k, 8.0% for AGIs over 200k)
Profit/loss from business: +$12,853 (reported on 18.3% of returns)
Here:
+$12,853
State:
+$7,583
(% of AGI for various income ranges: 6.1% for AGIs below $25k, 1.7% for AGIs $25k-50k, 1.9% for AGIs $50k-75k, 2.9% for AGIs $75k-100k, 3.9% for AGIs $100k-200k, 3.4% for AGIs over 200k)
Taxable individual retirement arrangement distribution: $18,012 (reported on 5.7% of returns)
30324:
$18,012
Georgia:
$17,199
(% of AGI for various income ranges: 1.4% for AGIs below $25k, 1.0% for AGIs $25k-50k, 1.5% for AGIs $50k-75k, 1.9% for AGIs $75k-100k, 1.8% for AGIs $100k-200k, 1.1% for AGIs over 200k)
Self-employment retirement plans: $24,112 (reported on 1.1% of returns)
30324:
$24,112
Georgia:
$23,277
(% of AGI for various income ranges: 0.2% for AGIs $25k-50k, 0.3% for AGIs $100k-200k, 0.7% for AGIs over 200k)
Total itemized deductions: $26,109 (19% of AGI, reported on 37.8% of returns)
Here:
$26,109
State:
$23,886
Here:
18.8% of AGI
State:
21.5% of AGI
(% of AGI for various income ranges: 10.0% for AGIs below $25k, 9.4% for AGIs $25k-50k, 11.4% for AGIs $50k-75k, 13.5% for AGIs $75k-100k, 16.0% for AGIs $100k-200k, 14.3% for AGIs over 200k)
Charity contributions: $5,177 (reported on 30.9% of returns)
Here:
$5,177
State:
$5,507
(% of AGI for various income ranges: 0.8% for AGIs below $25k, 1.2% for AGIs $25k-50k, 1.5% for AGIs $50k-75k, 1.6% for AGIs $75k-100k, 1.8% for AGIs $100k-200k, 3.2% for AGIs over 200k)
Taxes paid: $10,608 (reported on 37.4% of returns)
30324:
$10,608
State:
$7,838
(% of AGI for various income ranges: 2.0% for AGIs below $25k, 2.7% for AGIs $25k-50k, 3.3% for AGIs $50k-75k, 4.8% for AGIs $75k-100k, 7.0% for AGIs $100k-200k, 6.8% for AGIs over 200k)
Earned income credit: $1,546 (reported on 9.3% of returns)
Here:
$1,546
State:
$2,589
(% of AGI for various income ranges: 3.1% for AGIs below $25k, 0.2% for AGIs $25k-50k)
Percentage of individuals using paid preparers for their 2012 taxes: 47.1%
Here:
47%
State:
55%
(% for various income ranges: 48.9% for AGIs below $25k, 41.8% for AGIs $25k-50k, 40.9% for AGIs $50k-75k, 44.8% for AGIs $75k-100k, 52.7% for AGIs $100k-200k, 70.0% for AGIs over 200k)
Averages for the 2004 tax year for zip code 30324, filed in 2005:
Average Adjusted Gross Income (AGI) in 2004: $66,118 (Individual Income Tax Returns)
Here:
$66,118
State:
$47,553
Salary/wage: $54,912 (reported on 87.3% of returns)
Here:
$54,912
State:
$42,178
(% of AGI for various income ranges: 163.9% for AGIs below $10k, 87.6% for AGIs $10k-25k, 90.5% for AGIs $25k-50k, 85.7% for AGIs $50k-75k, 83.0% for AGIs $75k-100k, 59.8% for AGIs over 100k)
Taxable interest for individuals: $1,859 (reported on 42.0% of returns)
This zip code:
$1,859
Georgia:
$1,772
(% of AGI for various income ranges: 8.7% for AGIs below $10k, 1.9% for AGIs $10k-25k, 1.1% for AGIs $25k-50k, 1.2% for AGIs $50k-75k, 1.3% for AGIs $75k-100k, 1.0% for AGIs over 100k)
Taxable dividends: $4,002 (reported on 30.6% of returns)
Here:
$4,002
State:
$4,283
(% of AGI for various income ranges: 12.2% for AGIs below $10k, 1.6% for AGIs $10k-25k, 1.2% for AGIs $25k-50k, 1.5% for AGIs $50k-75k, 2.4% for AGIs $75k-100k, 1.9% for AGIs over 100k)
Net capital gain/loss: +$11,867 (reported on 25.9% of returns)
Here:
+$11,867
State:
+$16,461
(% of AGI for various income ranges: 3.6% for AGIs below $10k, 0.7% for AGIs $10k-25k, 0.3% for AGIs $25k-50k, 1.1% for AGIs $50k-75k, 1.6% for AGIs $75k-100k, 7.7% for AGIs over 100k)
Profit/loss from business: +$13,694 (reported on 15.7% of returns)
Here:
+$13,694
State:
+$8,201
(% of AGI for various income ranges: -1.2% for AGIs below $10k, 4.1% for AGIs $10k-25k, 2.7% for AGIs $25k-50k, 3.1% for AGIs $50k-75k, 3.3% for AGIs $75k-100k, 3.4% for AGIs over 100k)
IRA payment deduction: $2,782 (reported on 2.3% of returns)
30324:
$2,782
Georgia:
$2,969
(% of AGI for various income ranges: 0.7% for AGIs below $10k, 0.2% for AGIs $10k-25k, 0.2% for AGIs $25k-50k, 0.1% for AGIs $50k-75k, 0.1% for AGIs $75k-100k, 0.1% for AGIs over 100k)
Self-employed pension: $18,629 (reported on 1.9% of returns)
Here:
$18,629
Georgia:
$16,203
(% of AGI for various income ranges: 1.1% for AGIs below $10k, 0.2% for AGIs $25k-50k, 0.2% for AGIs $50k-75k, 0.4% for AGIs $75k-100k, 0.8% for AGIs over 100k)
Total itemized deductions: $25,480 (22% of AGI, reported on 43.2% of returns)
Here:
$25,480
State:
$19,944
Here:
21.7% of AGI
State:
22.6% of AGI
(% of AGI for various income ranges: 39.4% for AGIs below $10k, 12.7% for AGIs $10k-25k, 11.9% for AGIs $25k-50k, 17.4% for AGIs $50k-75k, 19.9% for AGIs $75k-100k, 17.4% for AGIs over 100k)
Charity contributions deductions: $6,328 (5% of AGI, reported on 37.3% of returns)
Here:
$6,328
State:
$4,354
Here:
5.0% of AGI
State:
4.7% of AGI
(% of AGI for various income ranges: 2.0% for AGIs below $10k, 1.2% for AGIs $10k-25k, 1.5% for AGIs $25k-50k, 2.0% for AGIs $50k-75k, 2.4% for AGIs $75k-100k, 5.0% for AGIs over 100k)
Total tax: $13,253 (reported on 82.6% of returns)
30324:
$13,253
State:
$8,223
(% of AGI for various income ranges: 6.7% for AGIs below $10k, 4.8% for AGIs $10k-25k, 9.5% for AGIs $25k-50k, 13.2% for AGIs $50k-75k, 13.8% for AGIs $75k-100k, 21.2% for AGIs over 100k)
Earned income credit: $1,123 (reported on 7.7% of returns)
Here:
$1,123
State:
$1,986
Percentage of individuals using paid preparers for their 2004 taxes: 49.4%
Here:
49%
State:
62%
(% for various income ranges: 46.3% for AGIs below $10k, 48.0% for AGIs $10k-25k, 42.6% for AGIs $25k-50k, 47.6% for AGIs $50k-75k, 52.9% for AGIs $75k-100k, 67.7% for AGIs over 100k)
Likely homosexual households (counted as self-reported same-sex unmarried-partner households)
Lesbian couples: 0.2% of all households
Gay men: 2.0% of all households
Household received Food Stamps/SNAP in the past 12 months: 590 Household did not receive Food Stamps/SNAP in the past 12 months: 16,429
Women who had a birth in the past 12 months: 234 (197 now married, 37 unmarried) Women who did not have a birth in the past 12 months: 8,246 (2,339 now married, 5,916 unmarried)
Housing units in zip code 30324 with a mortgage: 4,701 (730 second mortgage, 640 both second mortgage and home equity loan) Houses without a mortgage: 6
Median monthly owner costs for units with a mortgage: $2,299 Median monthly owner costs for units without a mortgage: $941
Residents with income below the poverty level in 2022:
This zip code:
8.9%
Whole state:
12.7%
Residents with income below 50% of the poverty level in 2022:
This zip code:
3.7%
Whole state:
6.3%
Median number of rooms in houses and condos:
Here:
5.9
State:
6.8
Median number of rooms in apartments:
Here:
3.3
State:
4.6
Notable locations in this zip code not listed on our city pages
Notable locations in zip code 30324: Lindbergh Center Station (A), Atlanta Fire / Rescue Station 29 (B), Atlanta Precinct Number 2 Police Station (C). Display/hide their locations on the map
Shopping Centers: Lindbergh Plaza Shopping Center (1), Ansley Mall Shopping Center (2), Buckhead Crossing Shopping Center (3). Display/hide their locations on the map
2,573 married couples with children.
882 single-parent households (311 men, 571 women).
81.7% of residents of 30324 zip code speak English at home.
5.8% of residents speak Spanish at home (80% very well, 10% well, 9% not well, 2% not at all).
5.5% of residents speak other Indo-European language at home (88% very well, 12% well).
5.0% of residents speak Asian or Pacific Island language at home (49% very well, 35% well, 16% not well).
2.1% of residents speak other language at home (69% very well, 11% well, 21% not well).
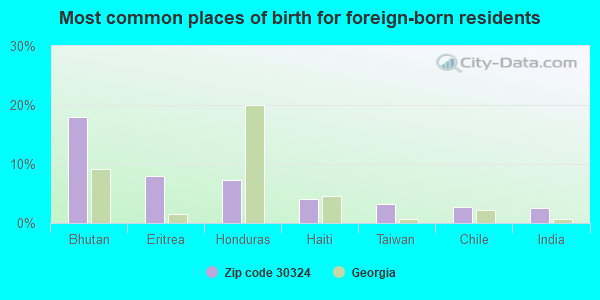
Foreign born population: 4,820 (16.2%) (49.4% of them are naturalized citizens)
Major facilities with environmental interests located in this zip code:
BP OIL CO (2200 MONROE DRIVE in ATLANTA, GA)
STATE MASTER (Georgia's Geographic Environmental Information) - UST-2, UNDERGROUND STORAGE TANK PROGRAM, UST-4, UST-5, UST-1, UST-3, STATE MASTER (Georgia's Geographic Environmental Information) - UST-10, UNDERGROUND STORAGE TANK PROGRAM, UST-6, UST-7, UST-8, UST-9, (Resource Conservation and Recovery Act (tracking hazardous waste)) Organizations: ROY DEMOONEY (CONTACT/OPERATOR)
, BP PRODUCTS NORTH AMERICA INC (CONTACT/OWNER)
, SEYMOUR SERVICE CO (INSTALLER)
Alternative names: GULF STATION #270231/24026, MONROE DRIVE BP
PENSKE AUTO CENTER (2581 PIEDMONT ROAD UNIT B in ATLANTA, GA)
AIR MINOR (AIRS/AFS) (Integrated Compliance Information System) - ICIS-04-1996-0531, FORMAL ENFORCEMENT ACTION, ICIS-04-1999-0047, (Resource Conservation and Recovery Act (tracking hazardous waste)) Business SIC classification: GASOLINE SERVICE STATIONS; GENERAL AUTOMOTIVE REPAIR SHOPS Organizations: PENSKE AUTO CENTER INC (CONTACT/OWNER)
Alternative names: KMART AUTO SERVICE
EXXON RAS 46888 (635 LINDBERGH DRIVE in ATLANTA, GA)
AIR MINOR (AIRS/AFS) STATE MASTER (Georgia's Geographic Environmental Information) - UST-1, UNDERGROUND STORAGE TANK PROGRAM, UST-2, UST-3, UST-4, Small Quantity Generators, between 100 kg and 1000 kg of hazardous waste/month (Resource Conservation and Recovery Act (tracking hazardous waste)) - notification Business SIC classification: GASOLINE SERVICE STATIONS Organizations: INTEGRATED SCIENCE & TECHNOLOGY INC (CONTACT/AGENT)
, EXXON MOBIL CORPORATION (CONTACT/OPERATOR)
, EXCELL INTOWN PROPERTIES LLC (CONTACT/OWNER)
, EXXON MOBIL (CONTACT/OWNER)
, TOM HELGETH (LEASES THE PROP FROM EXXON) (CONTACT/OWNER)
Alternative names: EXXON FOOD STORE, EXXON R/S #46888, PIEDMONT AT LINDBERGH EXXON
FEDERAL EXPRESS CORP (2441 CHESHIRE BRIDGE RD in ATLANTA, GA)
STATE MASTER (Georgia's Geographic Environmental Information) - UST-1, UNDERGROUND STORAGE TANK PROGRAM, UST-2, (Resource Conservation and Recovery Act (tracking hazardous waste)) Organizations: FEDERAL EXPRESS-JGLA (CONTACT/OPERATOR)
, HUNTINGTON (INSTALLER)
PEP BOYS #314 (2399 PEIDMONT ROAD in ATLANTA, GA)
AIR MINOR (AIRS/AFS) (Integrated Compliance Information System) - ICIS-04-2000-0793, FORMAL ENFORCEMENT ACTION Conditionally Exempt Small Quantity Generators, less than 100 kg/month of hazardous waste (Resource Conservation and Recovery Act (tracking hazardous waste)) - notification Business SIC classification: GENERAL AUTOMOTIVE REPAIR SHOPS Organizations: PEP BOYS MANNY, MOE AND JACK (CONTACT/OWNER)
QUIKTRIP #744 (761 SIDNEY MARCUS BLVD in ATLANTA, GA)
STATE MASTER (Georgia's Geographic Environmental Information) - UST-1, UNDERGROUND STORAGE TANK PROGRAM, UST-2, UST-3, Conditionally Exempt Small Quantity Generators, less than 100 kg/month of hazardous waste (Resource Conservation and Recovery Act (tracking hazardous waste)) - notification Organizations: QUIKTRIP CORP (CONTACT/OPERATOR)
, ATLANTA PETRO EQUIP (INSTALLER)
Alternative names: QUIKTRIP CORP STORE 744, QUIKTRIP STORE #744
BP #10004 (1856 PIEDMONT ROAD in ATLANTA, GA)
STATE MASTER (Georgia's Geographic Environmental Information) - UST-1, UNDERGROUND STORAGE TANK PROGRAM, UST-2, UST-5, UST-6, UST-3, UST-4, Small Quantity Generators, between 100 kg and 1000 kg of hazardous waste/month (Resource Conservation and Recovery Act (tracking hazardous waste)) - notification Organizations: BP PRODUCTS NORTH AMERICA INC (CONTACT/OPERATOR)
, AMOCO OIL CO (CONTACT/OWNER)
, AMOCO OIL COMPANY (INSTALLER)
Alternative names: BP/AMOCO #6308, BP/AMOCO #6308, PIEDMONT ROAD AMOCO
BP OIL CO (2320 CHESHIRE BRIDGE ROAD NORTHEAST in ATLANTA, GA)
STATE MASTER (Georgia's Geographic Environmental Information) - UST-1, UNDERGROUND STORAGE TANK PROGRAM, UST-3, UST-5, UST-2, UST-4, Conditionally Exempt Small Quantity Generators, less than 100 kg/month of hazardous waste (Resource Conservation and Recovery Act (tracking hazardous waste)) - notification Organizations: BP PRODUCTS NORTH AMERICA INC (CONTACT/OPERATOR)
, BP OIL CO. (CONTACT/OWNER)
, PANGEAN SOLUTIONS (CONTRACTOR)
Alternative names: BP #24019, BP #24019
METALICO EVANS INC (740 LAMBERT DR. N.E. in ATLANTA, GA)
AIR MINOR (AIRS/AFS) COMPLIANCE ACTIVITY (Tracking inspections of insecticide, fungicide, and rodenticide, and toxic substances) CRITERIA AND HAZARDOUS AIR POLLUTANT INVENTORY (Inventory of air pollution sources) (Resource Conservation and Recovery Act (tracking hazardous waste)) TRI REPORTER (Tracking of toxic chemicals releasing facilities) Business SIC classification: ROLLING, DRAWING, AND EXTRUDING OF NONFERROUS METALS, EXCEPT COPPER AND ALUMINUM Business NAICS classification: NONFERROUS METAL (EXCEPT COPPER AND ALUMINUM) ROLLING, DRAWING, AND EXTRUDING. Organizations: METALICO INC (CONTACT/OWNER)
, TARACORP INC (CONTACT/OWNER)
Alternative names: METALICE-EVANS, INC.
EXXON CO USA 45283 (1570 MONROE DR in ATLANTA, GA)
STATE MASTER (Georgia's Geographic Environmental Information) - UST-2, UNDERGROUND STORAGE TANK PROGRAM, UST-1, UST-3, Conditionally Exempt Small Quantity Generators, less than 100 kg/month of hazardous waste (Resource Conservation and Recovery Act (tracking hazardous waste)) - notification Organizations: EXXON MOBIL CORPORATION (CONTACT/OPERATOR)
, EXXON MOBIL (CONTACT/OWNER)
Alternative names: EXXON FOOD STORE, EXXON R/S #4-5283
PEACH STATE VALET (195 OTTLEY DRIVE NE in ATLANTA, GA)
National Pollutant Discharge Elimination System NON-MAJOR (Tracking pollutant discharge elimination systems) - permit (Resource Conservation and Recovery Act (tracking hazardous waste)) TRI REPORTER (Tracking of toxic chemicals releasing facilities) Business SIC classification: ADHESIVES AND SEALANTS Organizations: OPERNAME (CONTACT/OPERATOR)
, JOHN PARK (CONTACT/OWNER)
, NATIONAL STARCH AND CHEMICAL (CONTACT/OWNER)
Alternative names: NATIONAL STARCH & CHEMICAL
BRIAR VISTA ELEMENTARY SCHOOL (1131 BRIAR VISTA TERRACE, NE in ATLANTA, GA)
(Geographic Names Information System) (National Center for Education Statistics) - STATE ID-4051 Organizations: DEKALB COUNTY (SCHOOL DISTRICT)
Housing units lacking complete plumbing facilities: 0.2% Housing units lacking complete kitchen facilities: 1.7%
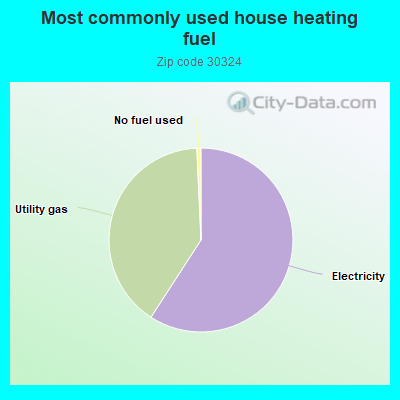
58.8%Electricity
39.9%Utility gas
0.7%No fuel used
Population in 1990: 15,044. Population change in the 1990s: +5,273 (+35.1%).
Place of birth for U.S.-born residents:
This state: 9,799
Northeast: 2,677
Midwest: 3,245
South: 7,638
West: 1,291
33% of the 30324 zip code residents lived in the same house 5 years ago. Out of people who lived in different houses, 32% lived in this county. Out of people who lived in different counties, 50% lived in Georgia.
75% of the 30324 zip code residents lived in the same house 1 year ago. Out of people who lived in different houses, 34% moved from this county. Out of people who lived in different houses, 27% moved from different county within same state. Out of people who lived in different houses, 33% moved from different state. Out of people who lived in different houses, 7% moved from abroad.
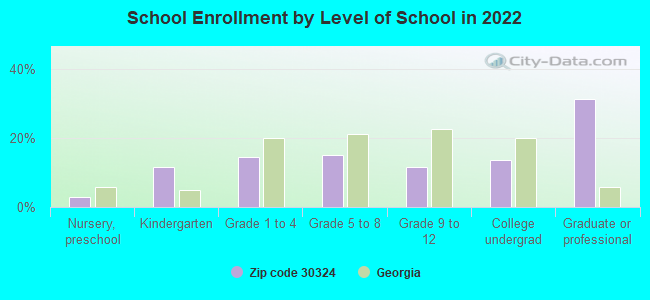
Private vs. public school enrollment:
Students in private schools in grades 1 to 8 (elementary and middle school): 971
Here:
53.2%
Georgia:
12.1%
Students in private schools in grades 9 to 12 (high school): 212
Here:
31.4%
Georgia:
10.8%
Students in private undergraduate colleges: 129
Here:
16.3%
Georgia:
17.1%
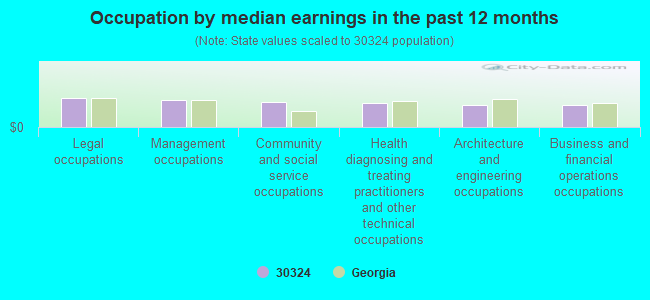
Occupation by median earnings in the past 12 months ($)
109,476Legal occupations
99,964Management occupations
94,006Community and social service occupations
89,227Health diagnosing and treating practitioners and other technical occupations
83,490Architecture and engineering occupations
82,585Business and financial operations occupations
Companies with federal contracts located in this zip code:
GEORGIA TRANE CO (2677 BUFORD HWY NE in ATLANTA, GA) : $1,494,238 in 21 contractsfrom 2000 to 2002
Contracts for Maintenance, Repair or Alteration of Real Property -- Heating and Cooling Plants, Refrigeration and Air Conditioning Components, Maintenance, Repair or Alteration of Real Property -- Office Buildings, Miscellaneous Items by Army, Air Force, Public Buildings Service, Bureau of Prisoners/Federal Prison System, and others Signed by year:2000: $884,583; 2001: $109,278; 2002: $500,377; 2003: $0; 2004: $0; 2005: $0; 2006: $0.
Biggest contracts:
$411,900 with Army for Maintenance, Repair or Alteration of Real Property -- Heating and Cooling Plants. Signed on 2000-12-15. Completion date: 2002-09-30.
$314,370, same as above.Signed on 2002-03-22. Completion date: 2002-09-30.
$137,527, same as above.Signed on 2000-09-22. Completion date: 2002-09-30.
$89,820, same as above.Signed on 2002-02-08. Completion date: 2002-09-30.
KUNZ CORPORATION (15 PLANTATION DR NE in ATLANTA, GA; small business) : $394,275 in 3 contractsfrom 2001 to 2005
$291,825 with Air Force for Aircraft Ground Servicing Equipment. Signed on 2003-09-05. Completion date: 2004-03-02.
$53,300 with Navy for Aircraft Wheel and Brake Systems. Signed on 2001-06-07. Completion date: 2001-09-06.
$49,150 with Air Force for Aircraft Ground Servicing Equipment. Signed on 2005-09-30. Completion date: 2006-02-28.
FINNEY HEATING & AIR CONDITION (1265 WOODS CIRCLE in ATLANTA, GA; small business) : $219,195 in 16 contractsfrom 2002 to 2004
Contracts for Air Conditioning Equipment, Maintenance, Repair or Alteration of Real Property -- Miscellaneous Buildings by Army Signed by year:2000: $0; 2001: $0; 2002: $179,290; 2003: $36,910; 2004: $2,995; 2005: $0; 2006: $0.
Biggest contracts:
$31,750 with Army for Air Conditioning Equipment. Signed on 2002-05-08. Completion date: 2002-06-14.
$28,500, same as above.Signed on 2002-09-30. Completion date: 2002-10-31.
$28,460 with Army for Maintenance, Repair or Alteration of Real Property -- Miscellaneous Buildings. Signed on 2003-12-01. Completion date: 2003-12-31.
$15,995, same as above.Signed on 2002-08-16. Completion date: 2002-09-30.
Alphaquest (834 Cardova Drive N.E. in Atlanta, GA; small business) : $135,000 in 5 contractsfrom 2000 to 2005
Contracts for Legal Services by Offices, Boards and Divisions (includes Attorney General, Deputy Attorney General, etc.) Signed by year:2000: $60,000; 2001: $0; 2002: $0; 2003: $0; 2004: $0; 2005: $75,000; 2006: $0.
Biggest contracts:
$60,000 with Offices, Boards and Divisions (includes Attorney General, Deputy Attorney General, etc.) for Legal Services. Signed on 2000-11-15. Completion date: 2001-08-15.
$30,000, same as above.Signed on 2005-06-29. Completion date: 2005-09-30.
$25,000, same as above.Signed on 2005-04-29. Completion date: 2005-09-30.
$10,000, same as above.Signed on 2005-03-21. Completion date: 2005-09-30.
ROLLINS INC (2170 PIEDMONT RD NE in ATLANTA, GA) : $46,857 in 21 contractsfrom 2002 to 2006
Contracts for Insect and Rodent Control Services, by Army, Agricultural Research Service, National Institutes of Health, National Oceanic and Atmospheric Administration/Under Secretary for Oceans and Atmosphere, and others Signed by year:2000: $0; 2001: $0; 2002: $1,632; 2003: $13,824; 2004: $18,860; 2005: $8,022; 2006: $4,519.
Biggest contracts:
$9,720 with Army for Insect and Rodent Control Services. Taking place in UT. Signed on 2004-06-21. Completion date: 2004-06-30.
$8,640, same as above.Signed on 2003-04-28. Completion date: 2004-06-30.
$5,184, same as above.Signed on 2005-05-20. Completion date: 2006-06-30.
$5,184, same as above.Signed on 2004-06-22. Completion date: 2005-06-30.
METALICO OF GEORGIA, INC (740 LAMBERT DRIVE, NE in ATLANTA, GA; small business) : $44,827 in 2 contractsin 2001
$44,827 with Navy for Miscellaneous Ship and Marine Equipment. Signed on 2001-11-09. Completion date: 2001-11-30.
$0, same as above.Signed on 2001-11-09. Completion date: 2001-11-30.
CORPORATE ENVIRONMENTAL RISK M (2115 MONROE DRIVE, SUITE 1 in ATLANTA, GA; small business) : $44,630 in 5 contractsin 2003
Contracts for Other Professional Services by Army, U.S. Army Corps of Engineers - civil program financing only Signed by year:2000: $0; 2001: $0; 2002: $0; 2003: $44,630; 2004: $0; 2005: $0; 2006: $0.
Biggest contracts:
$21,350 with Army for Other Professional Services. Taking place in AL. Signed on 2003-08-20. Completion date: 2003-07-17.
$9,400, same as above.Signed on 2003-07-21. Completion date: 2003-07-17.
$4,907, same as above.Signed on 2003-10-23. Completion date: 2003-11-17.
$4,907 with U.S. Army Corps of Engineers - civil program financing only for Other Professional Services. Taking place in AL. Signed on 2003-10-23. Completion date: 2003-11-17.
ORKIN PEST CONTROL (2170 PIEDMONT ROAD, NE in ATLANTA, AL) : $18,375 in 9 contractsfrom 2003 to 2006
Contracts for Insect and Rodent Control Services, Landscaping/Groundskeeping Services by Army Signed by year:2000: $0; 2001: $0; 2002: $0; 2003: $4,025; 2004: $8,950; 2005: $2,700; 2006: $2,700.
Biggest contracts:
$3,500 with Army for Insect and Rodent Control Services. Taking place in CO. Signed on 2004-05-20. Completion date: 2005-06-30.
$2,700 with Army for Insect and Rodent Control Services. Taking place in UT. Signed on 2006-06-30. Effective on 2006-07-01. Completion date: 2007-06-30.
$2,700, same as above.Signed on 2005-05-20. Completion date: 2006-06-30.
$2,700, same as above.Signed on 2004-07-20. Completion date: 2005-06-30.
EQUITECH OF GA INC (1392 LAVISTA RD NE in ATLANTA, GA; small business)
$17,601 with Navy for Other Buildings. Signed on 2000-09-17. Completion date: 2000-12-26.
DOWNS SAFE & LOCK CO INC (1846 CHESHIRE BRIDGE RD NE in ATLANTA, GA; small business)
$4,300 with Army for Office Furniture. Signed on 2004-03-10. Completion date: 2004-03-25.
Top industries in this zip code by the number of employees in 2005:
2002 - 2018 National Fire Incident Reporting System (NFIRS) incidents
According to the data from the years 2002 - 2018 the average number of fires per year is 38. The highest number of fire incidents - 80 took place in 2003, and the least - 0 in 2004. The data has a declining trend.
When looking into fire subcategories, the most incidents belonged to: Structure Fires (38.3%), and Outside Fires (37.7%).
Fire incident types reported to NFIRS in Zip Code 30324


 Nearest zip codes: 30306, 30326, 30309, 30305, 30329, 30322.
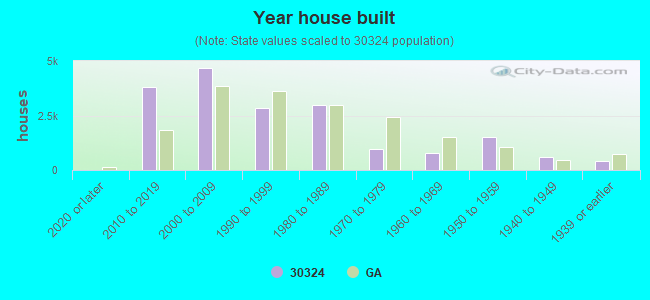


 According to the data from the years 2002 - 2018 the average number of fires per year is 38. The highest number of fire incidents - 80 took place in 2003, and the least - 0 in 2004. The data has a declining trend.
 When looking into fire subcategories, the most incidents belonged to: Structure Fires (38.3%), and Outside Fires (37.7%).