Estimated zip code population in 2022: 27,037 Zip code population in 2010: 22,999 Zip code population in 2000: 21,380
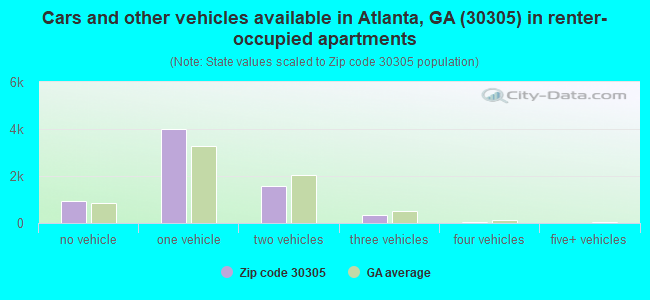
Houses and condos: 17,082 Renter-occupied apartments: 6,881
% of renters here:
46%
State:
34%
March 2022 cost of living index in zip code 30305: 107.1 (more than average, U.S. average is 100)
Land area: 6.4 sq. mi. Water area: 0.0 sq. mi.
Population density: 4,201 people per square mile
(average).
OSM Map
General Map
Google Map
MSN Map
OSM Map
General Map
Google Map
MSN Map
OSM Map
General Map
Google Map
MSN Map
OSM Map
General Map
Google Map
MSN Map
Please wait while loading the map...
Real estate property taxes paid for housing units in 2022:
This zip code:
1.1% ($8,843)
Georgia:
0.7% ($2,160)
Median real estate property taxes paid for housing units with mortgages in 2022: $8,919 (1.1%) Median real estate property taxes paid for housing units with no mortgage in 2022: $8,562 (1.1%)
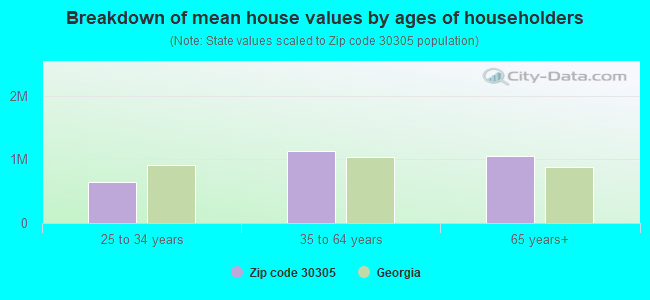
Estimated median house/condo value in 2022: $818,545
30305:
$818,545
Georgia:
$297,400
According to our research of Georgia and other state lists, there were 6 registered sex offenders living in 30305 zip code as of April 27, 2024. The ratio of all residents to sex offenders in zip code 30305 is 3,899 to 1. The ratio of registered sex offenders to all residents in this zip code is much lower than the state average.
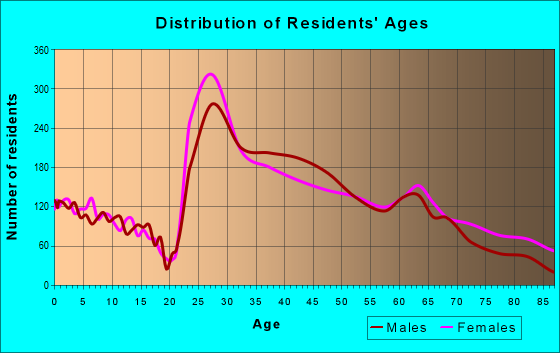
Median resident age:
This zip code:
38.6 years
Georgia median age:
37.6 years
Average household size:
This zip code:
1.8 people
Georgia:
2.6 people
Averages for the 2020 tax year for zip code 30305, filed in 2021:
Average Adjusted Gross Income (AGI) in 2020: $319,743 (Individual Income Tax Returns)
Here:
$319,743
State:
$70,847
Salary/wage: $182,650 (reported on 78.3% of returns)
Here:
$182,650
State:
$59,126
(% of AGI for various income ranges: 1189.1% for AGIs below $25k, 4171.1% for AGIs $25k-50k, 7509.5% for AGIs $50k-75k, 11091.8% for AGIs $75k-100k, 20704.2% for AGIs $100k-200k, 212353.4% for AGIs over 200k)
Taxable interest for individuals: $9,748 (reported on 45.8% of returns)
This zip code:
$9,748
Georgia:
$2,011
(% of AGI for various income ranges: 34.1% for AGIs below $25k, 33.4% for AGIs $25k-50k, 51.3% for AGIs $50k-75k, 103.8% for AGIs $75k-100k, 285.3% for AGIs $100k-200k, 8023.4% for AGIs over 200k)
Ordinary dividends: $53,243 (reported on 47.4% of returns)
Here:
$53,243
State:
$8,996
(% of AGI for various income ranges: 137.3% for AGIs below $25k, 200.7% for AGIs $25k-50k, 265.6% for AGIs $50k-75k, 582.4% for AGIs $75k-100k, 1772.9% for AGIs $100k-200k, 45319.1% for AGIs over 200k)
Net capital gain/loss in AGI: +$161,041 (reported on 45.4% of returns)
Here:
+$161,041
State:
+$28,402
(% of AGI for various income ranges: 85.7% for AGIs below $25k, 126.6% for AGIs $25k-50k, 190.8% for AGIs $50k-75k, 348.7% for AGIs $75k-100k, 1769.4% for AGIs $100k-200k, 140712.0% for AGIs over 200k)
Profit/loss from business: +$33,231 (reported on 23.5% of returns)
Here:
+$33,231
State:
+$6,707
(% of AGI for various income ranges: 143.3% for AGIs below $25k, 278.6% for AGIs $25k-50k, 331.7% for AGIs $50k-75k, 377.4% for AGIs $75k-100k, 1285.8% for AGIs $100k-200k, 11497.0% for AGIs over 200k)
Taxable individual retirement arrangement distribution: $42,616 (reported on 9.4% of returns)
30305:
$42,616
Georgia:
$20,525
(% of AGI for various income ranges: 49.0% for AGIs below $25k, 115.1% for AGIs $25k-50k, 154.8% for AGIs $50k-75k, 301.7% for AGIs $75k-100k, 1156.7% for AGIs $100k-200k, 5147.1% for AGIs over 200k)
Self-employed (Keogh) retirement plans: $38,970 (reported on 3.5% of returns)
30305:
$38,970
Georgia:
$27,751
(% of AGI for various income ranges: 31.0% for AGIs $50k-75k, 126.0% for AGIs $100k-200k, 2460.0% for AGIs over 200k)
Total itemized deductions: $79,288 (reported on 30.3% of returns)
Here:
$79,288
State:
$34,001
(% of AGI for various income ranges: 154.1% for AGIs below $25k, 302.1% for AGIs $25k-50k, 499.4% for AGIs $50k-75k, 923.4% for AGIs $75k-100k, 2441.8% for AGIs $100k-200k, 40834.7% for AGIs over 200k)
Charity contributions: $54,097 (reported on 26.6% of returns)
Here:
$54,097
State:
$14,164
(% of AGI for various income ranges: 11.4% for AGIs below $25k, 47.0% for AGIs $25k-50k, 77.6% for AGIs $50k-75k, 155.4% for AGIs $75k-100k, 538.5% for AGIs $100k-200k, 27171.8% for AGIs over 200k)
Taxes paid: $9,159 (reported on 30.3% of returns)
30305:
$9,159
State:
$7,540
(% of AGI for various income ranges: 31.1% for AGIs below $25k, 72.1% for AGIs $25k-50k, 118.6% for AGIs $50k-75k, 252.1% for AGIs $75k-100k, 737.3% for AGIs $100k-200k, 3594.9% for AGIs over 200k)
Earned income credit: $1,399 (reported on 5.4% of returns)
Here:
$1,399
State:
$2,530
(% of AGI for various income ranges: 46.9% for AGIs below $25k, 21.4% for AGIs $25k-50k)
Percentage of individuals using paid preparers for their 2020 taxes: 93.2%
Here:
93%
State:
93%
(% for various income ranges: 89.2% for AGIs below $25k, 91.4% for AGIs $25k-50k, 93.5% for AGIs $50k-75k, 95.1% for AGIs $75k-100k, 93.8% for AGIs $100k-200k, 95.8% for AGIs over 200k)
Averages for the 2012 tax year for zip code 30305, filed in 2013:
Average Adjusted Gross Income (AGI) in 2012: $248,867 (Individual Income Tax Returns)
Here:
$248,867
State:
$56,131
Salary/wage: $151,303 (reported on 78.6% of returns)
Here:
$151,303
State:
$47,942
(% of AGI for various income ranges: 73.1% for AGIs below $25k, 84.4% for AGIs $25k-50k, 82.7% for AGIs $50k-75k, 74.9% for AGIs $75k-100k, 66.8% for AGIs $100k-200k, 41.8% for AGIs over 200k)
Taxable interest for individuals: $9,544 (reported on 49.5% of returns)
This zip code:
$9,544
Georgia:
$1,706
(% of AGI for various income ranges: 2.1% for AGIs below $25k, 0.8% for AGIs $25k-50k, 1.1% for AGIs $50k-75k, 1.3% for AGIs $75k-100k, 1.5% for AGIs $100k-200k, 2.0% for AGIs over 200k)
Ordinary dividends: $40,025 (reported on 46.5% of returns)
Here:
$40,025
State:
$7,265
(% of AGI for various income ranges: 8.2% for AGIs below $25k, 3.3% for AGIs $25k-50k, 3.7% for AGIs $50k-75k, 5.0% for AGIs $75k-100k, 6.4% for AGIs $100k-200k, 8.0% for AGIs over 200k)
Net capital gain/loss in AGI: +$114,562 (reported on 41.9% of returns)
Here:
+$114,562
State:
+$16,323
(% of AGI for various income ranges: 1.1% for AGIs below $25k, 1.0% for AGIs $25k-50k, 0.9% for AGIs $50k-75k, 1.8% for AGIs $75k-100k, 3.8% for AGIs $100k-200k, 23.1% for AGIs over 200k)
Profit/loss from business: +$37,732 (reported on 20.4% of returns)
Here:
+$37,732
State:
+$7,583
(% of AGI for various income ranges: 9.4% for AGIs below $25k, 4.7% for AGIs $25k-50k, 2.7% for AGIs $50k-75k, 4.7% for AGIs $75k-100k, 4.6% for AGIs $100k-200k, 2.8% for AGIs over 200k)
Taxable individual retirement arrangement distribution: $45,568 (reported on 12.1% of returns)
30305:
$45,568
Georgia:
$17,199
(% of AGI for various income ranges: 2.9% for AGIs below $25k, 1.8% for AGIs $25k-50k, 2.2% for AGIs $50k-75k, 3.0% for AGIs $75k-100k, 5.0% for AGIs $100k-200k, 1.9% for AGIs over 200k)
Self-employment retirement plans: $38,804 (reported on 3.9% of returns)
30305:
$38,804
Georgia:
$23,277
(% of AGI for various income ranges: 0.7% for AGIs $50k-75k, 0.5% for AGIs $100k-200k, 0.7% for AGIs over 200k)
Total itemized deductions: $71,644 (17% of AGI, reported on 54.3% of returns)
Here:
$71,644
State:
$23,886
Here:
16.8% of AGI
State:
21.5% of AGI
(% of AGI for various income ranges: 20.0% for AGIs below $25k, 12.9% for AGIs $25k-50k, 15.3% for AGIs $50k-75k, 20.2% for AGIs $75k-100k, 19.8% for AGIs $100k-200k, 15.1% for AGIs over 200k)
Charity contributions: $23,365 (reported on 47.1% of returns)
Here:
$23,365
State:
$5,507
(% of AGI for various income ranges: 1.1% for AGIs below $25k, 1.4% for AGIs $25k-50k, 1.9% for AGIs $50k-75k, 2.2% for AGIs $75k-100k, 2.7% for AGIs $100k-200k, 4.9% for AGIs over 200k)
Taxes paid: $29,585 (reported on 54.1% of returns)
30305:
$29,585
State:
$7,838
(% of AGI for various income ranges: 5.1% for AGIs below $25k, 3.5% for AGIs $25k-50k, 4.5% for AGIs $50k-75k, 6.2% for AGIs $75k-100k, 8.2% for AGIs $100k-200k, 6.5% for AGIs over 200k)
Earned income credit: $1,381 (reported on 5.3% of returns)
Here:
$1,381
State:
$2,589
(% of AGI for various income ranges: 2.4% for AGIs below $25k, 0.1% for AGIs $25k-50k)
Percentage of individuals using paid preparers for their 2012 taxes: 59.5%
Here:
59%
State:
55%
(% for various income ranges: 53.6% for AGIs below $25k, 48.8% for AGIs $25k-50k, 49.1% for AGIs $50k-75k, 53.8% for AGIs $75k-100k, 63.8% for AGIs $100k-200k, 81.7% for AGIs over 200k)
Averages for the 2004 tax year for zip code 30305, filed in 2005:
Average Adjusted Gross Income (AGI) in 2004: $190,695 (Individual Income Tax Returns)
Here:
$190,695
State:
$47,553
Salary/wage: $119,580 (reported on 73.6% of returns)
Here:
$119,580
State:
$42,178
(% of AGI for various income ranges: 70.4% for AGIs $10k-25k, 79.6% for AGIs $25k-50k, 74.9% for AGIs $50k-75k, 72.3% for AGIs $75k-100k, 40.2% for AGIs over 100k)
Taxable interest for individuals: $10,710 (reported on 61.0% of returns)
This zip code:
$10,710
Georgia:
$1,772
(% of AGI for various income ranges: 3.9% for AGIs $10k-25k, 2.0% for AGIs $25k-50k, 2.9% for AGIs $50k-75k, 2.4% for AGIs $75k-100k, 3.3% for AGIs over 100k)
Taxable dividends: $32,795 (reported on 53.0% of returns)
Here:
$32,795
State:
$4,283
(% of AGI for various income ranges: 6.6% for AGIs $10k-25k, 3.9% for AGIs $25k-50k, 5.2% for AGIs $50k-75k, 5.9% for AGIs $75k-100k, 9.2% for AGIs over 100k)
Net capital gain/loss: +$93,326 (reported on 47.9% of returns)
Here:
+$93,326
State:
+$16,461
(% of AGI for various income ranges: 3.0% for AGIs $10k-25k, 2.3% for AGIs $25k-50k, 1.9% for AGIs $50k-75k, 2.9% for AGIs $75k-100k, 25.0% for AGIs over 100k)
Profit/loss from business: +$38,305 (reported on 19.9% of returns)
Here:
+$38,305
State:
+$8,201
(% of AGI for various income ranges: 7.5% for AGIs $10k-25k, 4.7% for AGIs $25k-50k, 5.1% for AGIs $50k-75k, 5.4% for AGIs $75k-100k, 3.7% for AGIs over 100k)
IRA payment deduction: $3,379 (reported on 2.7% of returns)
30305:
$3,379
Georgia:
$2,969
(% of AGI for various income ranges: 0.2% for AGIs $10k-25k, 0.2% for AGIs $25k-50k, 0.1% for AGIs $50k-75k, 0.1% for AGIs $75k-100k, 0.0% for AGIs over 100k)
Self-employed pension: $27,533 (reported on 4.7% of returns)
Here:
$27,533
Georgia:
$16,203
(% of AGI for various income ranges: 0.2% for AGIs $25k-50k, 0.3% for AGIs $50k-75k, 0.5% for AGIs $75k-100k, 0.7% for AGIs over 100k)
Total itemized deductions: $53,854 (17% of AGI, reported on 58.1% of returns)
Here:
$53,854
State:
$19,944
Here:
16.8% of AGI
State:
22.6% of AGI
(% of AGI for various income ranges: 21.7% for AGIs $10k-25k, 17.1% for AGIs $25k-50k, 22.4% for AGIs $50k-75k, 25.1% for AGIs $75k-100k, 15.0% for AGIs over 100k)
Charity contributions deductions: $15,896 (5% of AGI, reported on 51.3% of returns)
Here:
$15,896
State:
$4,354
Here:
4.5% of AGI
State:
4.7% of AGI
(% of AGI for various income ranges: 2.3% for AGIs $10k-25k, 2.0% for AGIs $25k-50k, 2.8% for AGIs $50k-75k, 3.3% for AGIs $75k-100k, 4.3% for AGIs over 100k)
Total tax: $47,932 (reported on 85.0% of returns)
30305:
$47,932
State:
$8,223
(% of AGI for various income ranges: 5.7% for AGIs $10k-25k, 9.6% for AGIs $25k-50k, 12.3% for AGIs $50k-75k, 13.0% for AGIs $75k-100k, 21.9% for AGIs over 100k)
Earned income credit: $1,059 (reported on 4.1% of returns)
Here:
$1,059
State:
$1,986
Percentage of individuals using paid preparers for their 2004 taxes: 64.6%
Here:
65%
State:
62%
(% for various income ranges: 66.7% for AGIs below $10k, 59.9% for AGIs $10k-25k, 50.9% for AGIs $25k-50k, 54.0% for AGIs $50k-75k, 60.9% for AGIs $75k-100k, 79.3% for AGIs over 100k)
Likely homosexual households (counted as self-reported same-sex unmarried-partner households)
Lesbian couples: 0.1% of all households
Gay men: 0.3% of all households
Household received Food Stamps/SNAP in the past 12 months: 692 Household did not receive Food Stamps/SNAP in the past 12 months: 14,227
Women who had a birth in the past 12 months: 434 (399 now married, 35 unmarried) Women who did not have a birth in the past 12 months: 6,638 (2,501 now married, 4,138 unmarried)
Housing units in zip code 30305 with a mortgage: 4,899 (535 second mortgage, 494 both second mortgage and home equity loan) Houses without a mortgage: 145
Median monthly owner costs for units with a mortgage: $3,241 Median monthly owner costs for units without a mortgage: $1,468
Residents with income below the poverty level in 2022:
This zip code:
8.4%
Whole state:
12.7%
Residents with income below 50% of the poverty level in 2022:
This zip code:
4.0%
Whole state:
6.3%
Median number of rooms in houses and condos:
Here:
6.3
State:
6.8
Median number of rooms in apartments:
Here:
3.2
State:
4.6
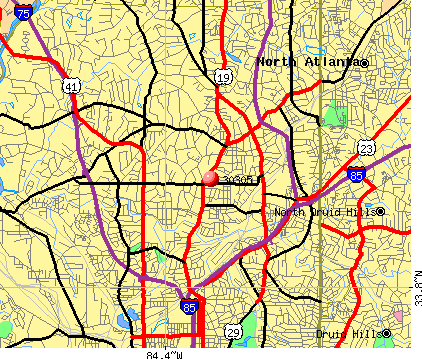
Notable locations in this zip code not listed on our city pages
Notable locations in zip code 30305: Cherokee Town Club (A), Atlanta Fire / Rescue Station 21 (B), Atlanta History Center-Buckhead (C), Swan House (D), Southern Center for International Studies (E), Buckhead Library (F). Display/hide their locations on the map
Shopping Centers: Buckhead Plaza Shopping Center (1), Andrews Square Shopping Center (2), Peachtree-Battle Shopping Center (3), Peachtree Piedmont Cross Shopping Center (4), The Peach Shopping Center (5). Display/hide their locations on the map
Churches in zip code 30305 include: Second Ponce De Leon Baptist Church (A), Peachtree Road Church (B), Covenant Church (C). Display/hide their locations on the map
Parks in zip code 30305 include: Alexander Park (1), Garden Hills Park (2), Parkside Drive Park (3), Peachtree Hills Park (4), Sibley Park (5), Sunny Brook Park (6), West Bolling Road Park (7), Woodward Way Park (8), Garden Hills Historic District (9). Display/hide their locations on the map
Tourist attractions (not listed on the city page) : Galerie Timothy Tew (Tours & Charters; 309 E Paces Ferry Rd), Fremen Amazon Charters & Tours (Tours & Charters; 3530 Piedmont Road Northeast).
3,845 married couples with children.
383 single-parent households (148 men, 235 women).
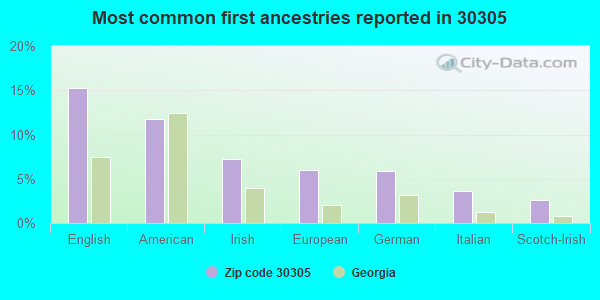
84.8% of residents of 30305 zip code speak English at home.
4.1% of residents speak Spanish at home (78% very well, 19% well, 3% not well).
6.0% of residents speak other Indo-European language at home (88% very well, 8% well, 3% not well).
4.5% of residents speak Asian or Pacific Island language at home (73% very well, 21% well, 5% not well).
1.1% of residents speak other language at home (100% very well).
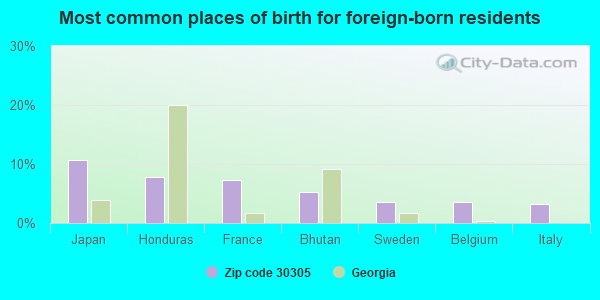
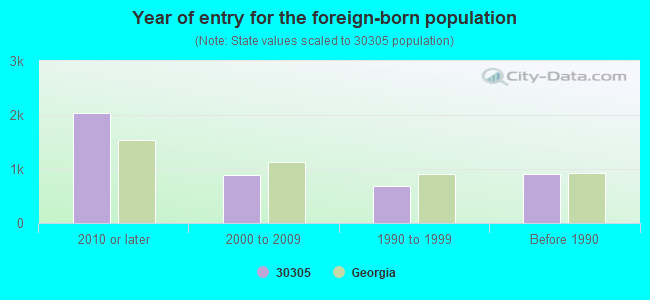
Foreign born population: 4,099 (15.2%) (44.1% of them are naturalized citizens)
AIR MINOR (AIRS/AFS) STATE MASTER (Georgia's Geographic Environmental Information) - UST-DF-63, UNDERGROUND STORAGE TANK PROGRAM (Integrated Compliance Information System) - ICIS-04-2003-2011, FORMAL ENFORCEMENT ACTION Business SIC classification: READY-MIXED CONCRETE Organizations: S&ME (CONTACT/AGENT)
, ALLIED READY MIX INC (CONTACT/OWNER)
, RMC-ALLIED (INSTALLER)
Alternative names: ALLIED READYMIX CONCRETE
EXXON RAS 45200 (2901 PEACHTREE RD NE in ATLANTA, GA)
AIR MINOR (AIRS/AFS) STATE MASTER (Georgia's Geographic Environmental Information) - UST-1, UNDERGROUND STORAGE TANK PROGRAM, UST-3, UST-4, UST-5, UST-6, UST-7, UST-8, UST-2, Conditionally Exempt Small Quantity Generators, less than 100 kg/month of hazardous waste (Resource Conservation and Recovery Act (tracking hazardous waste)) - notification Business SIC classification: NONCLASSIFIABLE ESTABLISHMENTS Business NAICS classification: OTHER AUTOMOTIVE MECHANICAL AND ELECTRICAL REPAIR AND MAINTENANCE. Organizations: EXXON MOBIL CORPORATION (CONTACT/OPERATOR)
, OPERNAME (CONTACT/OPERATOR)
, EXXON MOBIL (CONTACT/OWNER)
Alternative names: BUCKHEAD EXXON, EXXON FOOD STORE, EXXON R/S #4-5200
BP OIL CO (3004 PIEDMONT ROAD in ATLANTA, GA)
STATE MASTER (Georgia's Geographic Environmental Information) - UST-4, UNDERGROUND STORAGE TANK PROGRAM, UST-5, UST-7, UST-8, UST-9, UST-3, UST-6, UST-1, UST-2, Conditionally Exempt Small Quantity Generators, less than 100 kg/month of hazardous waste (Resource Conservation and Recovery Act (tracking hazardous waste)) - notification Organizations: PANGEAN SOLUTIONS (CONTACT/AGENT)
, BP PRODUCTS NORTH AMERICA INC (CONTACT/OPERATOR)
, BP OIL CO. (CONTACT/OWNER)
, BRYANT & COMPANY INC (INSTALLER)
Alternative names: BP #24037, BP #24037
NORTHSIDE HIGH SCHOOL (2875 NORTHSIDE DRIVE in ATLANTA, GA)
COMPLIANCE ACTIVITY (Tracking inspections of insecticide, fungicide, and rodenticide, and toxic substances) (National Center for Education Statistics) - STATE ID-0192 Organizations: ATLANTA CITY (SCHOOL DISTRICT)
ADCOR ELECTRONICS INC (349 PEACHTREE HILLS AVE NE in ATLANTA, GA)
AIR MINOR (AIRS/AFS) (Resource Conservation and Recovery Act (tracking hazardous waste)) Organizations: OPERNAME (CONTACT/OPERATOR)
Alternative names: ADCOR PRINTED CIRCUITS
CLASSIC COLLISION (2980-B PIEDMONT RD NE in ATLANTA, GA)
(Resource Conservation and Recovery Act (tracking hazardous waste)) Business NAICS classification: AUTOMOTIVE BODY, PAINT, AND INTERIOR REPAIR AND MAINTENANCE. Organizations: OPERNAME (CONTACT/OPERATOR)
, CLASSIC COLLISION - BUCKHEAD INC (CONTACT/OPERATOR)
, MILES DALY (CONTACT/OWNER)
Alternative names: LENOX PERFORMANCE INC
ANTHONY CLEANERS INC (3330-B PIEDMONT RD in ATLANTA, GA)
(Resource Conservation and Recovery Act (tracking hazardous waste)) Organizations: OPERNAME (CONTACT/OPERATOR)
, JEUN S YANG (CONTACT/OWNER)
BUCKHEAD CHRYSLER PLYMOUTH (3126 PIEDMONT RD NE in ATLANTA, GA)
CLARK LAUNDRY AND DRYCLEANING (3189 MAPLE DR NE in ATLANTA, GA)
(Resource Conservation and Recovery Act (tracking hazardous waste)) Organizations: OPERNAME (CONTACT/OPERATOR)
, CLARK WILLIAM DAVID (CONTACT/OWNER)
PEACHTREE MAZDA (2880 PEACHTREE RD NE in ATLANTA, GA)
(Resource Conservation and Recovery Act (tracking hazardous waste)) Organizations: OPERNAME (CONTACT/OPERATOR)
, DAVIS BILLY JR (CONTACT/OWNER)
POPE TEAM CHEVROLET (2930 PEACHTREE RD in ATLANTA, GA)
(Resource Conservation and Recovery Act (tracking hazardous waste)) Organizations: OPERNAME (CONTACT/OPERATOR)
, POPE JAMES (CONTACT/OWNER)
PROFESSIONAL CLEANERS (3145 PEACHTREE RD NE in ATLANTA, GA)
(Resource Conservation and Recovery Act (tracking hazardous waste)) Organizations: OPERNAME (CONTACT/OPERATOR)
, CONGDON ALLEN (CONTACT/OWNER)
Housing units lacking complete plumbing facilities: 0.9% Housing units lacking complete kitchen facilities: 1.0%
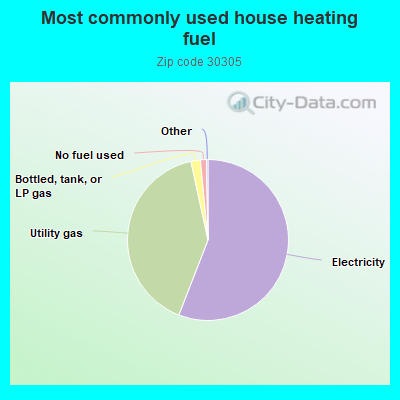
55.9%Electricity
40.7%Utility gas
1.9%Bottled, tank, or LP gas
1.2%No fuel used
Population in 1990: 19,122. Population change in the 1990s: +2,258 (+11.8%).
Place of birth for U.S.-born residents:
This state: 9,971
Northeast: 3,546
Midwest: 2,290
South: 6,359
West: 548
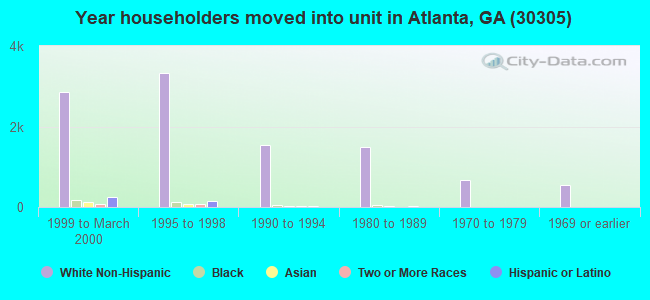
45% of the 30305 zip code residents lived in the same house 5 years ago. Out of people who lived in different houses, 45% lived in this county. Out of people who lived in different counties, 50% lived in Georgia.
81% of the 30305 zip code residents lived in the same house 1 year ago. Out of people who lived in different houses, 46% moved from this county. Out of people who lived in different houses, 25% moved from different county within same state. Out of people who lived in different houses, 22% moved from different state. Out of people who lived in different houses, 4% moved from abroad.
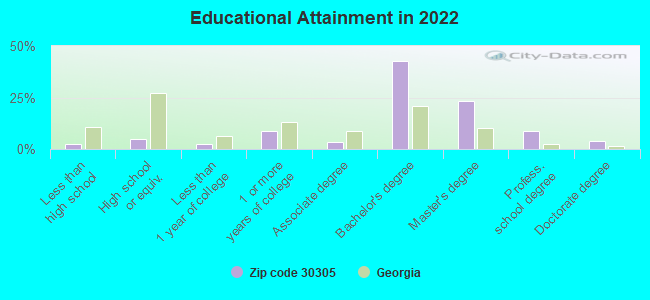
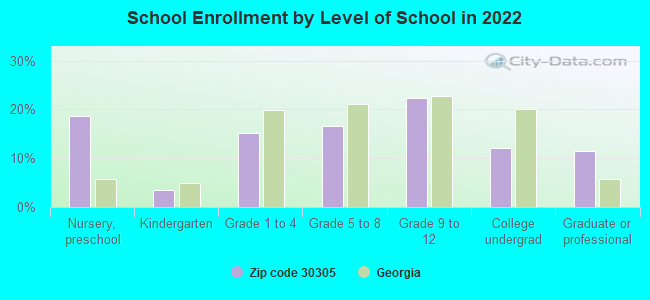
Private vs. public school enrollment:
Students in private schools in grades 1 to 8 (elementary and middle school): 847
Here:
57.0%
Georgia:
12.1%
Students in private schools in grades 9 to 12 (high school): 733
Here:
73.3%
Georgia:
10.8%
Students in private undergraduate colleges: 141
Here:
25.9%
Georgia:
17.1%
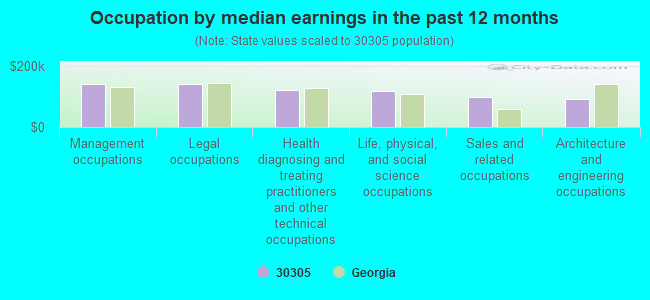
Occupation by median earnings in the past 12 months ($)
143,004Management occupations
140,371Legal occupations
121,527Health diagnosing and treating practitioners and other technical occupations
119,109Life, physical, and social science occupations
99,579Sales and related occupations
91,375Architecture and engineering occupations
Companies with biggest federal contracts located in this zip code:
SHELL ENERGY SERVICES COMPANY, (7 PIEDMONT CENTER STE 30 in ATLANTA, GA) : $36,591,280 in 15 contractsfrom 2000 to 2005
Contracts for Gases: Compressed and Liquefied, Gas Services by Defense Logistics Agency, Army Signed by year:2000: $12,291,576; 2001: $64,328; 2002: $30,950; 2003: $2,500; 2004: -$1,007; 2005: $24,202,933; 2006: $0.
Biggest contracts:
$24,202,933 with Defense Logistics Agency for Gases: Compressed and Liquefied. Taking place in TX. Signed on 2005-06-22. Completion date: 2008-09-30.
$6,200,742, same as above.Signed on 2000-09-18. Completion date: 2000-09-30.
$6,090,834, same as above.Signed on 2000-08-25. Completion date: 2000-08-25.
$36,226, same as above.Signed on 2002-05-16. Completion date: 2002-09-30.
k & f cONSULTING, iNC. (1303 Hightower Trail, Suite 315 in Atlanta, GA; small business) : $1,575,000 in 18 contractsfrom 2004 to 2005
Contracts for Expert Witness by Offices, Boards and Divisions (includes Attorney General, Deputy Attorney General, etc.) Signed by year:2000: $0; 2001: $0; 2002: $0; 2003: $0; 2004: $10,000; 2005: $1,565,000; 2006: $0.
Biggest contracts:
$100,000 with Offices, Boards and Divisions (includes Attorney General, Deputy Attorney General, etc.) for Expert Witness. Taking place in PA. Signed on 2005-11-01. Completion date: 2005-07-31.
$99,000, same as above.Signed on 2005-11-01. Completion date: 2006-12-31.
$99,000, same as above.Signed on 2005-11-01. Completion date: 2006-12-31.
$99,000, same as above.Signed on 2005-09-30. Completion date: 2006-12-31.
THE SOUTHERN CENTER FOR INTERN (320 W PACES FERRY RD NW in ATLANTA, GA) : $516,923 in 11 contractsfrom 2002 to 2006
Contracts for Education Services, Books and Pamphlets, Vehicular Furniture and Accessories by Air Force, Army Signed by year:2000: $0; 2001: $0; 2002: -$8,107; 2003: $62,000; 2004: $31,307; 2005: $73,800; 2006: $357,923.
Biggest contracts:
$201,989 with Air Force for Education Services. Signed on 2006-04-25. Completion date: 2006-11-15.
$87,430 with Air Force for Books and Pamphlets. Signed on 2006-04-12. Completion date: 2006-04-07.
$65,600, same as above.Signed on 2005-03-02. Completion date: 2005-04-15.
$62,000, same as above.Signed on 2003-08-01. Completion date: 2003-11-14.
PITTS ENTERPRISES INCORPORATED (3301 ROSWELL ROAD D-1 in ATLANTA, GA; small business) : $293,554 in 3 contractsfrom 1999 to 2001
$112,535 with Air Force for Trash/Garbage Collection Services - Including Portable Sanitation Services. Signed on 2001-10-01. Completion date: 2002-09-30.
$112,012 with Air Force for Custodial Janitorial Services. Signed on 2000-10-01. Completion date: 2001-09-30.
$69,007, same as above.Signed on 1999-10-13. Completion date: 2000-09-30.
ASBURY AUTOMOTIVE ATLANTA, LLC (87 W PACES FERRY RD NW in ATLANTA, GA) : $111,519 in 2 contractsfrom 2003 to 2004
$65,270 with Army for Trucks and Truck Tractors, Wheeled. Signed on 2004-11-05. Completion date: 2005-11-05.
$46,249 with NASA for Trailers. Signed on 2003-07-24. Effective on 2003-10-01. Completion date: 2003-08-30.
MATERIAL TESTING EQUIPMENT COR (3179 MAPLE DR STE 3 in ATLANTA, GA; small business) : $99,149 in 3 contractsin 2005
$43,540 with Army for Laboratory Equipment and Supplies. Signed on 2005-06-16. Completion date: 2005-08-26.
$38,535, same as above.Signed on 2005-09-30. Completion date: 2005-11-30.
$17,074 with Navy for Electrical and Electronic Properties Measuring and Testing Instruments. Signed on 2005-09-07. Completion date: 2005-12-15.
DIGITAL SOLUTIONS INC (SIX PIEDMONT CENTER STE 52 in ATLANTA, GA; small business) : $47,537 in 2 contractsin 2002
$30,826 with Air Force for Cameras, Motion Picture. Signed on 2002-07-30. Completion date: 2002-08-26.
$16,711 with Department of Defense for ADP Central Processing Unit (CPU, Computer), Digital. Signed on 2002-07-15. Completion date: 2002-08-23.
INFOSURV, INC (2870 PEACHTREE ROAD, SUITE in ATLANTA, GA; small business)
$39,600 with Army for Other Professional Services. Taking place in VA. Signed on 2005-08-04. Completion date: 2005-08-31.
ENVIRONMENTAL RESOURCE SERVICE (2320 VIRGINIA PLACE, SUITE in ATLANTA, GA; small business)
$34,145 with Army for Other Environmental Services, Studies, and Analytical Support. Signed on 2003-06-13. Completion date: 2003-09-30.
SMALLWOOD REYNOLDS STEWART STE (ONE PIEDMONT CENTER SUITE in ATLANTA, GA) : $33,042 in 4 contractsfrom 1999 to 2001
$45,229 with Army for Other Architect and Engineering Services. Signed on 2001-01-09. Completion date: 2000-03-13.
$31,244, same as above.Signed on 1999-11-12. Completion date: 1998-09-30.
$30,569, same as above.Signed on 2001-01-10. Completion date: 2000-03-13.
-$74,000, same as above.Signed on 2000-09-22. Completion date: 1995-02-15.
Top industries in this zip code by the number of employees in 2005:
Information: Data Processing, Hosting, and Related Services (500-999: 1, 250-499: 1, 20-49: 1, 10-19: 2, 1-4: 3)
Administrative and Support and Waste Management and Remediation Services: Temporary Help Services (100-249: 3, 50-99: 3, 20-49: 4, 10-19: 2, 5-9: 2, 1-4: 3)
Health Care and Social Assistance: Home Health Care Services (500-999: 1, 50-99: 1, 20-49: 1, 5-9: 1, 1-4: 2)
Other Services (except Public Administration): Parking Lots and Garages (500-999: 1, 20-49: 1, 10-19: 1, 5-9: 1, 1-4: 3)
Finance and Insurance: Direct Health and Medical Insurance Carriers (500-999: 1)
Professional, Scientific, and Technical Services: Administrative Management and General Management Consulting Services (250-499: 1, 100-249: 1, 20-49: 3, 10-19: 2, 5-9: 2, 1-4: 26)
Other Services (except Public Administration): Beauty Salons (50-99: 4, 20-49: 4, 10-19: 9, 5-9: 9, 1-4: 46)
People in group quarters in 2010:
205 people in nursing facilities/skilled-nursing facilities
20 people in other noninstitutional facilities
People in group quarters in 2000:
211 people in other group homes
Fatal accident statistics in 2014:
Fatal accident count: 1
Vehicles involved in fatal accidents: 3
Fatal accidents caused by drunken drivers: 0
Fatalities: 1
Persons involved in fatal accidents: 1
Pedestrians involved in fatal accidents: 0
Fatal accident statistics in 2012:
Fatal accident count: 1
Vehicles involved in fatal accidents: 2
Fatal accidents caused by drunken drivers: 0
Fatalities: 1
Persons involved in fatal accidents: 3
Pedestrians involved in fatal accidents: 0
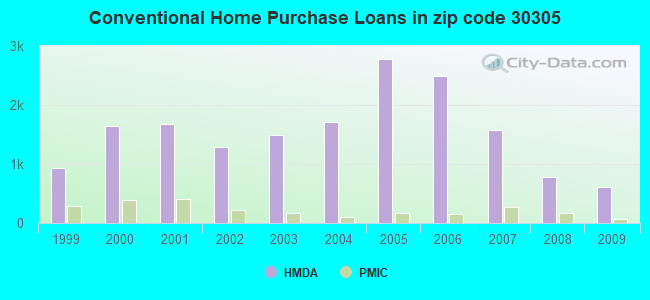
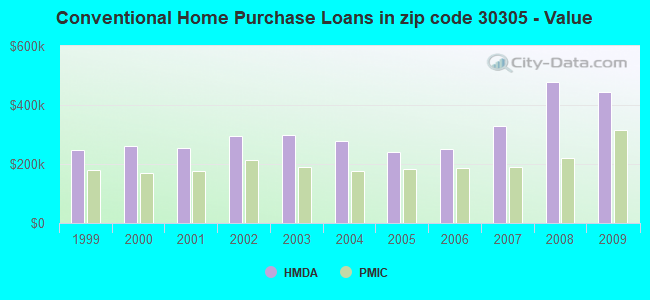
Home Mortgage Disclosure Act Aggregated Statistics For Year 2009 (Based on 4 full and 6 partial tracts)
A) FHA, FSA/RHS & VA Home Purchase Loans
B) Conventional Home Purchase Loans
C) Refinancings
D) Home Improvement Loans
E) Loans on Dwellings For 5+ Families
F) Non-occupant Loans on < 5 Family Dwellings (A B C & D)
Number
Average Value
Number
Average Value
Number
Average Value
Number
Average Value
Number
Average Value
Number
Average Value
LOANS ORIGINATED
176
$192,503
613
$445,686
1,386
$391,952
40
$173,164
7
$3,734,467
151
$388,087
APPLICATIONS APPROVED, NOT ACCEPTED
10
$222,458
54
$405,919
140
$375,329
8
$108,216
0
$0
17
$225,576
APPLICATIONS DENIED
21
$158,440
102
$543,670
449
$425,146
20
$137,884
0
$0
79
$429,991
APPLICATIONS WITHDRAWN
26
$212,964
100
$464,570
295
$385,396
3
$607,663
0
$0
48
$299,459
FILES CLOSED FOR INCOMPLETENESS
9
$201,192
18
$391,162
91
$400,297
4
$115,850
0
$0
10
$522,705
Aggregated Statistics For Year 2008 (Based on 4 full and 6 partial tracts)
A) FHA, FSA/RHS & VA Home Purchase Loans
B) Conventional Home Purchase Loans
C) Refinancings
D) Home Improvement Loans
E) Loans on Dwellings For 5+ Families
F) Non-occupant Loans on < 5 Family Dwellings (A B C & D)
G) Loans On Manufactured Home Dwelling (A B C & D)
Number
Average Value
Number
Average Value
Number
Average Value
Number
Average Value
Number
Average Value
Number
Average Value
Number
Average Value
LOANS ORIGINATED
52
$170,063
786
$477,624
661
$451,913
34
$569,245
3
$12,725,813
226
$566,008
0
$0
APPLICATIONS APPROVED, NOT ACCEPTED
3
$199,200
97
$430,284
115
$299,702
17
$147,589
0
$0
38
$244,434
0
$0
APPLICATIONS DENIED
15
$197,791
169
$344,871
335
$412,550
33
$83,363
1
$2,701,020
75
$156,162
2
$118,845
APPLICATIONS WITHDRAWN
18
$178,791
146
$411,773
173
$327,456
5
$441,988
0
$0
60
$323,435
0
$0
FILES CLOSED FOR INCOMPLETENESS
1
$217,440
27
$321,493
48
$472,034
4
$355,008
0
$0
9
$192,489
0
$0
Aggregated Statistics For Year 2007 (Based on 4 full and 6 partial tracts)
A) FHA, FSA/RHS & VA Home Purchase Loans
B) Conventional Home Purchase Loans
C) Refinancings
D) Home Improvement Loans
E) Loans on Dwellings For 5+ Families
F) Non-occupant Loans on < 5 Family Dwellings (A B C & D)
Number
Average Value
Number
Average Value
Number
Average Value
Number
Average Value
Number
Average Value
Number
Average Value
LOANS ORIGINATED
19
$155,423
1,584
$328,088
746
$422,557
75
$394,598
12
$1,450,364
381
$271,824
APPLICATIONS APPROVED, NOT ACCEPTED
0
$0
215
$266,718
155
$284,985
22
$167,009
0
$0
65
$209,938
APPLICATIONS DENIED
6
$163,685
316
$297,711
375
$413,956
44
$174,782
0
$0
119
$223,269
APPLICATIONS WITHDRAWN
0
$0
198
$333,387
200
$453,291
13
$459,683
0
$0
45
$223,521
FILES CLOSED FOR INCOMPLETENESS
0
$0
50
$339,305
54
$383,192
5
$92,216
0
$0
19
$408,388
Aggregated Statistics For Year 2006 (Based on 4 full and 6 partial tracts)
A) FHA, FSA/RHS & VA Home Purchase Loans
B) Conventional Home Purchase Loans
C) Refinancings
D) Home Improvement Loans
E) Loans on Dwellings For 5+ Families
F) Non-occupant Loans on < 5 Family Dwellings (A B C & D)
G) Loans On Manufactured Home Dwelling (A B C & D)
Number
Average Value
Number
Average Value
Number
Average Value
Number
Average Value
Number
Average Value
Number
Average Value
Number
Average Value
LOANS ORIGINATED
15
$146,423
2,497
$249,849
911
$387,981
80
$289,365
10
$14,214,964
716
$212,888
0
$0
APPLICATIONS APPROVED, NOT ACCEPTED
1
$180,460
313
$261,570
174
$243,597
16
$198,829
0
$0
101
$258,131
0
$0
APPLICATIONS DENIED
0
$0
536
$277,094
476
$379,115
59
$226,838
0
$0
212
$228,558
3
$40,893
APPLICATIONS WITHDRAWN
6
$139,848
410
$273,386
252
$393,572
10
$464,715
0
$0
125
$233,878
0
$0
FILES CLOSED FOR INCOMPLETENESS
0
$0
55
$148,827
60
$320,403
3
$103,867
1
$3,106,320
28
$184,455
0
$0
Aggregated Statistics For Year 2005 (Based on 4 full and 6 partial tracts)
A) FHA, FSA/RHS & VA Home Purchase Loans
B) Conventional Home Purchase Loans
C) Refinancings
D) Home Improvement Loans
E) Loans on Dwellings For 5+ Families
F) Non-occupant Loans on < 5 Family Dwellings (A B C & D)
G) Loans On Manufactured Home Dwelling (A B C & D)
Number
Average Value
Number
Average Value
Number
Average Value
Number
Average Value
Number
Average Value
Number
Average Value
Number
Average Value
LOANS ORIGINATED
16
$109,379
2,788
$240,329
1,046
$423,247
79
$265,769
6
$380,273
654
$226,501
2
$27,965
APPLICATIONS APPROVED, NOT ACCEPTED
0
$0
217
$284,419
150
$360,821
12
$190,269
0
$0
60
$343,904
0
$0
APPLICATIONS DENIED
5
$141,642
594
$202,082
338
$389,104
47
$141,985
1
$275,130
181
$262,867
4
$70,238
APPLICATIONS WITHDRAWN
2
$141,620
338
$277,090
251
$416,305
25
$108,244
0
$0
101
$204,123
1
$433,410
FILES CLOSED FOR INCOMPLETENESS
0
$0
52
$265,907
84
$442,572
10
$201,931
1
$532,510
22
$463,850
0
$0
Aggregated Statistics For Year 2004 (Based on 4 full and 6 partial tracts)
A) FHA, FSA/RHS & VA Home Purchase Loans
B) Conventional Home Purchase Loans
C) Refinancings
D) Home Improvement Loans
E) Loans on Dwellings For 5+ Families
F) Non-occupant Loans on < 5 Family Dwellings (A B C & D)
G) Loans On Manufactured Home Dwelling (A B C & D)
Number
Average Value
Number
Average Value
Number
Average Value
Number
Average Value
Number
Average Value
Number
Average Value
Number
Average Value
LOANS ORIGINATED
19
$150,364
1,717
$278,120
1,304
$363,850
43
$371,214
3
$332,420
342
$238,503
0
$0
APPLICATIONS APPROVED, NOT ACCEPTED
0
$0
149
$303,402
144
$304,226
7
$111,631
1
$3,402,160
49
$326,452
3
$11,833
APPLICATIONS DENIED
3
$122,773
310
$267,481
322
$323,024
38
$120,430
0
$0
84
$329,574
0
$0
APPLICATIONS WITHDRAWN
9
$131,696
235
$340,958
217
$308,054
12
$224,419
0
$0
42
$341,257
0
$0
FILES CLOSED FOR INCOMPLETENESS
0
$0
51
$298,436
73
$332,267
4
$155,778
0
$0
8
$710,349
0
$0
Aggregated Statistics For Year 2003 (Based on 4 full and 6 partial tracts)
A) FHA, FSA/RHS & VA Home Purchase Loans
B) Conventional Home Purchase Loans
C) Refinancings
D) Home Improvement Loans
E) Loans on Dwellings For 5+ Families
F) Non-occupant Loans on < 5 Family Dwellings (A B C & D)
Number
Average Value
Number
Average Value
Number
Average Value
Number
Average Value
Number
Average Value
Number
Average Value
LOANS ORIGINATED
29
$126,917
1,489
$297,106
3,526
$312,448
41
$144,430
5
$366,076
399
$213,276
APPLICATIONS APPROVED, NOT ACCEPTED
0
$0
107
$303,548
294
$261,208
10
$52,048
0
$0
53
$275,763
APPLICATIONS DENIED
3
$127,210
168
$309,170
494
$310,911
42
$128,991
0
$0
89
$266,586
APPLICATIONS WITHDRAWN
0
$0
159
$296,528
360
$309,605
2
$291,605
0
$0
48
$162,540
FILES CLOSED FOR INCOMPLETENESS
0
$0
39
$487,424
107
$338,154
2
$299,610
0
$0
8
$224,799
Aggregated Statistics For Year 2002 (Based on 4 full and 6 partial tracts)
A) FHA, FSA/RHS & VA Home Purchase Loans
B) Conventional Home Purchase Loans
C) Refinancings
D) Home Improvement Loans
E) Loans on Dwellings For 5+ Families
F) Non-occupant Loans on < 5 Family Dwellings (A B C & D)
Number
Average Value
Number
Average Value
Number
Average Value
Number
Average Value
Number
Average Value
Number
Average Value
LOANS ORIGINATED
33
$131,438
1,291
$293,852
2,701
$340,031
65
$87,274
3
$690,293
293
$261,245
APPLICATIONS APPROVED, NOT ACCEPTED
1
$201,170
111
$330,987
197
$352,171
7
$194,196
0
$0
25
$243,800
APPLICATIONS DENIED
6
$117,977
143
$343,906
327
$344,872
34
$60,718
1
$591,680
56
$234,923
APPLICATIONS WITHDRAWN
5
$141,678
134
$309,462
305
$444,599
18
$194,310
0
$0
39
$166,649
FILES CLOSED FOR INCOMPLETENESS
1
$238,150
41
$430,219
86
$331,402
2
$32,965
0
$0
8
$393,664
Aggregated Statistics For Year 2001 (Based on 4 full and 6 partial tracts)
A) FHA, FSA/RHS & VA Home Purchase Loans
B) Conventional Home Purchase Loans
C) Refinancings
D) Home Improvement Loans
E) Loans on Dwellings For 5+ Families
F) Non-occupant Loans on < 5 Family Dwellings (A B C & D)
Number
Average Value
Number
Average Value
Number
Average Value
Number
Average Value
Number
Average Value
Number
Average Value
LOANS ORIGINATED
46
$123,550
1,686
$254,728
1,925
$333,560
75
$107,772
5
$34,439,498
308
$200,294
APPLICATIONS APPROVED, NOT ACCEPTED
3
$196,097
107
$333,566
135
$288,086
34
$82,709
1
$1,035,440
24
$173,615
APPLICATIONS DENIED
9
$130,170
138
$336,369
271
$284,484
52
$68,458
1
$32,542,400
40
$195,975
APPLICATIONS WITHDRAWN
5
$300,098
122
$325,534
238
$291,062
12
$76,870
1
$21,046,060
39
$195,572
FILES CLOSED FOR INCOMPLETENESS
0
$0
34
$409,754
83
$227,772
3
$70,757
0
$0
32
$241,931
Aggregated Statistics For Year 2000 (Based on 4 full and 6 partial tracts)
A) FHA, FSA/RHS & VA Home Purchase Loans
B) Conventional Home Purchase Loans
C) Refinancings
D) Home Improvement Loans
E) Loans on Dwellings For 5+ Families
F) Non-occupant Loans on < 5 Family Dwellings (A B C & D)
Number
Average Value
Number
Average Value
Number
Average Value
Number
Average Value
Number
Average Value
Number
Average Value
LOANS ORIGINATED
42
$133,814
1,652
$262,430
396
$309,563
91
$92,187
3
$4,622,500
163
$211,501
APPLICATIONS APPROVED, NOT ACCEPTED
1
$115,420
109
$251,816
42
$232,830
39
$72,572
0
$0
9
$118,622
APPLICATIONS DENIED
10
$120,241
158
$256,041
132
$218,848
36
$83,493
0
$0
33
$291,594
APPLICATIONS WITHDRAWN
4
$130,852
151
$279,005
116
$224,815
25
$77,182
1
$554,700
25
$156,902
FILES CLOSED FOR INCOMPLETENESS
0
$0
24
$221,767
14
$274,838
4
$151,602
0
$0
4
$110,855
Aggregated Statistics For Year 1999 (Based on 2 full and 3 partial tracts)
A) FHA, FSA/RHS & VA Home Purchase Loans
B) Conventional Home Purchase Loans
C) Refinancings
D) Home Improvement Loans
E) Loans on Dwellings For 5+ Families
F) Non-occupant Loans on < 5 Family Dwellings (A B C & D)
2002 - 2018 National Fire Incident Reporting System (NFIRS) incidents
According to the data from the years 2002 - 2018 the average number of fire incidents per year is 27. The highest number of fire incidents - 56 took place in 2002, and the least - 0 in 2004. The data has a declining trend.
When looking into fire subcategories, the most incidents belonged to: Structure Fires (50.2%), and Outside Fires (27.4%).
Fire incident types reported to NFIRS in Zip Code 30305
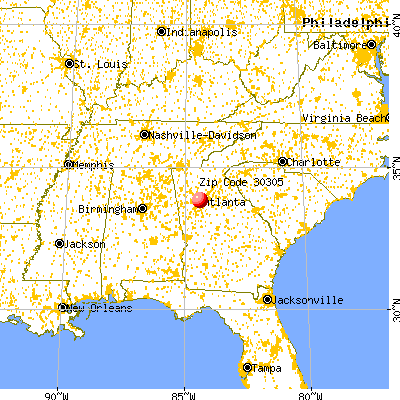


 Nearest zip codes: 30326, 30324, 30309, 30327, 30363, 30342.
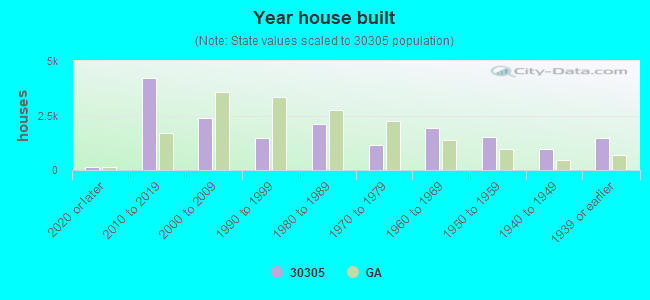


 According to the data from the years 2002 - 2018 the average number of fire incidents per year is 27. The highest number of fire incidents - 56 took place in 2002, and the least - 0 in 2004. The data has a declining trend.
 When looking into fire subcategories, the most incidents belonged to: Structure Fires (50.2%), and Outside Fires (27.4%).