Estimated zip code population in 2022: 33,743 Zip code population in 2010: 29,879 Zip code population in 2000: 25,807
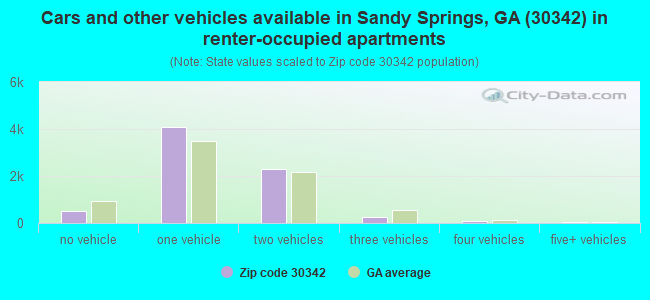
Houses and condos: 16,208 Renter-occupied apartments: 7,293
% of renters here:
48%
State:
34%
March 2022 cost of living index in zip code 30342: 107.2 (more than average, U.S. average is 100)
Land area: 8.9 sq. mi. Water area: 0.1 sq. mi.
Population density: 3,773 people per square mile
(average).
OSM Map
General Map
Google Map
MSN Map
OSM Map
General Map
Google Map
MSN Map
OSM Map
General Map
Google Map
MSN Map
OSM Map
General Map
Google Map
MSN Map
Please wait while loading the map...
Real estate property taxes paid for housing units in 2022:
This zip code:
0.9% ($8,362)
Georgia:
0.7% ($2,160)
Median real estate property taxes paid for housing units with mortgages in 2022: $8,799 (0.9%) Median real estate property taxes paid for housing units with no mortgage in 2022: $6,909 (0.8%)
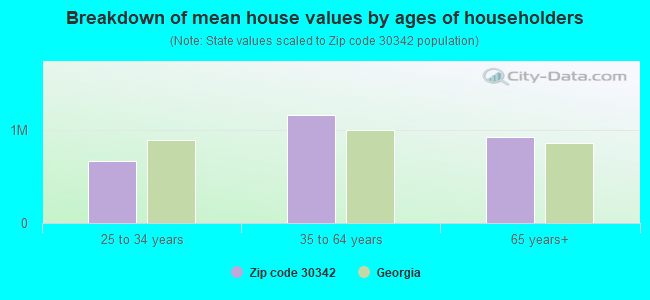
Estimated median house/condo value in 2022: $933,442
30342:
$933,442
Georgia:
$297,400
According to our research of Georgia and other state lists, there was 1 registered sex offender living in 30342 zip code as of April 27, 2024. The ratio of all residents to sex offenders in zip code 30342 is 30,859 to 1. The ratio of registered sex offenders to all residents in this zip code is much lower than the state average.
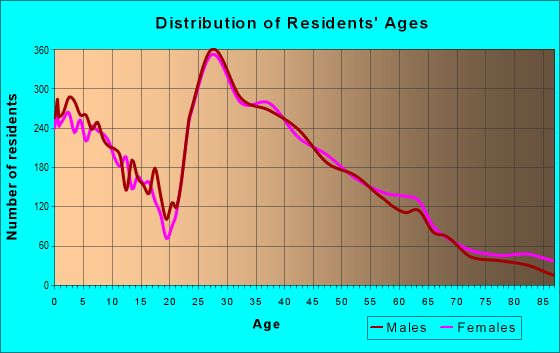
Median resident age:
This zip code:
33.7 years
Georgia median age:
37.6 years
Average household size:
This zip code:
2.2 people
Georgia:
2.6 people
Averages for the 2020 tax year for zip code 30342, filed in 2021:
Average Adjusted Gross Income (AGI) in 2020: $232,612 (Individual Income Tax Returns)
Here:
$232,612
State:
$70,847
Salary/wage: $155,228 (reported on 81.6% of returns)
Here:
$155,228
State:
$59,126
(% of AGI for various income ranges: 1376.8% for AGIs below $25k, 4164.4% for AGIs $25k-50k, 7527.3% for AGIs $50k-75k, 11273.4% for AGIs $75k-100k, 21999.4% for AGIs $100k-200k, 178207.2% for AGIs over 200k)
Taxable interest for individuals: $5,289 (reported on 39.1% of returns)
This zip code:
$5,289
Georgia:
$2,011
(% of AGI for various income ranges: 18.8% for AGIs below $25k, 23.3% for AGIs $25k-50k, 70.6% for AGIs $50k-75k, 78.9% for AGIs $75k-100k, 268.9% for AGIs $100k-200k, 3328.4% for AGIs over 200k)
Ordinary dividends: $21,702 (reported on 39.7% of returns)
Here:
$21,702
State:
$8,996
(% of AGI for various income ranges: 92.8% for AGIs below $25k, 85.0% for AGIs $25k-50k, 219.9% for AGIs $50k-75k, 449.3% for AGIs $75k-100k, 1206.9% for AGIs $100k-200k, 13761.0% for AGIs over 200k)
Net capital gain/loss in AGI: +$119,097 (reported on 38.2% of returns)
Here:
+$119,097
State:
+$28,402
(% of AGI for various income ranges: 40.6% for AGIs below $25k, 64.8% for AGIs $25k-50k, 192.5% for AGIs $50k-75k, 376.4% for AGIs $75k-100k, 1303.7% for AGIs $100k-200k, 84680.1% for AGIs over 200k)
Profit/loss from business: +$25,423 (reported on 25.7% of returns)
Here:
+$25,423
State:
+$6,707
(% of AGI for various income ranges: 247.5% for AGIs below $25k, 191.5% for AGIs $25k-50k, 303.3% for AGIs $50k-75k, 484.7% for AGIs $75k-100k, 1322.1% for AGIs $100k-200k, 8746.1% for AGIs over 200k)
Taxable individual retirement arrangement distribution: $38,115 (reported on 7.5% of returns)
30342:
$38,115
Georgia:
$20,525
(% of AGI for various income ranges: 45.7% for AGIs below $25k, 70.7% for AGIs $25k-50k, 140.1% for AGIs $50k-75k, 333.6% for AGIs $75k-100k, 966.9% for AGIs $100k-200k, 3432.9% for AGIs over 200k)
Self-employed (Keogh) retirement plans: $34,787 (reported on 3.0% of returns)
30342:
$34,787
Georgia:
$27,751
(% of AGI for various income ranges: 30.7% for AGIs $50k-75k, 96.0% for AGIs $100k-200k, 1829.8% for AGIs over 200k)
Total itemized deductions: $53,222 (reported on 26.7% of returns)
Here:
$53,222
State:
$34,001
(% of AGI for various income ranges: 117.6% for AGIs below $25k, 227.4% for AGIs $25k-50k, 486.5% for AGIs $50k-75k, 929.5% for AGIs $75k-100k, 2524.8% for AGIs $100k-200k, 21568.0% for AGIs over 200k)
Charity contributions: $26,530 (reported on 23.4% of returns)
Here:
$26,530
State:
$14,164
(% of AGI for various income ranges: 9.7% for AGIs below $25k, 49.3% for AGIs $25k-50k, 88.5% for AGIs $50k-75k, 149.2% for AGIs $75k-100k, 515.4% for AGIs $100k-200k, 10830.8% for AGIs over 200k)
Taxes paid: $9,213 (reported on 26.5% of returns)
30342:
$9,213
State:
$7,540
(% of AGI for various income ranges: 21.9% for AGIs below $25k, 44.7% for AGIs $25k-50k, 113.3% for AGIs $50k-75k, 258.5% for AGIs $75k-100k, 770.5% for AGIs $100k-200k, 3133.1% for AGIs over 200k)
Earned income credit: $2,140 (reported on 8.1% of returns)
Here:
$2,140
State:
$2,530
(% of AGI for various income ranges: 80.7% for AGIs below $25k, 36.4% for AGIs $25k-50k)
Percentage of individuals using paid preparers for their 2020 taxes: 92.4%
Here:
92%
State:
93%
(% for various income ranges: 88.0% for AGIs below $25k, 92.2% for AGIs $25k-50k, 94.6% for AGIs $50k-75k, 94.3% for AGIs $75k-100k, 93.4% for AGIs $100k-200k, 95.2% for AGIs over 200k)
Averages for the 2012 tax year for zip code 30342, filed in 2013:
Average Adjusted Gross Income (AGI) in 2012: $156,339 (Individual Income Tax Returns)
Here:
$156,339
State:
$56,131
Salary/wage: $112,753 (reported on 83.4% of returns)
Here:
$112,753
State:
$47,942
(% of AGI for various income ranges: 81.3% for AGIs below $25k, 88.1% for AGIs $25k-50k, 80.6% for AGIs $50k-75k, 74.5% for AGIs $75k-100k, 70.0% for AGIs $100k-200k, 54.1% for AGIs over 200k)
Taxable interest for individuals: $4,462 (reported on 37.9% of returns)
This zip code:
$4,462
Georgia:
$1,706
(% of AGI for various income ranges: 1.0% for AGIs below $25k, 0.7% for AGIs $25k-50k, 1.2% for AGIs $50k-75k, 0.9% for AGIs $75k-100k, 1.3% for AGIs $100k-200k, 1.1% for AGIs over 200k)
Ordinary dividends: $25,097 (reported on 34.3% of returns)
Here:
$25,097
State:
$7,265
(% of AGI for various income ranges: 3.0% for AGIs below $25k, 1.9% for AGIs $25k-50k, 3.2% for AGIs $50k-75k, 3.8% for AGIs $75k-100k, 4.4% for AGIs $100k-200k, 6.2% for AGIs over 200k)
Net capital gain/loss in AGI: +$59,557 (reported on 31.3% of returns)
Here:
+$59,557
State:
+$16,323
(% of AGI for various income ranges: 0.3% for AGIs below $25k, 0.4% for AGIs $25k-50k, 1.3% for AGIs $50k-75k, 1.1% for AGIs $75k-100k, 2.9% for AGIs $100k-200k, 15.6% for AGIs over 200k)
Profit/loss from business: +$25,712 (reported on 20.8% of returns)
Here:
+$25,712
State:
+$7,583
(% of AGI for various income ranges: 9.8% for AGIs below $25k, 3.1% for AGIs $25k-50k, 2.8% for AGIs $50k-75k, 4.4% for AGIs $75k-100k, 4.4% for AGIs $100k-200k, 3.0% for AGIs over 200k)
Taxable individual retirement arrangement distribution: $32,409 (reported on 9.6% of returns)
30342:
$32,409
Georgia:
$17,199
(% of AGI for various income ranges: 2.1% for AGIs below $25k, 2.1% for AGIs $25k-50k, 2.8% for AGIs $50k-75k, 4.1% for AGIs $75k-100k, 4.4% for AGIs $100k-200k, 1.5% for AGIs over 200k)
Self-employment retirement plans: $30,770 (reported on 2.9% of returns)
30342:
$30,770
Georgia:
$23,277
(% of AGI for various income ranges: 0.5% for AGIs $50k-75k, 0.6% for AGIs $100k-200k, 0.7% for AGIs over 200k)
Total itemized deductions: $54,855 (17% of AGI, reported on 43.5% of returns)
Here:
$54,855
State:
$23,886
Here:
17.2% of AGI
State:
21.5% of AGI
(% of AGI for various income ranges: 11.0% for AGIs below $25k, 11.3% for AGIs $25k-50k, 16.0% for AGIs $50k-75k, 17.5% for AGIs $75k-100k, 19.8% for AGIs $100k-200k, 14.9% for AGIs over 200k)
Charity contributions: $16,326 (reported on 38.7% of returns)
Here:
$16,326
State:
$5,507
(% of AGI for various income ranges: 0.8% for AGIs below $25k, 1.3% for AGIs $25k-50k, 1.8% for AGIs $50k-75k, 2.3% for AGIs $75k-100k, 2.7% for AGIs $100k-200k, 4.8% for AGIs over 200k)
Taxes paid: $22,146 (reported on 43.4% of returns)
30342:
$22,146
State:
$7,838
(% of AGI for various income ranges: 2.0% for AGIs below $25k, 2.6% for AGIs $25k-50k, 4.5% for AGIs $50k-75k, 5.9% for AGIs $75k-100k, 7.8% for AGIs $100k-200k, 6.4% for AGIs over 200k)
Earned income credit: $2,028 (reported on 9.0% of returns)
Here:
$2,028
State:
$2,589
(% of AGI for various income ranges: 3.7% for AGIs below $25k, 0.3% for AGIs $25k-50k)
Percentage of individuals using paid preparers for their 2012 taxes: 57.1%
Here:
57%
State:
55%
(% for various income ranges: 55.3% for AGIs below $25k, 47.7% for AGIs $25k-50k, 47.6% for AGIs $50k-75k, 55.8% for AGIs $75k-100k, 62.1% for AGIs $100k-200k, 77.2% for AGIs over 200k)
Averages for the 2004 tax year for zip code 30342, filed in 2005:
Average Adjusted Gross Income (AGI) in 2004: $109,859 (Individual Income Tax Returns)
Here:
$109,859
State:
$47,553
Salary/wage: $85,969 (reported on 80.8% of returns)
Here:
$85,969
State:
$42,178
(% of AGI for various income ranges: 83.8% for AGIs $10k-25k, 85.6% for AGIs $25k-50k, 78.0% for AGIs $50k-75k, 69.7% for AGIs $75k-100k, 57.6% for AGIs over 100k)
Taxable interest for individuals: $3,848 (reported on 49.9% of returns)
This zip code:
$3,848
Georgia:
$1,772
(% of AGI for various income ranges: 2.5% for AGIs $10k-25k, 1.6% for AGIs $25k-50k, 1.7% for AGIs $50k-75k, 2.3% for AGIs $75k-100k, 1.6% for AGIs over 100k)
Taxable dividends: $12,990 (reported on 43.5% of returns)
Here:
$12,990
State:
$4,283
(% of AGI for various income ranges: 3.6% for AGIs $10k-25k, 2.2% for AGIs $25k-50k, 3.2% for AGIs $50k-75k, 4.3% for AGIs $75k-100k, 5.5% for AGIs over 100k)
Net capital gain/loss: +$30,430 (reported on 38.7% of returns)
Here:
+$30,430
State:
+$16,461
(% of AGI for various income ranges: 0.6% for AGIs $10k-25k, 0.7% for AGIs $25k-50k, 1.5% for AGIs $50k-75k, 2.9% for AGIs $75k-100k, 13.2% for AGIs over 100k)
Profit/loss from business: +$25,500 (reported on 19.0% of returns)
Here:
+$25,500
State:
+$8,201
(% of AGI for various income ranges: 5.3% for AGIs $10k-25k, 4.1% for AGIs $25k-50k, 5.5% for AGIs $50k-75k, 5.2% for AGIs $75k-100k, 4.2% for AGIs over 100k)
IRA payment deduction: $3,339 (reported on 2.7% of returns)
30342:
$3,339
Georgia:
$2,969
(% of AGI for various income ranges: 0.2% for AGIs $10k-25k, 0.2% for AGIs $25k-50k, 0.1% for AGIs $50k-75k, 0.1% for AGIs $75k-100k, 0.1% for AGIs over 100k)
Self-employed pension: $22,015 (reported on 3.7% of returns)
Here:
$22,015
Georgia:
$16,203
(% of AGI for various income ranges: 0.1% for AGIs $10k-25k, 0.1% for AGIs $25k-50k, 0.4% for AGIs $50k-75k, 0.4% for AGIs $75k-100k, 0.9% for AGIs over 100k)
Total itemized deductions: $34,954 (18% of AGI, reported on 49.3% of returns)
Here:
$34,954
State:
$19,944
Here:
17.6% of AGI
State:
22.6% of AGI
(% of AGI for various income ranges: 17.0% for AGIs $10k-25k, 15.4% for AGIs $25k-50k, 18.2% for AGIs $50k-75k, 22.4% for AGIs $75k-100k, 14.8% for AGIs over 100k)
Charity contributions deductions: $7,437 (4% of AGI, reported on 44.9% of returns)
Here:
$7,437
State:
$4,354
Here:
3.6% of AGI
State:
4.7% of AGI
(% of AGI for various income ranges: 1.9% for AGIs $10k-25k, 1.9% for AGIs $25k-50k, 2.4% for AGIs $50k-75k, 3.0% for AGIs $75k-100k, 3.2% for AGIs over 100k)
Total tax: $26,550 (reported on 81.2% of returns)
30342:
$26,550
State:
$8,223
(% of AGI for various income ranges: 4.6% for AGIs $10k-25k, 8.9% for AGIs $25k-50k, 12.2% for AGIs $50k-75k, 12.4% for AGIs $75k-100k, 22.1% for AGIs over 100k)
Earned income credit: $1,505 (reported on 7.0% of returns)
Here:
$1,505
State:
$1,986
Percentage of individuals using paid preparers for their 2004 taxes: 59.2%
Here:
59%
State:
62%
(% for various income ranges: 55.5% for AGIs below $10k, 58.2% for AGIs $10k-25k, 48.5% for AGIs $25k-50k, 54.6% for AGIs $50k-75k, 58.4% for AGIs $75k-100k, 74.2% for AGIs over 100k)
Likely homosexual households (counted as self-reported same-sex unmarried-partner households)
Lesbian couples: 0.0% of all households
Gay men: 0.3% of all households
Household received Food Stamps/SNAP in the past 12 months: 689 Household did not receive Food Stamps/SNAP in the past 12 months: 14,607
Women who had a birth in the past 12 months: 252 (247 now married, 5 unmarried) Women who did not have a birth in the past 12 months: 10,804 (4,298 now married, 6,506 unmarried)
Housing units in zip code 30342 with a mortgage: 5,901 (962 second mortgage, 87 home equity loan, 831 both second mortgage and home equity loan) Houses without a mortgage: 69
Median monthly owner costs for units with a mortgage: $3,514 Median monthly owner costs for units without a mortgage: $1,044
Residents with income below the poverty level in 2022:
This zip code:
6.2%
Whole state:
12.7%
Residents with income below 50% of the poverty level in 2022:
This zip code:
3.1%
Whole state:
6.3%
Median number of rooms in houses and condos:
Here:
8.1
State:
6.8
Median number of rooms in apartments:
Here:
3.7
State:
4.6
Notable locations in this zip code not listed on our city pages
Notable locations in zip code 30342: Sandy Springs Fire / Rescue Department Station 4 (A), Atlanta Fire / Rescue Station 39 (B). Display/hide their locations on the map
Shopping Centers: Dover Square Shopping Center (1), Roswell-Powers Ferry Shopping Center (2), Chastain Square Shopping Center (3), Fountain Oaks Shopping Center (4), The Prado Shopping Center (5). Display/hide their locations on the map
Churches in zip code 30342 include: Belle Isle Church (A), Beth Tefillah Congregation (B), Santell Church (C), Sardis Church (D). Display/hide their locations on the map
5,062 married couples with children.
1,761 single-parent households (204 men, 1,557 women).
80.4% of residents of 30342 zip code speak English at home.
13.7% of residents speak Spanish at home (51% very well, 25% well, 18% not well, 6% not at all).
2.5% of residents speak other Indo-European language at home (75% very well, 7% well, 18% not well).
2.3% of residents speak Asian or Pacific Island language at home (57% very well, 40% well, 2% not well).
0.7% of residents speak other language at home (100% very well).
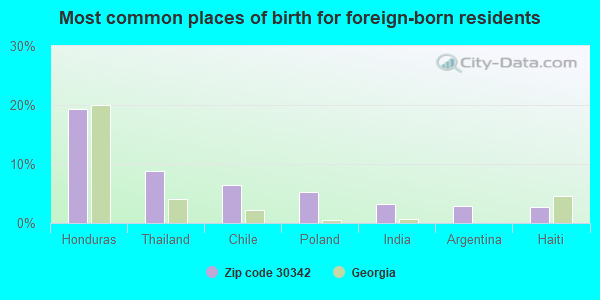
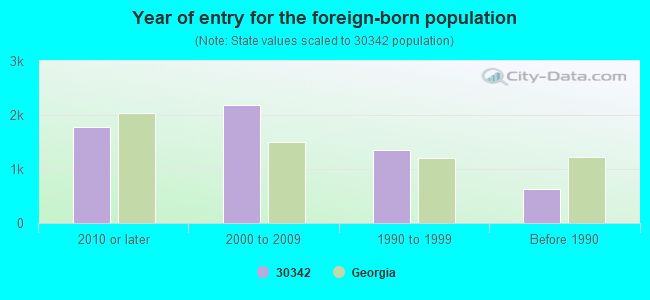
Foreign born population: 5,046 (15.0%) (54.1% of them are naturalized citizens)
Major facilities with environmental interests located in this zip code:
NORTHSIDE HOSPITAL (1000 JOHNSON FERRY ROAD in ATLANTA, GA)
AIR SYNTHETIC MINOR (AIRS/AFS) STATE MASTER (Georgia's Geographic Environmental Information) - UST-1, UNDERGROUND STORAGE TANK PROGRAM, UST-2, UST-4, UST-3, Large Quantity Generators, more that 1000 kg of hazardous waste/month (Resource Conservation and Recovery Act (tracking hazardous waste)) Business SIC classification: GENERAL MEDICAL AND SURGICAL HOSPITALS Organizations: NORTH FULTON CO HOSP AUTH (CONTACT/OWNER)
, US ENV (INSTALLER)
LANE COMPANY (5555 GLENRIDGE CONNECTOR, SUITE 700 in ATLANTA, GA)
ENFORCEMENT/COMPLIANCE ACTIVITY (Integrated Compliance Information System) - ICIS-HQ-2003-5075, FORMAL ENFORCEMENT ACTION (Integrated Compliance Information System) - ICIS-HQ-2003-5075, FORMAL ENFORCEMENT ACTION
BP OIL COMPANY (4499 ROSWELL ROAD in ATLANTA, GA)
STATE MASTER (Georgia's Geographic Environmental Information) - UST-2, UNDERGROUND STORAGE TANK PROGRAM, UST-4, UST-5, UST-1, UST-3, Conditionally Exempt Small Quantity Generators, less than 100 kg/month of hazardous waste (Resource Conservation and Recovery Act (tracking hazardous waste)) - notification Organizations: PANGEAN CMD ASSOCIATES (CONTACT/AGENT)
, BP PRODUCTS NORTH AMERICA INC (CONTACT/OPERATOR)
, BP OIL CO. (CONTACT/OWNER)
Alternative names: BP #24107, BP #24107
NORTH METRO PSYCHOEDUCATIONAL PROGRAM (4191 NORTHSIDE DRIVE, N. W. in ATLANTA, GA)
(National Center for Education Statistics) - STATE ID-6414 Organizations: METRO RESA (SCHOOL DISTRICT)
QUICK AS A WINK (4400 ROSWELL ROAD in ATLANTA, GA)
(Resource Conservation and Recovery Act (tracking hazardous waste)) Organizations: OPERNAME (CONTACT/OPERATOR)
, WOODARD PATSY S (CONTACT/OWNER)
CHILDREN'S HEALTHCARE OF ATL @SCOT RITS (1001 JOHNSON FERRY RD NE in ATLANTA, GA)
Small Quantity Generators, between 100 kg and 1000 kg of hazardous waste/month (Resource Conservation and Recovery Act (tracking hazardous waste)) Organizations: OPERNAME (CONTACT/OPERATOR)
, CHILDRENS HEALTHCARE OF ATL (CONTACT/OPERATOR)
Alternative names: CHILDRENS HEALTHCARE OF ATLANTA, SCOTTISH RITE CHILDRENS HOSPITAL
PHILLIPS PETROLEUM CO SS#13066 (3669 POWERS FERRY RD in ATLANTA, GA)
(Resource Conservation and Recovery Act (tracking hazardous waste)) Organizations: PHILLIPS PETROLEUM COMPANY (CONTACT/OWNER)
JIFFY LUBE STORE #614 (4955 ROSWELL ROAD AND BELL ISLE in ATLANTA, GA)
(Resource Conservation and Recovery Act (tracking hazardous waste)) Organizations: JIFFY LUBE INTERNATIONAL INC (CONTACT/OWNER)
PRIME CLEANERS (4279 ROSWELL RD NE #209 in ATLANTA, GA)
Small Quantity Generators, between 100 kg and 1000 kg of hazardous waste/month (Resource Conservation and Recovery Act (tracking hazardous waste)) - notification Organizations: OPERNAME (CONTACT/OPERATOR)
, ALMEHDI CORP (CONTACT/OWNER)
FASHION CARE FOUNTAIN OAKS (4920 ROSWELL RD in ATLANTA, GA)
Small Quantity Generators, between 100 kg and 1000 kg of hazardous waste/month (Resource Conservation and Recovery Act (tracking hazardous waste)) - notification Organizations: OPERNAME (CONTACT/OPERATOR)
, FASHION CARE INC (CONTACT/OWNER)
KING SPRINGS CLEANERS (164 W WIEUCA RD NW in ATLANTA, GA)
Small Quantity Generators, between 100 kg and 1000 kg of hazardous waste/month (Resource Conservation and Recovery Act (tracking hazardous waste)) - notification Organizations: OPERNAME (CONTACT/OPERATOR)
, ORTIZ RODNEY (CONTACT/OWNER)
MARTIN MOTORS OF ATLANTA INC (4975 ROSWELL RD NE in ATLANTA, GA)
Small Quantity Generators, between 100 kg and 1000 kg of hazardous waste/month (Resource Conservation and Recovery Act (tracking hazardous waste)) - notification Organizations: OPERNAME (CONTACT/OPERATOR)
BUCKHEAD CLEANERS (3714 ROSWELL RD in ATLANTA, GA)
Conditionally Exempt Small Quantity Generators, less than 100 kg/month of hazardous waste (Resource Conservation and Recovery Act (tracking hazardous waste)) - notification Organizations: ALLEN S WOO (CONTACT/OWNER)
Housing units lacking complete plumbing facilities: 0.1% Housing units lacking complete kitchen facilities: 0.5%
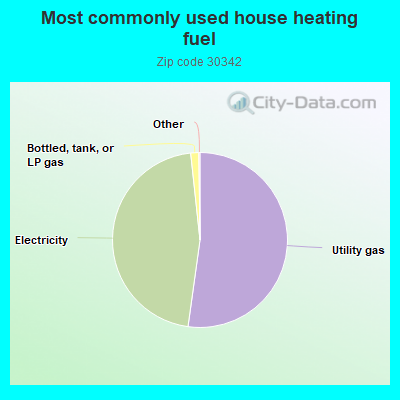
52.2%Utility gas
46.1%Electricity
1.5%Bottled, tank, or LP gas
Population in 1990: 19,057. Population change in the 1990s: +6,750 (+35.4%).
Place of birth for U.S.-born residents:
This state: 11,403
Northeast: 3,991
Midwest: 3,651
South: 6,864
West: 2,119
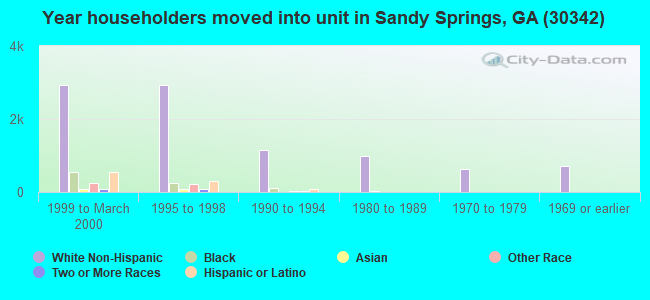
41% of the 30342 zip code residents lived in the same house 5 years ago. Out of people who lived in different houses, 38% lived in this county. Out of people who lived in different counties, 50% lived in Georgia.
81% of the 30342 zip code residents lived in the same house 1 year ago. Out of people who lived in different houses, 44% moved from this county. Out of people who lived in different houses, 25% moved from different county within same state. Out of people who lived in different houses, 28% moved from different state. Out of people who lived in different houses, 2% moved from abroad.
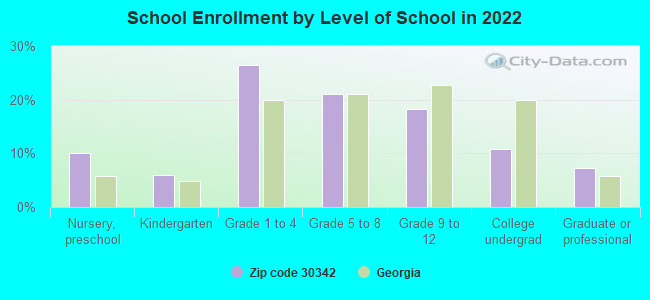
Private vs. public school enrollment:
Students in private schools in grades 1 to 8 (elementary and middle school): 1,920
Here:
49.3%
Georgia:
12.1%
Students in private schools in grades 9 to 12 (high school): 583
Here:
40.7%
Georgia:
10.8%
Students in private undergraduate colleges: 216
Here:
25.4%
Georgia:
17.1%
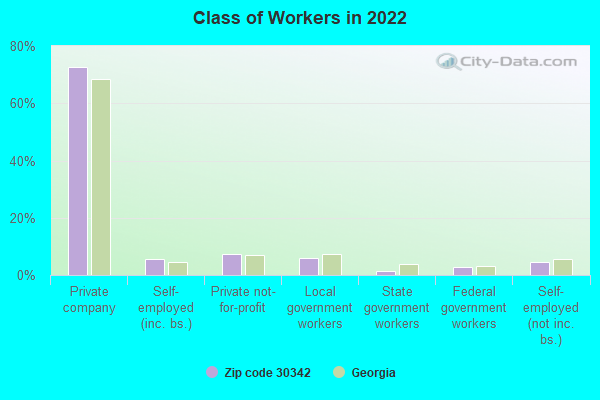
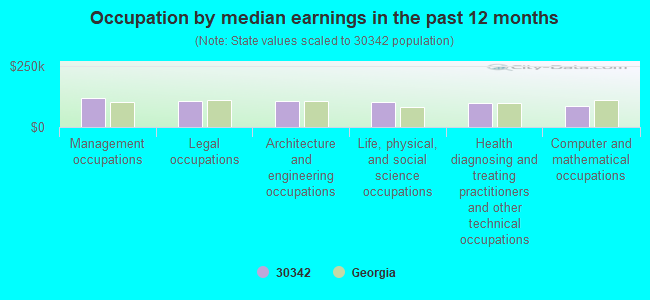
Occupation by median earnings in the past 12 months ($)
120,904Management occupations
106,461Legal occupations
105,395Architecture and engineering occupations
101,337Life, physical, and social science occupations
97,217Health diagnosing and treating practitioners and other technical occupations
85,839Computer and mathematical occupations
Companies with federal contracts located in this zip code (ATLANTA, GA):
SOUTHERN COMMUNICATIONS SERVIC (5555 GLENRIDGE CONNECTOR N) : $5,215,214 in 131 contractsfrom 1999 to 2006
Contracts for Telephone and Telegraph Equipment, Radio and Television Communication Equipment, Except Airborne, Lease or Rental of Equipment -- Communication, Detection, and Coherent Radiation Equipment, Other Utilities, and moreby U.S. Army Corps of Engineers - civil program financing only, Army, Air Force, Internal Revenue Service, and others Signed by year:2000: $365,430; 2001: $777,889; 2002: $666,052; 2003: $623,030; 2004: $1,664,871; 2005: $1,239,176; 2006: -$229,234.
Biggest contracts:
$464,948 with U.S. Army Corps of Engineers - civil program financing only for Telephone and Telegraph Equipment. Signed on 2005-05-25. Completion date: 2006-04-15.
$464,948 with Army for Telephone and Telegraph Equipment. Signed on 2005-05-25. Completion date: 2006-04-15.
$404,948 with U.S. Army Corps of Engineers - civil program financing only for Radio and Television Communication Equipment, Except Airborne. Signed on 2004-04-20. Completion date: 2004-04-30.
$404,948 with Army for Radio and Television Communication Equipment, Except Airborne. Signed on 2004-04-20. Completion date: 2004-04-30.
SOUTHERN CTHDIC PROTECTION CO (1100 JOHNSON FERRY RD , NE; small business) : $1,002,291 in 25 contractsfrom 2000 to 2004
Contracts for Fueling and Other Petroleum Services - Excluding Storage, Maintenance, Repair or Alteration of Real Property -- Other Non-Building Facilities, Construction of Structures and Facilities -- Other Utilities by Navy Signed by year:2000: $471,005; 2001: $507,899; 2002: -$10,683; 2003: $9,070; 2004: $25,000; 2005: $0; 2006: $0.
Biggest contracts:
$239,785 with Navy for Fueling and Other Petroleum Services - Excluding Storage. Taking place in FL. Signed on 2000-05-18. Completion date: 2000-12-12.
$232,690 with Navy for Fueling and Other Petroleum Services - Excluding Storage. Taking place in AR. Signed on 2000-07-03. Completion date: 2000-11-17.
$178,865 with Navy for Maintenance, Repair or Alteration of Real Property -- Other Non-Building Facilities. Taking place in SC. Signed on 2001-06-01. Completion date: 2002-02-13.
$93,739 with Navy for Maintenance, Repair or Alteration of Real Property -- Other Non-Building Facilities. Signed on 2001-09-27. Completion date: 2002-04-10.
LAROCHE INDUSTRIES INC (1100 JOHNSON FERRY RD NE) : $488,900 in 4 contractsfrom 2000 to 2004
$215,000 with Tennessee Valley Authority for Architect - Engineer Services (including landscaping, interior layout, and designing). Taking place in AL. Signed on 2000-04-15. Completion date: 2000-12-15.
$190,000 with Tennessee Valley Authority for Storage Tanks. Taking place in AL. Signed on 2000-03-15. Completion date: 2000-12-15.
$83,000, same as above.Signed on 2000-02-15. Completion date: 2000-12-15.
$900 with Department of Defense for Chemicals. Signed on 2004-12-15. Completion date: 2004-12-23.
NORIT AMERICAS INC (5775 PEACHTREE DUNWOODY RD; small business) : $60,800 in 4 contractsfrom 2002 to 2005
$15,400 with Army for Chemicals. Signed on 2003-02-24. Completion date: 2003-03-23.
$15,400, same as above.Signed on 2002-07-16. Completion date: 2002-08-15.
$15,400 with Army for Chemicals. Taking place in TX. Signed on 2005-04-12. Completion date: 2005-04-18.
$14,600, same as above.Signed on 2004-03-08. Completion date: 2004-03-22.
CRAWFORD & COMPANY (5620 GLENRIDGE DR NE) : $32,000 in 2 contractsfrom 2002 to 2003
$27,000 with Department of Veterans Affairs for Evaluation and Screening. Taking place in HI. Signed on 2002-09-15. Completion date: 2006-09-15.
$5,000 with Army for Other Professional Services. Taking place in MD. Signed on 2003-09-25. Completion date: 2003-09-26.
HAVERTY FURNITURE COMPANIES, I (780 JOHNSON FERRY RD NE #) : $30,616 in 2 contractsfrom 2003 to 2006
$26,389 with Air Force for Office Furniture. Taking place in KS. Signed on 2003-04-10. Completion date: 2003-04-18.
$4,227 with Air Force for Office Furniture. Signed on 2006-03-27. Completion date: 2006-04-06.
JAMES WILLIAMS & ASSOCIATES, I (165 WEST WIEUCA RD, SUITE; small business)
$29,992 with Army for Maintenance, Repair or Alteration of Real Property -- Hospitals and Infirmaries. Signed on 2002-09-25. Completion date: 2003-01-02.
BURT COOPER (91 BLACKLAND; small business) : $13,000 in 4 contractsfrom 1999 to 2001
$4,000 with Forest Service (disused code: now 12C2) for Lease or Rental of Facilities -- Other Warehouse Buildings. Taking place in CA. Signed on 2001-10-15. Completion date: 2002-08-15.
$4,000, same as above.Signed on 2000-10-15. Completion date: 2001-09-15.
$4,000, same as above.Signed on 1999-10-15. Completion date: 2000-08-15.
$1,000, same as above.Signed on 2000-09-15. Completion date: 2000-09-15.
Top industries in this zip code by the number of employees in 2005:
Health Care and Social Assistance: General Medical and Surgical Hospitals (over 1000 employees: 3 establishments)
Health Care and Social Assistance: Offices of Physicians (except Mental Health Specialists) (100-249: 3, 50-99: 16, 20-49: 34, 10-19: 40, 5-9: 43, 1-4: 82)
2002 - 2018 National Fire Incident Reporting System (NFIRS) incidents
According to the data from the years 2002 - 2018 the average number of fire incidents per year is 25. The highest number of fires - 57 took place in 2011, and the least - 0 in 2005. The data has a rising trend.
When looking into fire subcategories, the most incidents belonged to: Structure Fires (41.3%), and Outside Fires (31.9%).
Fire incident types reported to NFIRS in Zip Code 30342
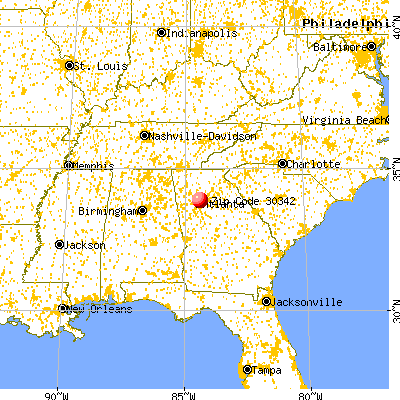


 Nearest zip codes: 30326, 30319, 30327, 30305, 30328, 30346.
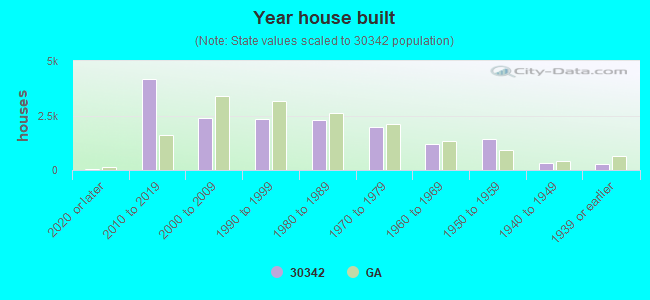


 According to the data from the years 2002 - 2018 the average number of fire incidents per year is 25. The highest number of fires - 57 took place in 2011, and the least - 0 in 2005. The data has a rising trend.
 When looking into fire subcategories, the most incidents belonged to: Structure Fires (41.3%), and Outside Fires (31.9%).