Estimated zip code population in 2022: 2,775 Zip code population in 2010: 2,766 Zip code population in 2000: 2,470
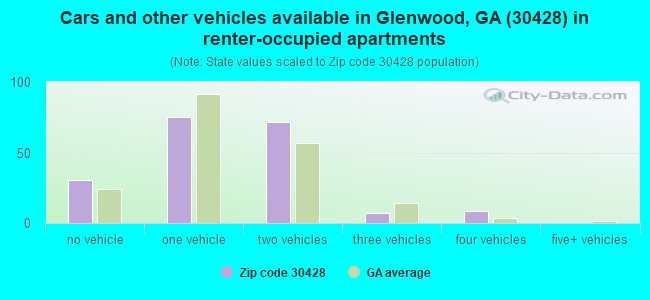
Houses and condos: 991 Renter-occupied apartments: 192
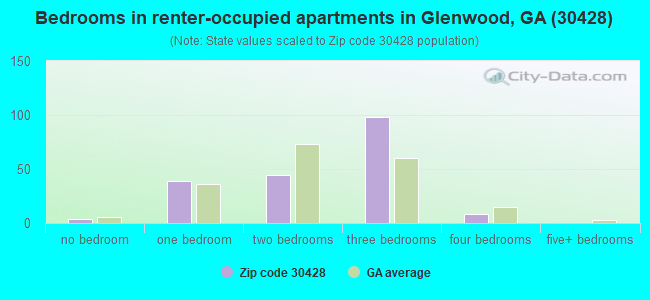
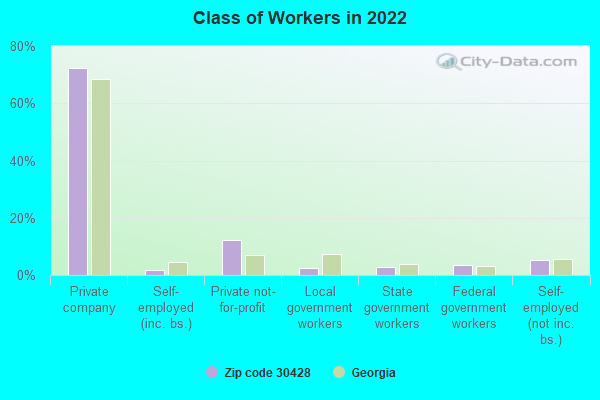
% of renters here:
36%
State:
34%
March 2022 cost of living index in zip code 30428: 78.3 (low, U.S. average is 100)
Land area: 148.8 sq. mi. Water area: 2.7 sq. mi.
Population density: 19 people per square mile
(very low).
OSM Map
General Map
Google Map
MSN Map
OSM Map
General Map
Google Map
MSN Map
OSM Map
General Map
Google Map
MSN Map
OSM Map
General Map
Google Map
MSN Map
Please wait while loading the map...
Real estate property taxes paid for housing units in 2022:
This zip code:
0.6% ($653)
Georgia:
0.7% ($2,160)
Median real estate property taxes paid for housing units with mortgages in 2022: $411 (0.3%) Median real estate property taxes paid for housing units with no mortgage in 2022: $700 (0.9%)
Business Search- 14 Million verified businesses
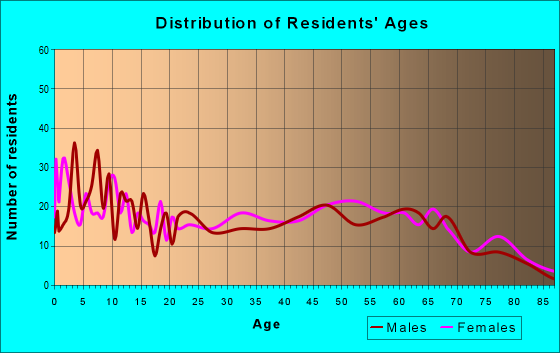
Males: 1,655
(59.7%)
Females: 1,118
(40.3%)
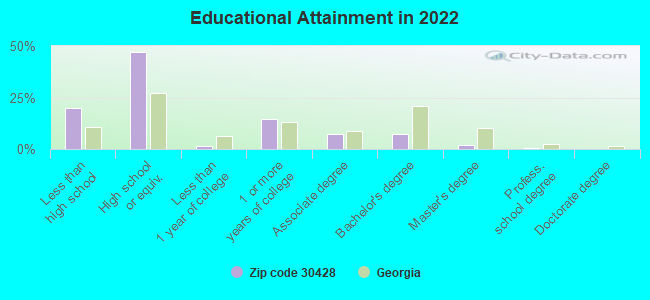
For population 25 years and over in 30428:
High school or higher: 79.0%
Bachelor's degree or higher: 9.5%
Graduate or professional degree: 2.2%
Unemployed: 2.4%
Mean travel time to work (commute): 40.5 minutes
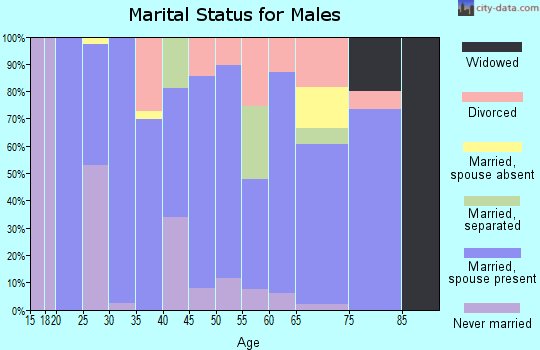
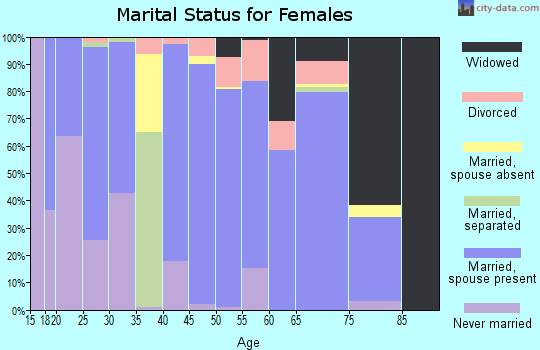
For population 15 years and over in 30428:
Never married: 47.5%
Now married: 36.1%
Separated: 3.3%
Widowed: 4.4%
Divorced: 8.7%
Zip code 30428 compared to state average:
Median household income below state average.
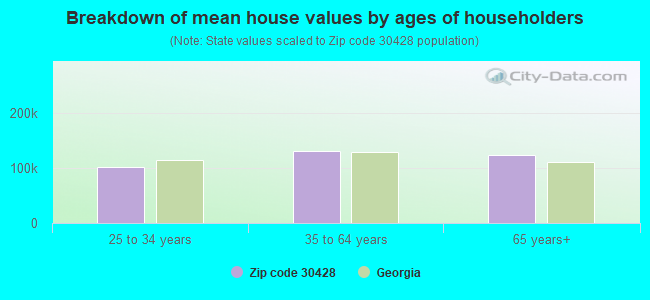
Median house value significantly below state average.
Unemployed percentage below state average.
Median age below state average.
Foreign-born population percentage significantly below state average.
Length of stay since moving in significantly above state average.
Number of college students below state average.
Percentage of population with a bachelor's degree or higher significantly below state average.
Averages for the 2020 tax year for zip code 30428, filed in 2021:
Average Adjusted Gross Income (AGI) in 2020: $40,894 (Individual Income Tax Returns)
Here:
$40,894
State:
$70,847
Salary/wage: $36,700 (reported on 81.0% of returns)
Here:
$36,700
State:
$59,126
(% of AGI for various income ranges: 1255.0% for AGIs below $25k, 3484.2% for AGIs $25k-50k, 6302.5% for AGIs $50k-75k, 8557.5% for AGIs $75k-100k, 15265.0% for AGIs $100k-200k)
Taxable interest for individuals: $459 (reported on 20.2% of returns)
This zip code:
$459
Georgia:
$2,011
(% of AGI for various income ranges: 7.3% for AGIs below $25k, 6.8% for AGIs $25k-50k, 10.0% for AGIs $50k-75k, 87.5% for AGIs $100k-200k)
Ordinary dividends: $750 (reported on 4.8% of returns)
Here:
$750
State:
$8,996
(% of AGI for various income ranges: 37.5% for AGIs $50k-75k)
Net capital gain/loss in AGI: +$12,125 (reported on 4.8% of returns)
Here:
+$12,125
State:
+$28,402
(% of AGI for various income ranges: 45.3% for AGIs below $25k, 872.5% for AGIs $75k-100k)
Profit/loss from business: +$5,358 (reported on 22.6% of returns)
Here:
+$5,358
State:
+$6,707
(% of AGI for various income ranges: 129.0% for AGIs below $25k, 342.6% for AGIs $25k-50k)
Taxable individual retirement arrangement distribution: $11,367 (reported on 3.6% of returns)
30428:
$11,367
Georgia:
$20,525
(% of AGI for various income ranges: 179.5% for AGIs $25k-50k)
Total itemized deductions: $28,533 (reported on 3.6% of returns)
Here:
$28,533
State:
$34,001
(% of AGI for various income ranges: 1070.0% for AGIs $50k-75k)
Charity contributions: $7,533 (reported on 3.6% of returns)
Here:
$7,533
State:
$14,164
(% of AGI for various income ranges: 118.9% for AGIs $25k-50k)
Taxes paid: $5,100 (reported on 3.6% of returns)
30428:
$5,100
State:
$7,540
(% of AGI for various income ranges: 191.2% for AGIs $50k-75k)
Earned income credit: $2,944 (reported on 32.1% of returns)
Here:
$2,944
State:
$2,530
(% of AGI for various income ranges: 196.7% for AGIs below $25k, 107.9% for AGIs $25k-50k)
Percentage of individuals using paid preparers for their 2020 taxes: 96.4%
Here:
96%
State:
93%
(% for various income ranges: 94.9% for AGIs below $25k, 100.0% for AGIs $25k-50k, 100.0% for AGIs $50k-75k, 100.0% for AGIs $75k-100k, 85.7% for AGIs $100k-200k)
Averages for the 2012 tax year for zip code 30428, filed in 2013:
Average Adjusted Gross Income (AGI) in 2012: $35,932 (Individual Income Tax Returns)
Here:
$35,932
State:
$56,131
Salary/wage: $32,724 (reported on 79.8% of returns)
Here:
$32,724
State:
$47,942
(% of AGI for various income ranges: 74.0% for AGIs below $25k, 77.4% for AGIs $25k-50k, 75.0% for AGIs $50k-75k, 69.8% for AGIs $75k-100k, 64.6% for AGIs $100k-200k)
Taxable interest for individuals: $833 (reported on 21.4% of returns)
This zip code:
$833
Georgia:
$1,706
(% of AGI for various income ranges: 0.7% for AGIs below $25k, 0.6% for AGIs $25k-50k, 0.4% for AGIs $50k-75k, 0.9% for AGIs $75k-100k)
Ordinary dividends: $700 (reported on 3.6% of returns)
Here:
$700
State:
$7,265
Net capital gain/loss in AGI: +$20,250 (reported on 4.8% of returns)
Here:
+$20,250
State:
+$16,323
Profit/loss from business: +$6,189 (reported on 22.6% of returns)
Here:
+$6,189
State:
+$7,583
(% of AGI for various income ranges: 14.5% for AGIs below $25k, 1.8% for AGIs $25k-50k, 3.5% for AGIs $50k-75k, 0.4% for AGIs $75k-100k)
Taxable individual retirement arrangement distribution: $11,250 (reported on 4.8% of returns)
30428:
$11,250
Georgia:
$17,199
Total itemized deductions: $17,722 (25% of AGI, reported on 21.4% of returns)
Here:
$17,722
State:
$23,886
Here:
25.4% of AGI
State:
21.5% of AGI
(% of AGI for various income ranges: 5.1% for AGIs below $25k, 9.8% for AGIs $25k-50k, 10.6% for AGIs $50k-75k, 13.3% for AGIs $75k-100k, 14.7% for AGIs $100k-200k)
Charity contributions: $4,121 (reported on 16.7% of returns)
Here:
$4,121
State:
$5,507
(% of AGI for various income ranges: 2.0% for AGIs $25k-50k, 2.0% for AGIs $50k-75k, 3.6% for AGIs $75k-100k, 2.2% for AGIs $100k-200k)
Taxes paid: $4,761 (reported on 21.4% of returns)
30428:
$4,761
State:
$7,838
(% of AGI for various income ranges: 1.0% for AGIs below $25k, 1.5% for AGIs $25k-50k, 2.9% for AGIs $50k-75k, 4.0% for AGIs $75k-100k, 5.4% for AGIs $100k-200k)
Earned income credit: $2,691 (reported on 39.3% of returns)
Here:
$2,691
State:
$2,589
(% of AGI for various income ranges: 13.4% for AGIs below $25k, 1.7% for AGIs $25k-50k)
Percentage of individuals using paid preparers for their 2012 taxes: 70.2%
Here:
70%
State:
55%
(% for various income ranges: 68.3% for AGIs below $25k, 62.5% for AGIs $25k-50k, 80.0% for AGIs $50k-75k, 80.0% for AGIs $75k-100k, 100.0% for AGIs $100k-200k)
Averages for the 2004 tax year for zip code 30428, filed in 2005:
Average Adjusted Gross Income (AGI) in 2004: $29,357 (Individual Income Tax Returns)
Here:
$29,357
State:
$47,553
Salary/wage: $28,440 (reported on 84.9% of returns)
Here:
$28,440
State:
$42,178
(% of AGI for various income ranges: 93.5% for AGIs below $10k, 82.7% for AGIs $10k-25k, 86.5% for AGIs $25k-50k, 83.3% for AGIs $50k-75k, 76.3% for AGIs $75k-100k, 70.6% for AGIs over 100k)
Taxable interest for individuals: $1,041 (reported on 28.6% of returns)
This zip code:
$1,041
Georgia:
$1,772
(% of AGI for various income ranges: 5.3% for AGIs below $10k, 1.8% for AGIs $10k-25k, 0.5% for AGIs $25k-50k, 0.7% for AGIs $50k-75k, 1.0% for AGIs $75k-100k, 0.4% for AGIs over 100k)
Taxable dividends: $456 (reported on 8.1% of returns)
Here:
$456
State:
$4,283
(% of AGI for various income ranges: 0.3% for AGIs $10k-25k, 0.1% for AGIs $25k-50k, 0.1% for AGIs $50k-75k, 0.3% for AGIs $75k-100k)
Net capital gain/loss: +$6,962 (reported on 6.3% of returns)
Here:
+$6,962
State:
+$16,461
(% of AGI for various income ranges: -0.4% for AGIs below $10k, 0.1% for AGIs $10k-25k, 1.4% for AGIs $50k-75k, 10.1% for AGIs $75k-100k)
Profit/loss from business: +$4,089 (reported on 18.6% of returns)
Here:
+$4,089
State:
+$8,201
(% of AGI for various income ranges: 18.4% for AGIs below $10k, 5.3% for AGIs $10k-25k, 1.7% for AGIs $25k-50k, 1.5% for AGIs $50k-75k)
IRA payment deduction: $1,300 (reported on 1.2% of returns)
30428:
$1,300
Georgia:
$2,969
Total itemized deductions: $16,137 (28% of AGI, reported on 21.7% of returns)
Here:
$16,137
State:
$19,944
Here:
27.9% of AGI
State:
22.6% of AGI
(% of AGI for various income ranges: 8.4% for AGIs $10k-25k, 10.3% for AGIs $25k-50k, 15.5% for AGIs $50k-75k, 16.6% for AGIs $75k-100k, 13.7% for AGIs over 100k)
Charity contributions deductions: $3,742 (6% of AGI, reported on 19.3% of returns)
Here:
$3,742
State:
$4,354
Here:
6.3% of AGI
State:
4.7% of AGI
(% of AGI for various income ranges: 1.2% for AGIs $10k-25k, 2.1% for AGIs $25k-50k, 2.7% for AGIs $50k-75k, 4.6% for AGIs $75k-100k, 4.0% for AGIs over 100k)
Total tax: $3,290 (reported on 63.0% of returns)
30428:
$3,290
State:
$8,223
(% of AGI for various income ranges: 3.8% for AGIs below $10k, 3.2% for AGIs $10k-25k, 5.1% for AGIs $25k-50k, 8.0% for AGIs $50k-75k, 9.7% for AGIs $75k-100k, 14.6% for AGIs over 100k)
Earned income credit: $2,079 (reported on 34.4% of returns)
Here:
$2,079
State:
$1,986
Percentage of individuals using paid preparers for their 2004 taxes: 82.0%
Here:
82%
State:
62%
(% for various income ranges: 82.8% for AGIs below $10k, 84.5% for AGIs $10k-25k, 78.2% for AGIs $25k-50k, 81.8% for AGIs $50k-75k, 84.8% for AGIs $75k-100k, 76.2% for AGIs over 100k)
Household received Food Stamps/SNAP in the past 12 months: 152 Household did not receive Food Stamps/SNAP in the past 12 months: 395
Women who had a birth in the past 12 months: 54 (54 now married, 0 unmarried) Women who did not have a birth in the past 12 months: 534 (208 now married, 326 unmarried)
Housing units in zip code 30428 with a mortgage: 87 Median monthly owner costs for units with a mortgage: $918 Median monthly owner costs for units without a mortgage: $296
Residents with income below the poverty level in 2022:
This zip code:
11.5%
Whole state:
12.7%
Residents with income below 50% of the poverty level in 2022:
This zip code:
7.8%
Whole state:
6.3%
Median number of rooms in houses and condos:
Here:
6.1
State:
6.8
Median number of rooms in apartments:
Here:
4.8
State:
4.6
Notable locations in this zip code not listed on our city pages
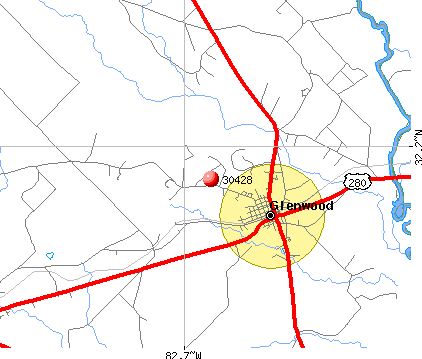
Notable locations in zip code 30428: Diamond Landing (A), Windham Greenhouses (B), Wheeler County Emergency Medical Services (C), Glenwood City Volunteer Fire Department (D), Crossroads Fire Department (E), Laurens County Fire Department Station 16 Lowery (F). Display/hide their locations on the map
Churches in zip code 30428 include: Bethel Church (A), Beulah Church (B), Stuckey Church (C), Macedonia Church (D), Free Run Church (E), Hope Church (F), Landsburg Church (G), Pearson Grove Church (H), Sardis Church (I). Display/hide their locations on the map
Cemeteries: Adams Cemetery (1), Baker Cemetery (2), Benton Cemetery (3), Boatwright Cemetery (4), Mason Cemetery (5), Braceville Cemetery (6), Browning Cemetery (7). Display/hide their locations on the map
Streams, rivers, and creeks: Whitewater Creek (A), Flat Creek (B), Buck Creek (C), Big Branch (D), Pitts Creek (E), Ochwalkee Creek (F), Peterson Creek (G), Lotts Creek (H), Larry Creek (I). Display/hide their locations on the map
In group quarters: 44 (-1 institutionalized population)
Size of family households: 186 2-persons, 46 3-persons, 61 4-persons, 59 5-persons, 6 7-or-more-persons
Size of nonfamily households: 156 1-person, 12 2-persons, 10 3-persons
294 married couples with children.
47 single-parent households (38 men, 9 women).
91.6% of residents of 30428 zip code speak English at home.
7.5% of residents speak Spanish at home (98% well, 2% not well).
0.1% of residents speak other Indo-European language at home (100% very well).
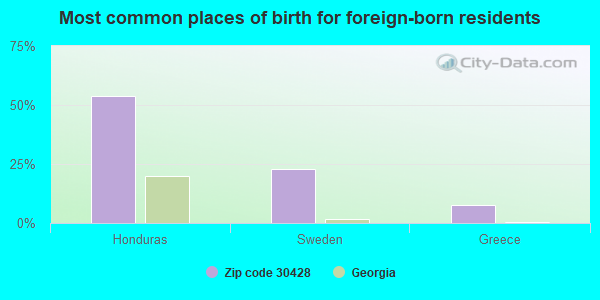
Foreign born population: 13 (0.5%) (16.7% of them are naturalized citizens)
This zip code:
0.5%
Whole state:
10.7%
54%Honduras
23%Sweden
8%Greece
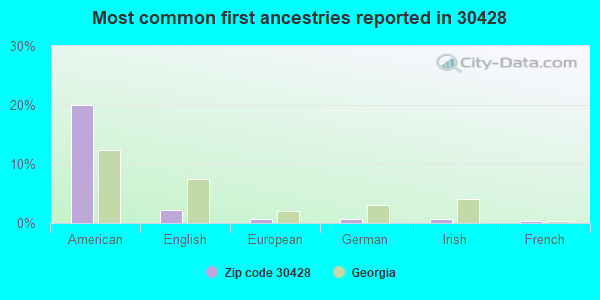
20%American
2%English
1%European
1%German
1%Irish
0%French
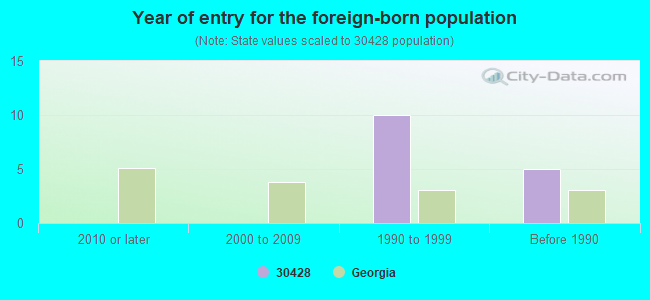
Year of entry for the foreign-born population
02010 or later
02000 to 2009
101990 to 1999
5Before 1990
Facilities with environmental interests located in this zip code:
TRI-COUNTY ALTERNATIVE SCHOOL (P.O. BOX 84 in GLENWOOD, GA)
(National Center for Education Statistics) - STATE ID-6595 Organizations: WHEELER COUNTY (SCHOOL DISTRICT)
FLASH FOODS #05 (HWY 280 AND 2ND AVE in GLENWOOD, GA)
GLENWOOD WPCP (2ND ST HWY 19 S, P.O. BOX 616 in GLENWOOD, GA)
National Pollutant Discharge Elimination System NON-MAJOR (Tracking pollutant discharge elimination systems) - permit Business SIC classification: SEWERAGE SYSTEMS
Housing units lacking complete plumbing facilities: 15.7% Housing units lacking complete kitchen facilities: 13.0%
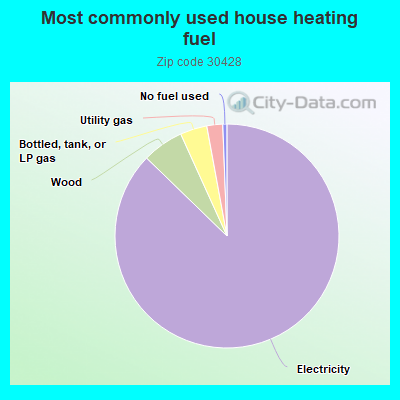
87.7%Electricity
6.0%Wood
3.9%Bottled, tank, or LP gas
2.3%Utility gas
0.6%No fuel used
Population in 1990: 2,319. Population change in the 1990s: +151 (+6.5%).
Place of birth for U.S.-born residents:
This state: 2,320
Northeast: 9
Midwest: 26
South: 330
West: 42
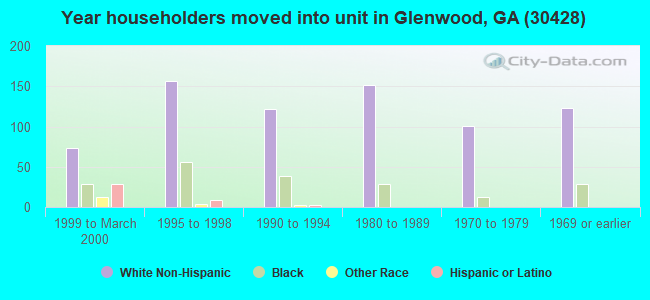
71% of the 30428 zip code residents lived in the same house 5 years ago. Out of people who lived in different houses, 47% lived in this county. Out of people who lived in different counties, 50% lived in Georgia.
97% of the 30428 zip code residents lived in the same house 1 year ago. Out of people who lived in different houses, 44% moved from this county. Out of people who lived in different houses, 41% moved from different county within same state. Out of people who lived in different houses, 20% moved from different state.
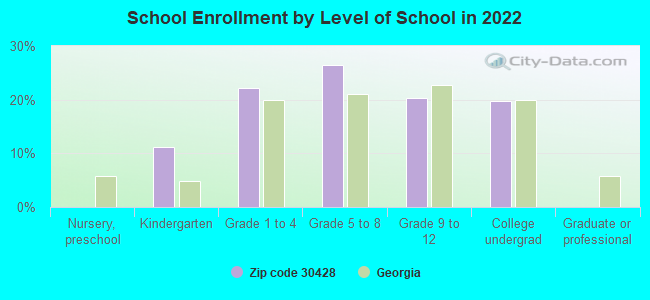
Private vs. public school enrollment:
Students in private schools in grades 1 to 8 (elementary and middle school): 1
Here:
0.9%
Georgia:
12.1%
Students in private schools in grades 9 to 12 (high school): 2
Here:
2.3%
Georgia:
10.8%
Students in private undergraduate colleges: 10
Here:
11.9%
Georgia:
17.1%
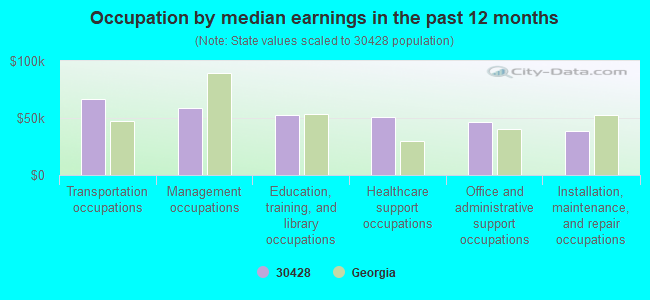
Occupation by median earnings in the past 12 months ($)
66,891Transportation occupations
58,510Management occupations
53,048Education, training, and library occupations
50,456Healthcare support occupations
46,647Office and administrative support occupations
38,523Installation, maintenance, and repair occupations
Top industries in this zip code by the number of employees in 2005:
Health Care and Social Assistance: General Medical and Surgical Hospitals (100-249 employees: 1 establishment)
Health Care and Social Assistance: Nursing Care Facilities (20-49: 1)
Construction: Plumbing, Heating, and Air-Conditioning Contractors (5-9: 1, 1-4: 1)
Health Care and Social Assistance: Child Day Care Services (5-9: 1)
People in group quarters in 2010:
48 people in nursing facilities/skilled-nursing facilities
People in group quarters in 2000:
61 people in nursing homes
8 people in short-term care, detention or diagnostic centers for delinquent children
2 people in other group homes
Fatal accident statistics in 2014:
Fatal accident count: 1
Vehicles involved in fatal accidents: 1
Fatal accidents caused by drunken drivers: 0
Fatalities: 1
Persons involved in fatal accidents: 3
Pedestrians involved in fatal accidents: 1
Fatal accident statistics in 2012:
Fatal accident count: 2
Vehicles involved in fatal accidents: 2
Fatal accidents caused by drunken drivers: 0
Fatalities: 2
Persons involved in fatal accidents: 2
Pedestrians involved in fatal accidents: 0
2003 - 2018 National Fire Incident Reporting System (NFIRS) incidents
According to the data from the years 2003 - 2018 the average number of fire incidents per year is 22. The highest number of reported fire incidents - 44 took place in 2010, and the least - 3 in 2003. The data has an increasing trend.
When looking into fire subcategories, the most reports belonged to: Structure Fires (44.7%), and Outside Fires (43.0%).
Fire incident types reported to NFIRS in Zip Code 30428
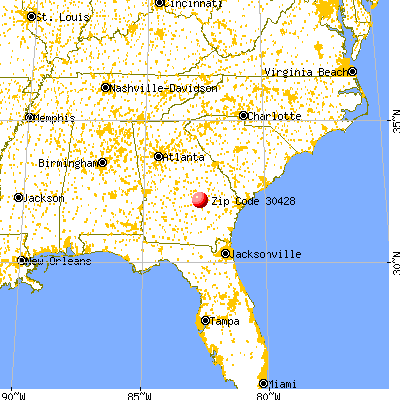


 Nearest zip codes: 30411, 30445, 30470, 30410, 31083, 30454.
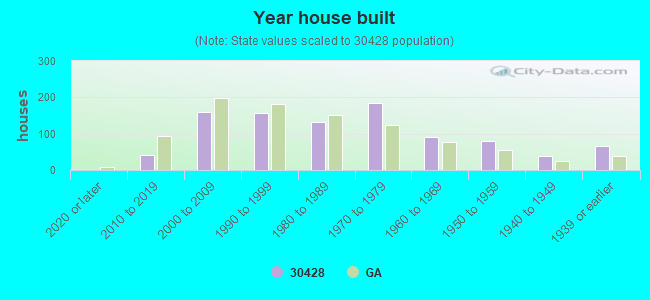


 According to the data from the years 2003 - 2018 the average number of fire incidents per year is 22. The highest number of reported fire incidents - 44 took place in 2010, and the least - 3 in 2003. The data has an increasing trend.
 When looking into fire subcategories, the most reports belonged to: Structure Fires (44.7%), and Outside Fires (43.0%).