Estimated zip code population in 2022: 3,403 Zip code population in 2010: 3,682 Zip code population in 2000: 2,444
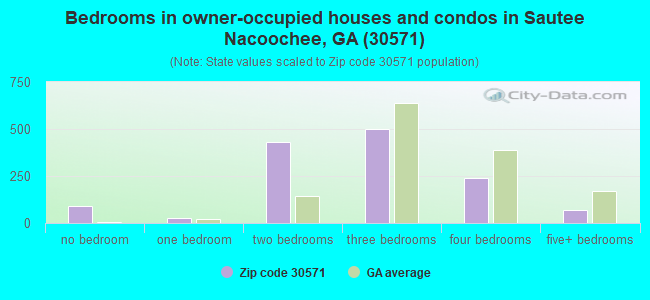
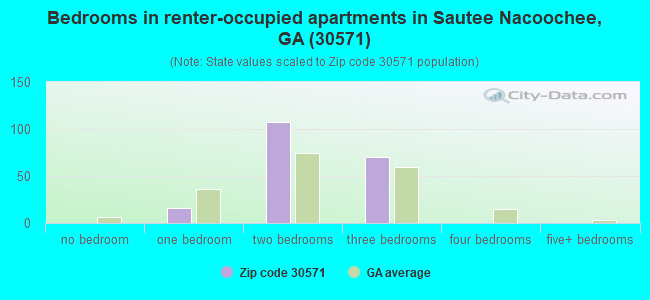
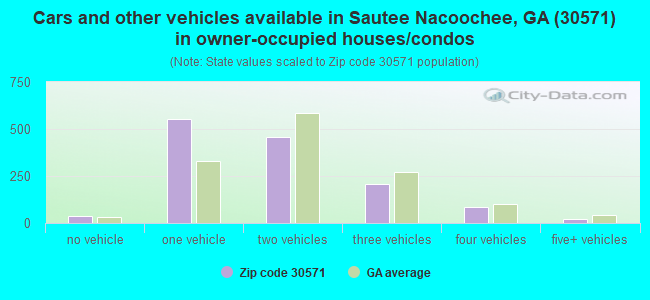
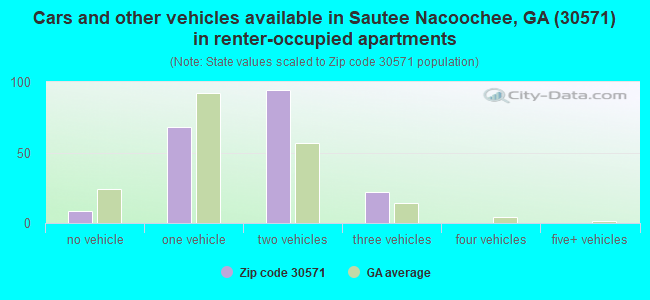
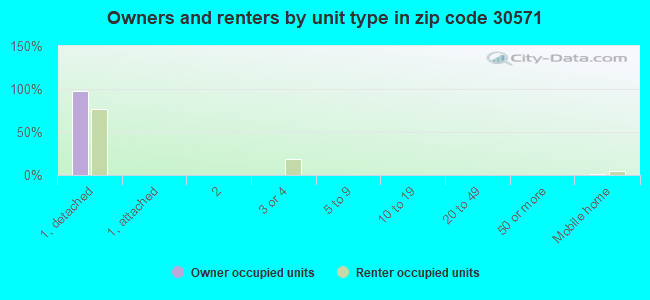
Houses and condos: 2,436 Renter-occupied apartments: 191
% of renters here:
12%
State:
34%
March 2022 cost of living index in zip code 30571: 82.7 (low, U.S. average is 100)
Land area: 56.2 sq. mi. Water area: 0.4 sq. mi.
Population density: 61 people per square mile
(very low).
OSM Map
General Map
Google Map
MSN Map
OSM Map
General Map
Google Map
MSN Map
OSM Map
General Map
Google Map
MSN Map
OSM Map
General Map
Google Map
MSN Map
Please wait while loading the map...
Real estate property taxes paid for housing units in 2022:
This zip code:
0.5% ($1,726)
Georgia:
0.7% ($2,160)
Median real estate property taxes paid for housing units with mortgages in 2022: $1,852 (0.6%) Median real estate property taxes paid for housing units with no mortgage in 2022: $1,502 (0.5%)
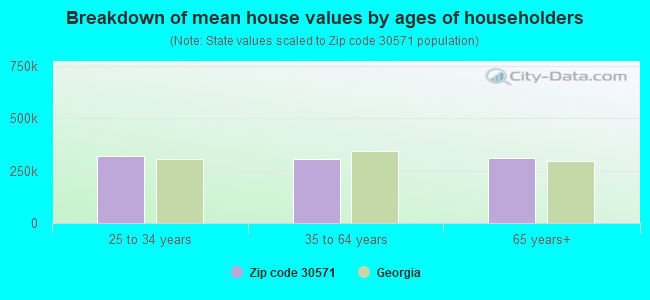
Estimated median house/condo value in 2022: $315,904
30571:
$315,904
Georgia:
$297,400
According to our research of Georgia and other state lists, there were 9 registered sex offenders living in 30571 zip code as of April 27, 2024. The ratio of all residents to sex offenders in zip code 30571 is 430 to 1. The ratio of registered sex offenders to all residents in this zip code is near the state average.
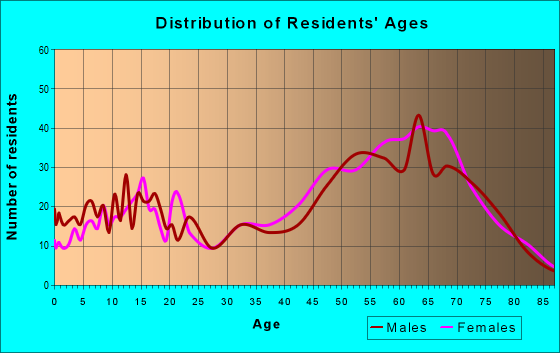
Median resident age:
This zip code:
58.4 years
Georgia median age:
37.6 years
Average household size:
This zip code:
2.2 people
Georgia:
2.6 people
Averages for the 2020 tax year for zip code 30571, filed in 2021:
Average Adjusted Gross Income (AGI) in 2020: $72,455 (Individual Income Tax Returns)
Here:
$72,455
State:
$70,847
Salary/wage: $51,179 (reported on 66.5% of returns)
Here:
$51,179
State:
$59,126
(% of AGI for various income ranges: 990.3% for AGIs below $25k, 3002.8% for AGIs $25k-50k, 5620.8% for AGIs $50k-75k, 8305.0% for AGIs $75k-100k, 15066.7% for AGIs $100k-200k, 56095.0% for AGIs over 200k)
Taxable interest for individuals: $2,441 (reported on 38.4% of returns)
This zip code:
$2,441
Georgia:
$2,011
(% of AGI for various income ranges: 32.9% for AGIs below $25k, 46.4% for AGIs $25k-50k, 107.7% for AGIs $50k-75k, 185.0% for AGIs $75k-100k, 375.8% for AGIs $100k-200k, 2670.0% for AGIs over 200k)
Ordinary dividends: $7,034 (reported on 26.8% of returns)
Here:
$7,034
State:
$8,996
(% of AGI for various income ranges: 47.9% for AGIs below $25k, 93.2% for AGIs $25k-50k, 273.8% for AGIs $50k-75k, 348.0% for AGIs $75k-100k, 801.7% for AGIs $100k-200k, 5165.0% for AGIs over 200k)
Net capital gain/loss in AGI: +$29,559 (reported on 25.0% of returns)
Here:
+$29,559
State:
+$28,402
(% of AGI for various income ranges: 9.7% for AGIs below $25k, 15.6% for AGIs $25k-50k, 156.9% for AGIs $50k-75k, 431.0% for AGIs $75k-100k, 1442.5% for AGIs $100k-200k, 48405.0% for AGIs over 200k)
Profit/loss from business: +$11,284 (reported on 19.5% of returns)
Here:
+$11,284
State:
+$6,707
(% of AGI for various income ranges: 156.2% for AGIs below $25k, 180.0% for AGIs $25k-50k, 87.7% for AGIs $50k-75k, 441.0% for AGIs $75k-100k, 445.0% for AGIs $100k-200k, 7705.0% for AGIs over 200k)
Taxable individual retirement arrangement distribution: $23,404 (reported on 16.5% of returns)
30571:
$23,404
Georgia:
$20,525
(% of AGI for various income ranges: 119.7% for AGIs below $25k, 283.6% for AGIs $25k-50k, 444.6% for AGIs $50k-75k, 778.0% for AGIs $75k-100k, 1731.7% for AGIs $100k-200k, 8845.0% for AGIs over 200k)
Total itemized deductions: $30,582 (reported on 10.4% of returns)
Here:
$30,582
State:
$34,001
(% of AGI for various income ranges: 206.5% for AGIs below $25k, 646.9% for AGIs $50k-75k, 1580.8% for AGIs $100k-200k, 8795.0% for AGIs over 200k)
Charity contributions: $12,346 (reported on 7.9% of returns)
Here:
$12,346
State:
$14,164
(% of AGI for various income ranges: 222.3% for AGIs $50k-75k, 569.2% for AGIs $100k-200k, 3165.0% for AGIs over 200k)
Taxes paid: $6,218 (reported on 10.4% of returns)
30571:
$6,218
State:
$7,540
(% of AGI for various income ranges: 21.5% for AGIs below $25k, 140.8% for AGIs $50k-75k, 369.2% for AGIs $100k-200k, 1790.0% for AGIs over 200k)
Earned income credit: $1,760 (reported on 12.2% of returns)
Here:
$1,760
State:
$2,530
(% of AGI for various income ranges: 60.3% for AGIs below $25k, 58.8% for AGIs $25k-50k)
Percentage of individuals using paid preparers for their 2020 taxes: 92.1%
Here:
92%
State:
93%
(% for various income ranges: 92.3% for AGIs below $25k, 94.3% for AGIs $25k-50k, 90.9% for AGIs $50k-75k, 88.9% for AGIs $75k-100k, 92.9% for AGIs $100k-200k, 88.9% for AGIs over 200k)
Averages for the 2012 tax year for zip code 30571, filed in 2013:
Average Adjusted Gross Income (AGI) in 2012: $55,495 (Individual Income Tax Returns)
Here:
$55,495
State:
$56,131
Salary/wage: $39,812 (reported on 67.4% of returns)
Here:
$39,812
State:
$47,942
(% of AGI for various income ranges: 59.7% for AGIs below $25k, 56.0% for AGIs $25k-50k, 51.3% for AGIs $50k-75k, 50.4% for AGIs $75k-100k, 46.8% for AGIs $100k-200k, 32.8% for AGIs over 200k)
Taxable interest for individuals: $2,398 (reported on 42.4% of returns)
This zip code:
$2,398
Georgia:
$1,706
(% of AGI for various income ranges: 3.6% for AGIs below $25k, 1.1% for AGIs $25k-50k, 1.3% for AGIs $50k-75k, 2.3% for AGIs $75k-100k, 1.1% for AGIs $100k-200k, 3.0% for AGIs over 200k)
Ordinary dividends: $5,942 (reported on 27.3% of returns)
Here:
$5,942
State:
$7,265
(% of AGI for various income ranges: 3.2% for AGIs below $25k, 2.6% for AGIs $25k-50k, 2.4% for AGIs $50k-75k, 4.4% for AGIs $75k-100k, 2.6% for AGIs $100k-200k, 2.6% for AGIs over 200k)
Net capital gain/loss in AGI: +$3,407 (reported on 22.7% of returns)
Here:
+$3,407
State:
+$16,323
(% of AGI for various income ranges: 1.4% for AGIs $50k-75k, 4.2% for AGIs $100k-200k)
Profit/loss from business: +$4,827 (reported on 22.7% of returns)
Here:
+$4,827
State:
+$7,583
(% of AGI for various income ranges: 13.0% for AGIs below $25k, 2.5% for AGIs $25k-50k, 0.7% for AGIs $50k-75k, 1.0% for AGIs $75k-100k, 0.9% for AGIs $100k-200k)
Taxable individual retirement arrangement distribution: $19,877 (reported on 19.7% of returns)
30571:
$19,877
Georgia:
$17,199
(% of AGI for various income ranges: 5.7% for AGIs below $25k, 6.2% for AGIs $25k-50k, 5.8% for AGIs $50k-75k, 6.3% for AGIs $75k-100k, 12.3% for AGIs $100k-200k)
Total itemized deductions: $23,053 (25% of AGI, reported on 40.2% of returns)
Here:
$23,053
State:
$23,886
Here:
24.8% of AGI
State:
21.5% of AGI
(% of AGI for various income ranges: 18.0% for AGIs below $25k, 16.0% for AGIs $25k-50k, 13.9% for AGIs $50k-75k, 18.9% for AGIs $75k-100k, 18.0% for AGIs $100k-200k, 14.2% for AGIs over 200k)
Charity contributions: $4,796 (reported on 36.4% of returns)
Here:
$4,796
State:
$5,507
(% of AGI for various income ranges: 1.6% for AGIs below $25k, 2.3% for AGIs $25k-50k, 2.5% for AGIs $50k-75k, 3.3% for AGIs $75k-100k, 4.2% for AGIs $100k-200k, 3.1% for AGIs over 200k)
Taxes paid: $6,494 (reported on 40.2% of returns)
30571:
$6,494
State:
$7,838
(% of AGI for various income ranges: 2.7% for AGIs below $25k, 2.8% for AGIs $25k-50k, 3.5% for AGIs $50k-75k, 5.4% for AGIs $75k-100k, 5.6% for AGIs $100k-200k, 6.2% for AGIs over 200k)
Earned income credit: $2,000 (reported on 17.4% of returns)
Here:
$2,000
State:
$2,589
(% of AGI for various income ranges: 5.7% for AGIs below $25k, 1.1% for AGIs $25k-50k)
Percentage of individuals using paid preparers for their 2012 taxes: 62.9%
Here:
63%
State:
55%
(% for various income ranges: 58.0% for AGIs below $25k, 60.7% for AGIs $25k-50k, 68.4% for AGIs $50k-75k, 71.4% for AGIs $75k-100k, 66.7% for AGIs $100k-200k, 66.7% for AGIs over 200k)
Averages for the 2004 tax year for zip code 30571, filed in 2005:
Average Adjusted Gross Income (AGI) in 2004: $44,791 (Individual Income Tax Returns)
Here:
$44,791
State:
$47,553
Salary/wage: $34,505 (reported on 70.2% of returns)
Here:
$34,505
State:
$42,178
(% of AGI for various income ranges: 88.5% for AGIs below $10k, 57.8% for AGIs $10k-25k, 57.1% for AGIs $25k-50k, 59.2% for AGIs $50k-75k, 56.4% for AGIs $75k-100k, 44.3% for AGIs over 100k)
Taxable interest for individuals: $2,246 (reported on 55.1% of returns)
This zip code:
$2,246
Georgia:
$1,772
(% of AGI for various income ranges: 14.3% for AGIs below $10k, 5.0% for AGIs $10k-25k, 2.4% for AGIs $25k-50k, 1.7% for AGIs $50k-75k, 2.8% for AGIs $75k-100k, 2.4% for AGIs over 100k)
Taxable dividends: $3,346 (reported on 31.9% of returns)
Here:
$3,346
State:
$4,283
(% of AGI for various income ranges: 5.8% for AGIs below $10k, 2.6% for AGIs $10k-25k, 3.3% for AGIs $25k-50k, 1.2% for AGIs $50k-75k, 2.5% for AGIs $75k-100k, 2.3% for AGIs over 100k)
Net capital gain/loss: +$8,345 (reported on 26.1% of returns)
Here:
+$8,345
State:
+$16,461
(% of AGI for various income ranges: 4.1% for AGIs below $10k, -0.5% for AGIs $10k-25k, 1.8% for AGIs $25k-50k, 1.5% for AGIs $50k-75k, 1.2% for AGIs $75k-100k, 12.5% for AGIs over 100k)
Profit/loss from business: +$7,487 (reported on 25.2% of returns)
Here:
+$7,487
State:
+$8,201
(% of AGI for various income ranges: 1.8% for AGIs below $10k, 7.4% for AGIs $10k-25k, 5.2% for AGIs $25k-50k, 2.4% for AGIs $50k-75k, 0.9% for AGIs $75k-100k, 6.1% for AGIs over 100k)
IRA payment deduction: $3,607 (reported on 2.3% of returns)
30571:
$3,607
Georgia:
$2,969
Total itemized deductions: $18,971 (27% of AGI, reported on 45.7% of returns)
Here:
$18,971
State:
$19,944
Here:
27.2% of AGI
State:
22.6% of AGI
(% of AGI for various income ranges: 26.1% for AGIs below $10k, 24.2% for AGIs $10k-25k, 22.2% for AGIs $25k-50k, 18.6% for AGIs $50k-75k, 19.5% for AGIs $75k-100k, 16.4% for AGIs over 100k)
Charity contributions deductions: $4,700 (6% of AGI, reported on 41.3% of returns)
Here:
$4,700
State:
$4,354
Here:
6.5% of AGI
State:
4.7% of AGI
(% of AGI for various income ranges: 2.4% for AGIs below $10k, 2.9% for AGIs $10k-25k, 4.4% for AGIs $25k-50k, 4.4% for AGIs $50k-75k, 4.2% for AGIs $75k-100k, 4.8% for AGIs over 100k)
Total tax: $6,043 (reported on 77.4% of returns)
30571:
$6,043
State:
$8,223
(% of AGI for various income ranges: 6.1% for AGIs below $10k, 4.1% for AGIs $10k-25k, 6.3% for AGIs $25k-50k, 9.0% for AGIs $50k-75k, 10.2% for AGIs $75k-100k, 16.0% for AGIs over 100k)
Earned income credit: $1,361 (reported on 13.9% of returns)
Here:
$1,361
State:
$1,986
Percentage of individuals using paid preparers for their 2004 taxes: 68.3%
Here:
68%
State:
62%
(% for various income ranges: 57.3% for AGIs below $10k, 68.2% for AGIs $10k-25k, 74.5% for AGIs $25k-50k, 70.8% for AGIs $50k-75k, 64.5% for AGIs $75k-100k, 80.6% for AGIs over 100k)
Household received Food Stamps/SNAP in the past 12 months: 72 Household did not receive Food Stamps/SNAP in the past 12 months: 1,449
Women who had a birth in the past 12 months: 43 (44 now married, 0 unmarried) Women who did not have a birth in the past 12 months: 461 (196 now married, 265 unmarried)
Housing units in zip code 30571 with a mortgage: 802 (76 second mortgage, 73 both second mortgage and home equity loan) Houses without a mortgage: 9
Median monthly owner costs for units with a mortgage: $1,415 Median monthly owner costs for units without a mortgage: $437
Residents with income below the poverty level in 2022:
This zip code:
4.5%
Whole state:
12.7%
Residents with income below 50% of the poverty level in 2022:
This zip code:
1.7%
Whole state:
6.3%
Median number of rooms in houses and condos:
Here:
5.8
State:
6.8
Median number of rooms in apartments:
Here:
4.6
State:
4.6
Notable locations in this zip code not listed on our city pages
Notable locations in zip code 30571: Anna Ruby Falls Scenic Area (A), Anna Ruby Campground (B), White County Fire Department Station 7 (C), White County Fire Department Station 3 (D). Display/hide their locations on the map
Churches in zip code 30571 include: Community Church (A), White Church (B), Union Grove Chapel (C), Resurrection Episcopal Church (D), Sal Mountain Chapel (E), Dukes Creek Church (F), Cresecent Hill Church (G), Bethel Church (H), Bean Creek Church (I). Display/hide their locations on the map
Cemeteries: Bean Creek Cemetery (1), Bethel Cemetery (2), Crescent Hill Cemetery (3), Dukes Creek Cemetery (4), Nacoochee Cemetery (5). Display/hide their locations on the map
Reservoirs: Royal Lake (A), Sky Lake (B), Unicoi State Park Lake (C), Mays Lake (D), Sautee Creek Watershed Number 13 Lake (E), Sautee Creek Watershed Number 12 Lake (F), Sautee Watershed Number 10 Lake (G). Display/hide their locations on the map
Streams, rivers, and creeks: West Fork Smith Creek (A), Steep Creek (B), Snake Branch (C), Sautee Creek (D), Nester Branch (E), McClure Creek (F), East Fork Smith Creek (G), Craig Creek (H), Chinquapin Branch (I). Display/hide their locations on the map
Size of family households: 800 2-persons, 179 3-persons, 79 4-persons, 69 5-persons, 16 7-or-more-persons
Size of nonfamily households: 376 1-person, 9 2-persons
265 married couples with children.
49 single-parent households (49 men).
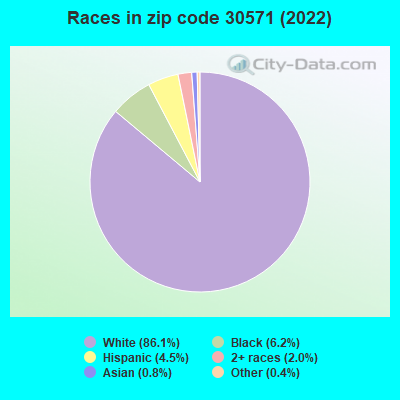
95.3% of residents of 30571 zip code speak English at home.
3.1% of residents speak Spanish at home (71% very well, 9% well, 21% not at all).
2.1% of residents speak other Indo-European language at home (94% very well, 6% well).
0.4% of residents speak Asian or Pacific Island language at home (46% very well, 54% not well).
Foreign born population: 114 (3.4%) (75.6% of them are naturalized citizens)
This zip code:
3.4%
Whole state:
10.7%
14%France
13%Greece
12%Poland
9%Norway
5%Malaysia
5%Thailand
5%Honduras
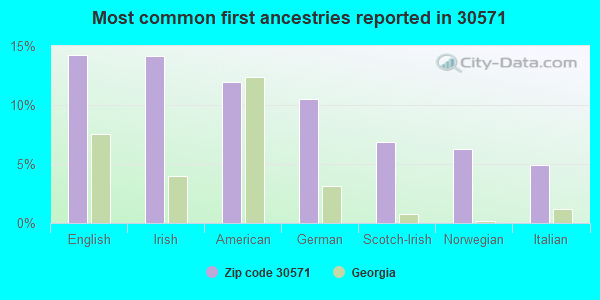
14%English
14%Irish
12%American
11%German
7%Scotch-Irish
6%Norwegian
5%Italian
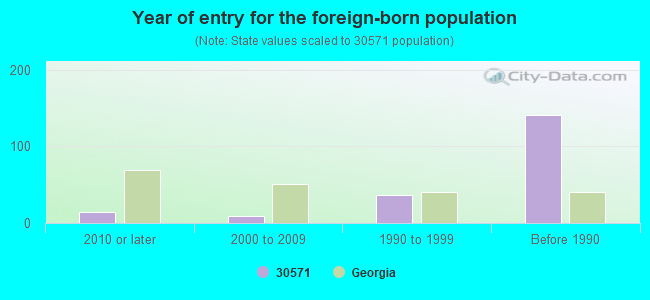
Year of entry for the foreign-born population
152010 or later
92000 to 2009
361990 to 1999
141Before 1990
Housing units lacking complete plumbing facilities: 0.6% Housing units lacking complete kitchen facilities: 0.6%
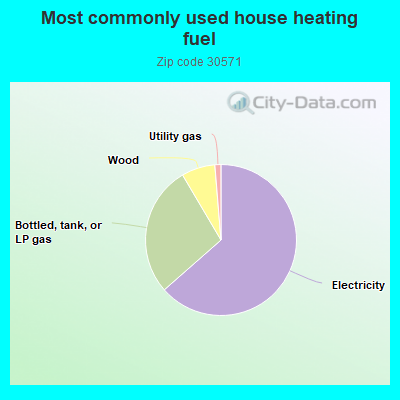
63.6%Electricity
28.0%Bottled, tank, or LP gas
7.2%Wood
1.3%Utility gas
Population in 1990: 1,504. Population change in the 1990s: +940 (+62.5%).
Place of birth for U.S.-born residents:
This state: 1,522
Northeast: 219
Midwest: 471
South: 736
West: 246
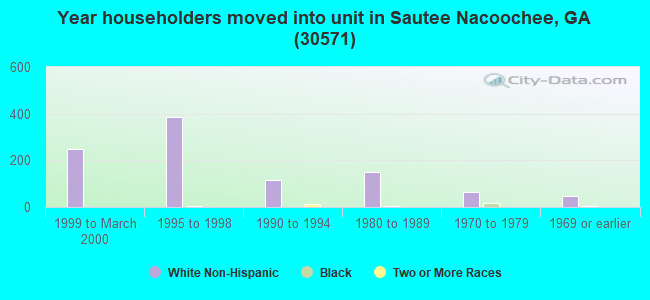
44% of the 30571 zip code residents lived in the same house 5 years ago. Out of people who lived in different houses, 28% lived in this county. Out of people who lived in different counties, 50% lived in Georgia.
89% of the 30571 zip code residents lived in the same house 1 year ago. Out of people who lived in different houses, 39% moved from this county. Out of people who lived in different houses, 37% moved from different county within same state. Out of people who lived in different houses, 23% moved from different state.
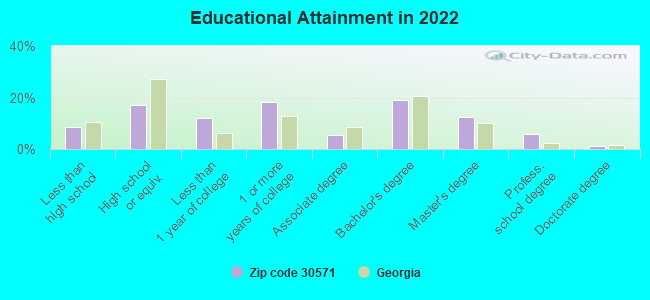
Private vs. public school enrollment:
Students in private schools in grades 1 to 8 (elementary and middle school): 5
Here:
3.9%
Georgia:
12.1%
Students in private schools in grades 9 to 12 (high school):
Here:
0.0%
Georgia:
10.8%
Students in private undergraduate colleges: 14
Here:
16.2%
Georgia:
17.1%
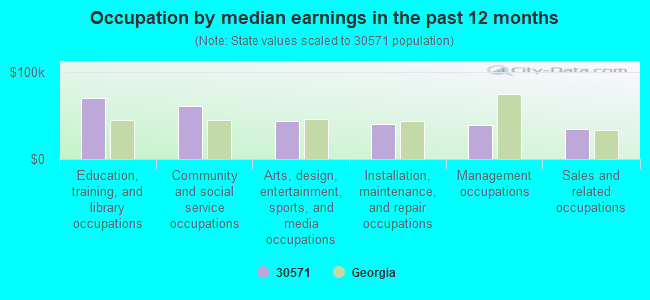
Occupation by median earnings in the past 12 months ($)
70,107Education, training, and library occupations
61,402Community and social service occupations
43,172Arts, design, entertainment, sports, and media occupations
40,228Installation, maintenance, and repair occupations
39,621Management occupations
34,596Sales and related occupations
Top industries in this zip code by the number of employees in 2005:
Construction: Plumbing, Heating, and Air-Conditioning Contractors (5-9: 2, 1-4: 1)
Accommodation and Food Services: Hotels (except Casino Hotels) and Motels (10-19: 1)
Other Services (except Public Administration): Civic and Social Organizations (10-19: 1)
Accommodation and Food Services: Bed-and-Breakfast Inns (5-9: 1, 1-4: 1)
Arts, Entertainment, and Recreation: Fitness and Recreational Sports Centers (5-9: 1, 1-4: 1)
Other Services (except Public Administration): Religious Organizations (5-9: 1, 1-4: 1)
Fatal accident statistics in 2014:
Fatal accident count: 1
Vehicles involved in fatal accidents: 1
Fatal accidents caused by drunken drivers: 1
Fatalities: 1
Persons involved in fatal accidents: 1
Pedestrians involved in fatal accidents: 0
Fatal accident statistics in 2010:
Fatal accident count: 1
Vehicles involved in fatal accidents: 1
Fatal accidents caused by drunken drivers: 0
Fatalities: 1
Persons involved in fatal accidents: 1
Pedestrians involved in fatal accidents: 0
2003 - 2018 National Fire Incident Reporting System (NFIRS) incidents
Based on the data from the years 2003 - 2018 the average number of fires per year is 8. The highest number of reported fire incidents - 21 took place in 2008, and the least - 0 in 2004. The data has a growing trend.
When looking into fire subcategories, the most reports belonged to: Structure Fires (49.2%), and Outside Fires (43.8%).
Fire incident types reported to NFIRS in Zip Code 30571
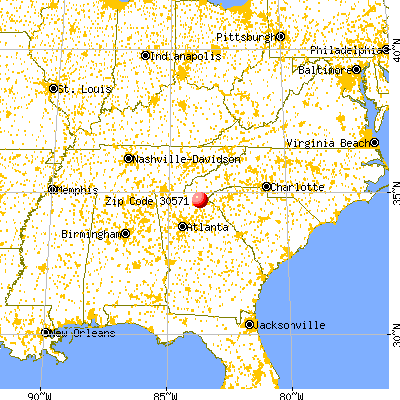


 Nearest zip codes: 30545, 30528, 30523, 30535, 30546, 30531.
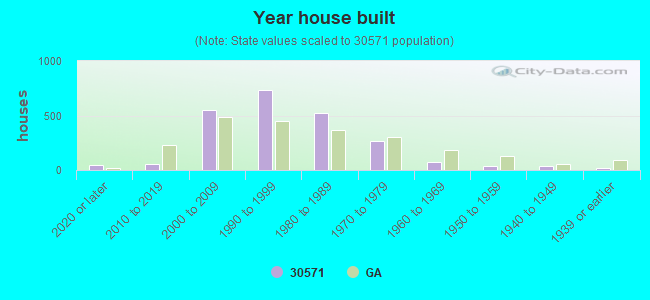


 Based on the data from the years 2003 - 2018 the average number of fires per year is 8. The highest number of reported fire incidents - 21 took place in 2008, and the least - 0 in 2004. The data has a growing trend.
 When looking into fire subcategories, the most reports belonged to: Structure Fires (49.2%), and Outside Fires (43.8%).