Estimated zip code population in 2022: 8,861 Zip code population in 2010: 7,042 Zip code population in 2000: 5,804
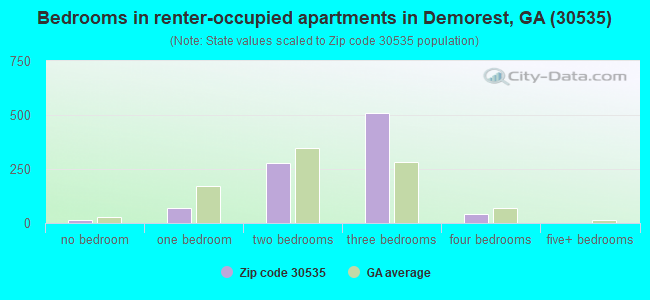
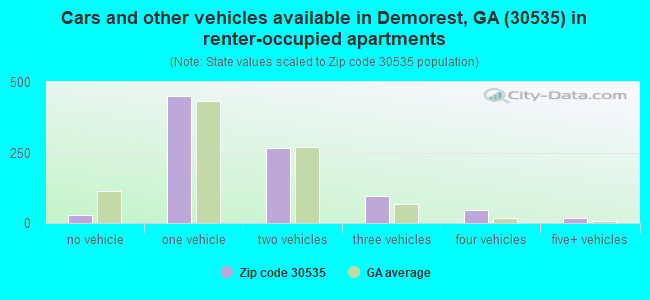
Houses and condos: 3,460 Renter-occupied apartments: 905
% of renters here:
29%
State:
34%
March 2022 cost of living index in zip code 30535: 82.3 (low, U.S. average is 100)
Land area: 29.0 sq. mi. Water area: 0.5 sq. mi.
Population density: 306 people per square mile
(very low).
OSM Map
General Map
Google Map
MSN Map
OSM Map
General Map
Google Map
MSN Map
OSM Map
General Map
Google Map
MSN Map
OSM Map
General Map
Google Map
MSN Map
Please wait while loading the map...
Real estate property taxes paid for housing units in 2022:
This zip code:
0.5% ($1,249)
Georgia:
0.7% ($2,160)
Median real estate property taxes paid for housing units with mortgages in 2022: $1,672 (0.7%) Median real estate property taxes paid for housing units with no mortgage in 2022: $935 (0.5%)
Business Search- 14 Million verified businesses
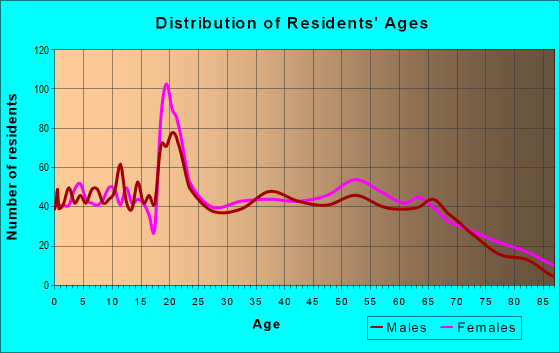
Males: 4,112
(46.4%)
Females: 4,750
(53.6%)
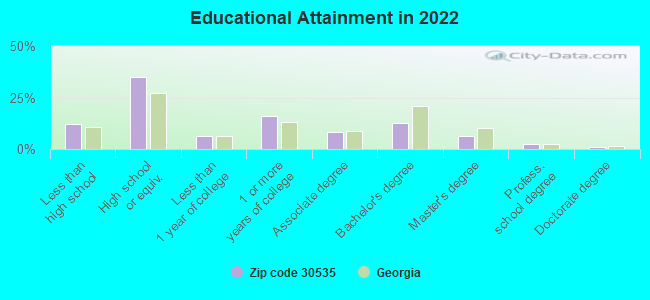
For population 25 years and over in 30535:
High school or higher: 86.6%
Bachelor's degree or higher: 21.8%
Graduate or professional degree: 9.4%
Unemployed: 1.5%
Mean travel time to work (commute): 23.4 minutes
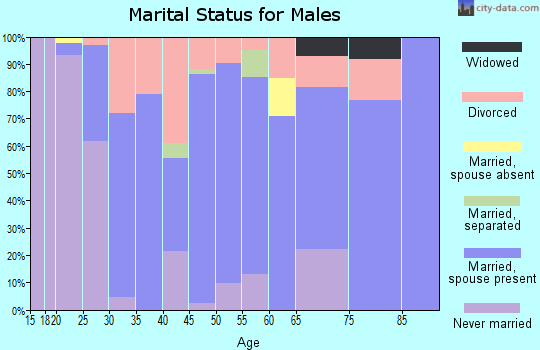
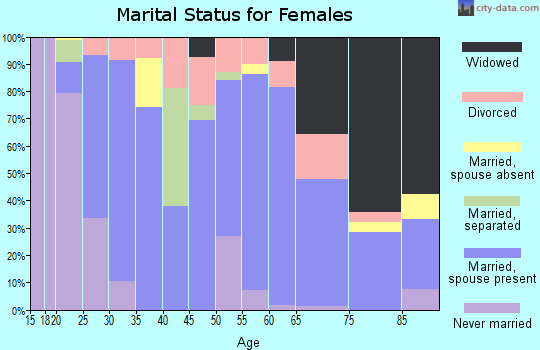
For population 15 years and over in 30535:
Never married: 29.5%
Now married: 48.3%
Separated: 1.2%
Widowed: 7.4%
Divorced: 13.5%
Zip code 30535 compared to state average:
Unemployed percentage below state average.
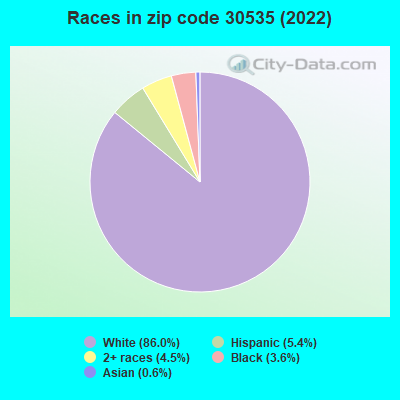
Black race population percentage significantly below state average.
Hispanic race population percentage below state average.
Foreign-born population percentage significantly below state average.
Length of stay since moving in significantly above state average.
Percentage of population with a bachelor's degree or higher below state average.
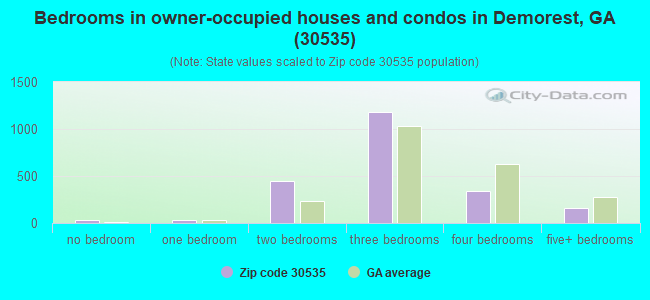
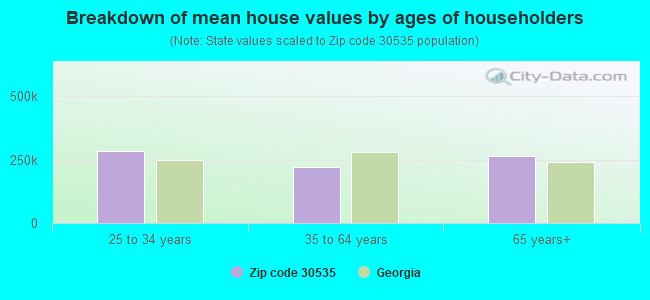
Estimated median house/condo value in 2022: $227,253
30535:
$227,253
Georgia:
$297,400
According to our research of Georgia and other state lists, there were 15 registered sex offenders living in 30535 zip code as of April 27, 2024. The ratio of all residents to sex offenders in zip code 30535 is 512 to 1. The ratio of registered sex offenders to all residents in this zip code is lower than the state average.
Median resident age:
This zip code:
34.8 years
Georgia median age:
37.6 years
Average household size:
This zip code:
2.6 people
Georgia:
2.6 people
Averages for the 2020 tax year for zip code 30535, filed in 2021:
Average Adjusted Gross Income (AGI) in 2020: $57,312 (Individual Income Tax Returns)
Here:
$57,312
State:
$70,847
Salary/wage: $48,894 (reported on 81.6% of returns)
Here:
$48,894
State:
$59,126
(% of AGI for various income ranges: 1087.7% for AGIs below $25k, 3587.0% for AGIs $25k-50k, 6467.0% for AGIs $50k-75k, 9344.6% for AGIs $75k-100k, 15065.2% for AGIs $100k-200k, 50616.7% for AGIs over 200k)
Taxable interest for individuals: $1,236 (reported on 26.3% of returns)
This zip code:
$1,236
Georgia:
$2,011
(% of AGI for various income ranges: 18.0% for AGIs below $25k, 19.5% for AGIs $25k-50k, 36.5% for AGIs $50k-75k, 57.5% for AGIs $75k-100k, 170.8% for AGIs $100k-200k, 316.7% for AGIs over 200k)
Ordinary dividends: $4,060 (reported on 12.7% of returns)
Here:
$4,060
State:
$8,996
(% of AGI for various income ranges: 14.6% for AGIs below $25k, 18.9% for AGIs $25k-50k, 90.3% for AGIs $50k-75k, 100.0% for AGIs $75k-100k, 222.0% for AGIs $100k-200k, 1093.3% for AGIs over 200k)
Net capital gain/loss in AGI: +$13,377 (reported on 10.6% of returns)
Here:
+$13,377
State:
+$28,402
(% of AGI for various income ranges: 1.1% for AGIs below $25k, 14.7% for AGIs $25k-50k, 122.4% for AGIs $50k-75k, 155.4% for AGIs $75k-100k, 364.8% for AGIs $100k-200k, 9460.0% for AGIs over 200k)
Profit/loss from business: +$9,666 (reported on 16.0% of returns)
Here:
+$9,666
State:
+$6,707
(% of AGI for various income ranges: 166.0% for AGIs below $25k, 188.2% for AGIs $25k-50k, 132.4% for AGIs $50k-75k, 201.7% for AGIs $75k-100k, 605.2% for AGIs $100k-200k)
Taxable individual retirement arrangement distribution: $17,569 (reported on 7.9% of returns)
30535:
$17,569
Georgia:
$20,525
(% of AGI for various income ranges: 59.2% for AGIs below $25k, 82.1% for AGIs $25k-50k, 155.1% for AGIs $50k-75k, 280.0% for AGIs $75k-100k, 913.2% for AGIs $100k-200k)
Total itemized deductions: $28,692 (reported on 7.6% of returns)
Here:
$28,692
State:
$34,001
(% of AGI for various income ranges: 80.8% for AGIs $25k-50k, 296.8% for AGIs $50k-75k, 290.4% for AGIs $75k-100k, 1262.0% for AGIs $100k-200k, 5633.3% for AGIs over 200k)
Charity contributions: $11,146 (reported on 7.3% of returns)
Here:
$11,146
State:
$14,164
(% of AGI for various income ranges: 15.0% for AGIs below $25k, 86.2% for AGIs $50k-75k, 82.5% for AGIs $75k-100k, 445.2% for AGIs $100k-200k, 3063.3% for AGIs over 200k)
Taxes paid: $6,912 (reported on 7.6% of returns)
30535:
$6,912
State:
$7,540
(% of AGI for various income ranges: 13.2% for AGIs $25k-50k, 54.6% for AGIs $50k-75k, 71.2% for AGIs $75k-100k, 348.0% for AGIs $100k-200k, 1326.7% for AGIs over 200k)
Earned income credit: $2,245 (reported on 17.5% of returns)
Here:
$2,245
State:
$2,530
(% of AGI for various income ranges: 102.6% for AGIs below $25k, 66.7% for AGIs $25k-50k)
Percentage of individuals using paid preparers for their 2020 taxes: 95.5%
Here:
95%
State:
93%
(% for various income ranges: 93.7% for AGIs below $25k, 95.3% for AGIs $25k-50k, 96.1% for AGIs $50k-75k, 97.1% for AGIs $75k-100k, 97.6% for AGIs $100k-200k, 100.0% for AGIs over 200k)
Averages for the 2012 tax year for zip code 30535, filed in 2013:
Average Adjusted Gross Income (AGI) in 2012: $45,460 (Individual Income Tax Returns)
Here:
$45,460
State:
$56,131
Salary/wage: $38,948 (reported on 83.1% of returns)
Here:
$38,948
State:
$47,942
(% of AGI for various income ranges: 74.0% for AGIs below $25k, 79.9% for AGIs $25k-50k, 76.0% for AGIs $50k-75k, 76.3% for AGIs $75k-100k, 70.0% for AGIs $100k-200k, 38.4% for AGIs over 200k)
Taxable interest for individuals: $1,246 (reported on 27.2% of returns)
This zip code:
$1,246
Georgia:
$1,706
(% of AGI for various income ranges: 1.1% for AGIs below $25k, 0.6% for AGIs $25k-50k, 1.0% for AGIs $50k-75k, 0.6% for AGIs $75k-100k, 0.7% for AGIs $100k-200k, 0.4% for AGIs over 200k)
Ordinary dividends: $2,626 (reported on 12.1% of returns)
Here:
$2,626
State:
$7,265
(% of AGI for various income ranges: 0.9% for AGIs below $25k, 0.6% for AGIs $25k-50k, 0.8% for AGIs $50k-75k, 0.4% for AGIs $75k-100k, 1.2% for AGIs $100k-200k)
Net capital gain/loss in AGI: +$1,481 (reported on 9.3% of returns)
Here:
+$1,481
State:
+$16,323
(% of AGI for various income ranges: 0.2% for AGIs $50k-75k, 0.1% for AGIs $75k-100k, 1.6% for AGIs $100k-200k)
Profit/loss from business: +$9,033 (reported on 17.9% of returns)
Here:
+$9,033
State:
+$7,583
(% of AGI for various income ranges: 10.3% for AGIs below $25k, 1.7% for AGIs $25k-50k, 2.6% for AGIs $50k-75k, 2.3% for AGIs $75k-100k, 5.8% for AGIs $100k-200k)
Taxable individual retirement arrangement distribution: $12,420 (reported on 10.3% of returns)
30535:
$12,420
Georgia:
$17,199
(% of AGI for various income ranges: 3.3% for AGIs below $25k, 2.3% for AGIs $25k-50k, 3.3% for AGIs $50k-75k, 2.8% for AGIs $75k-100k, 4.3% for AGIs $100k-200k)
Total itemized deductions: $18,982 (23% of AGI, reported on 31.4% of returns)
Here:
$18,982
State:
$23,886
Here:
23.2% of AGI
State:
21.5% of AGI
(% of AGI for various income ranges: 7.2% for AGIs below $25k, 10.6% for AGIs $25k-50k, 14.4% for AGIs $50k-75k, 16.2% for AGIs $75k-100k, 16.1% for AGIs $100k-200k, 12.0% for AGIs over 200k)
Charity contributions: $4,833 (reported on 26.2% of returns)
Here:
$4,833
State:
$5,507
(% of AGI for various income ranges: 0.7% for AGIs below $25k, 1.6% for AGIs $25k-50k, 2.7% for AGIs $50k-75k, 3.6% for AGIs $75k-100k, 3.4% for AGIs $100k-200k, 4.8% for AGIs over 200k)
Taxes paid: $5,438 (reported on 31.4% of returns)
30535:
$5,438
State:
$7,838
(% of AGI for various income ranges: 1.2% for AGIs below $25k, 2.1% for AGIs $25k-50k, 3.8% for AGIs $50k-75k, 5.0% for AGIs $75k-100k, 5.5% for AGIs $100k-200k, 4.8% for AGIs over 200k)
Earned income credit: $2,406 (reported on 23.1% of returns)
Here:
$2,406
State:
$2,589
(% of AGI for various income ranges: 8.2% for AGIs below $25k, 1.3% for AGIs $25k-50k)
Percentage of individuals using paid preparers for their 2012 taxes: 63.1%
Here:
63%
State:
55%
(% for various income ranges: 59.7% for AGIs below $25k, 61.5% for AGIs $25k-50k, 68.9% for AGIs $50k-75k, 68.0% for AGIs $75k-100k, 65.0% for AGIs $100k-200k, 100.0% for AGIs over 200k)
Averages for the 2004 tax year for zip code 30535, filed in 2005:
Average Adjusted Gross Income (AGI) in 2004: $37,748 (Individual Income Tax Returns)
Here:
$37,748
State:
$47,553
Salary/wage: $33,984 (reported on 85.0% of returns)
Here:
$33,984
State:
$42,178
(% of AGI for various income ranges: 102.8% for AGIs below $10k, 80.1% for AGIs $10k-25k, 82.2% for AGIs $25k-50k, 83.0% for AGIs $50k-75k, 80.4% for AGIs $75k-100k, 53.5% for AGIs over 100k)
Taxable interest for individuals: $1,315 (reported on 38.3% of returns)
This zip code:
$1,315
Georgia:
$1,772
(% of AGI for various income ranges: 5.0% for AGIs below $10k, 2.5% for AGIs $10k-25k, 1.2% for AGIs $25k-50k, 0.7% for AGIs $50k-75k, 0.9% for AGIs $75k-100k, 1.5% for AGIs over 100k)
Taxable dividends: $1,506 (reported on 15.1% of returns)
Here:
$1,506
State:
$4,283
(% of AGI for various income ranges: 2.0% for AGIs below $10k, 0.6% for AGIs $10k-25k, 0.4% for AGIs $25k-50k, 0.5% for AGIs $50k-75k, 0.9% for AGIs $75k-100k, 0.5% for AGIs over 100k)
Net capital gain/loss: +$12,828 (reported on 11.3% of returns)
Here:
+$12,828
State:
+$16,461
(% of AGI for various income ranges: 3.4% for AGIs below $10k, 0.3% for AGIs $10k-25k, 0.5% for AGIs $25k-50k, 0.8% for AGIs $50k-75k, 2.2% for AGIs $75k-100k, 15.5% for AGIs over 100k)
Profit/loss from business: +$7,121 (reported on 19.3% of returns)
Here:
+$7,121
State:
+$8,201
(% of AGI for various income ranges: 10.9% for AGIs below $10k, 5.1% for AGIs $10k-25k, 3.5% for AGIs $25k-50k, 2.2% for AGIs $50k-75k, 0.5% for AGIs $75k-100k, 6.3% for AGIs over 100k)
IRA payment deduction: $3,377 (reported on 2.0% of returns)
30535:
$3,377
Georgia:
$2,969
Total itemized deductions: $16,607 (25% of AGI, reported on 31.0% of returns)
Here:
$16,607
State:
$19,944
Here:
24.9% of AGI
State:
22.6% of AGI
(% of AGI for various income ranges: 8.4% for AGIs below $10k, 8.6% for AGIs $10k-25k, 11.4% for AGIs $25k-50k, 16.0% for AGIs $50k-75k, 17.3% for AGIs $75k-100k, 14.6% for AGIs over 100k)
Charity contributions deductions: $3,699 (5% of AGI, reported on 26.9% of returns)
Here:
$3,699
State:
$4,354
Here:
5.3% of AGI
State:
4.7% of AGI
(% of AGI for various income ranges: 1.1% for AGIs $10k-25k, 1.8% for AGIs $25k-50k, 3.0% for AGIs $50k-75k, 3.3% for AGIs $75k-100k, 3.9% for AGIs over 100k)
Total tax: $4,576 (reported on 74.1% of returns)
30535:
$4,576
State:
$8,223
(% of AGI for various income ranges: 4.4% for AGIs below $10k, 4.1% for AGIs $10k-25k, 6.5% for AGIs $25k-50k, 7.9% for AGIs $50k-75k, 9.8% for AGIs $75k-100k, 16.4% for AGIs over 100k)
Earned income credit: $1,794 (reported on 18.3% of returns)
Here:
$1,794
State:
$1,986
Percentage of individuals using paid preparers for their 2004 taxes: 71.2%
Here:
71%
State:
62%
(% for various income ranges: 65.7% for AGIs below $10k, 74.4% for AGIs $10k-25k, 73.6% for AGIs $25k-50k, 68.4% for AGIs $50k-75k, 68.7% for AGIs $75k-100k, 73.7% for AGIs over 100k)
Household received Food Stamps/SNAP in the past 12 months: 368 Household did not receive Food Stamps/SNAP in the past 12 months: 2,742
Women who had a birth in the past 12 months: 81 (81 now married, 0 unmarried) Women who did not have a birth in the past 12 months: 2,138 (812 now married, 1,326 unmarried)
Housing units in zip code 30535 with a mortgage: 1,040 (43 second mortgage, 2 home equity loan, 22 both second mortgage and home equity loan) Houses without a mortgage: 8
Median monthly owner costs for units with a mortgage: $1,471 Median monthly owner costs for units without a mortgage: $430
Residents with income below the poverty level in 2022:
This zip code:
12.6%
Whole state:
12.7%
Residents with income below 50% of the poverty level in 2022:
This zip code:
8.4%
Whole state:
6.3%
Median number of rooms in houses and condos:
Here:
6.1
State:
6.8
Median number of rooms in apartments:
Here:
4.7
State:
4.6
Notable locations in this zip code not listed on our city pages
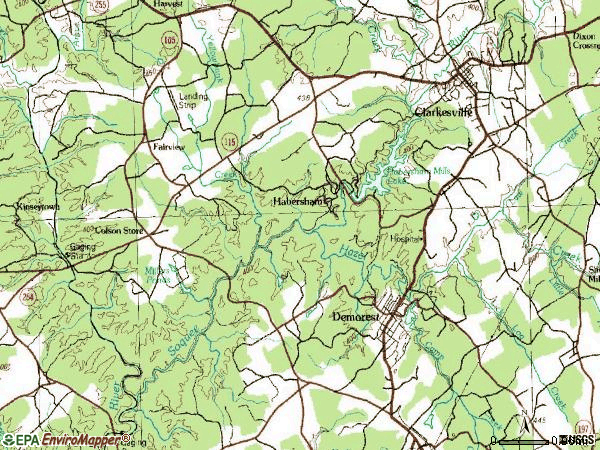
Notable locations in zip code 30535: Colson Store (A), Habersham County Fire Department Station 13 Habersham Mills (B), Habersham County Fire Department Station 11 Fairview (C), Demorest Volunteer Fire Department (D). Display/hide their locations on the map
Churches in zip code 30535 include: River Road Church (A), Habersham Baptist Church (B), Demorest Baptist Church (C), Return Church (D), Mount Carmel Church (E), Mount Vernon Church (F), Faith Tabernacle (G), Fairfield Church (H), Double Springs Church (I). Display/hide their locations on the map
Cemeteries: Yonah Memorial Gardens (1), Bethel Temple Cemetery (2), Fairfield Cemetery (3), Habersham Cemetery (4), Return Cemetery (5). Display/hide their locations on the map
Reservoirs: Hidden Valley Lake (A), Lower Taylor Lake (B), Adams Pond (C), Black Pond (D), Demorest Lake (E), Ellers Lake (F), English Pond (G), Habersham Mills Lake (H). Display/hide their locations on the map
Parks in zip code 30535 include: Demorest Commercial Historic District (1), Veterans of Foreign Wars Memorial Park (2). Display/hide their locations on the map
In group quarters: 616 (-1 institutionalized population)
Size of family households: 1,072 2-persons, 523 3-persons, 356 4-persons, 146 5-persons, 16 6-persons, 72 7-or-more-persons
Size of nonfamily households: 773 1-person, 151 2-persons
1,041 married couples with children.
464 single-parent households (201 men, 263 women).
96.2% of residents of 30535 zip code speak English at home.
2.6% of residents speak Spanish at home (93% very well, 5% well, 2% not at all).
0.8% of residents speak other Indo-European language at home (61% very well, 39% well).
0.2% of residents speak Asian or Pacific Island language at home (69% very well, 31% well).
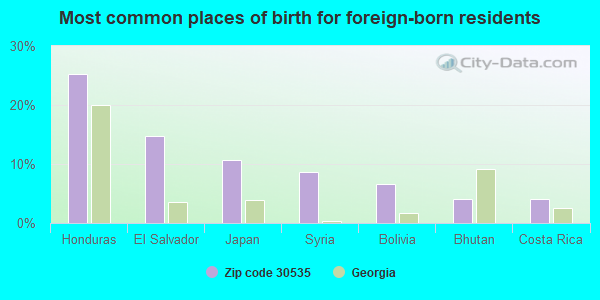
Foreign born population: 151 (1.7%) (57.2% of them are naturalized citizens)
This zip code:
1.7%
Whole state:
10.7%
25%Honduras
15%El Salvador
11%Japan
9%Syria
7%Bolivia
4%Bhutan
4%Costa Rica
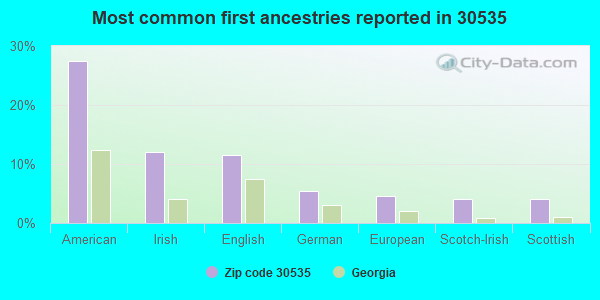
27%American
12%Irish
11%English
5%German
5%European
4%Scotch-Irish
4%Scottish
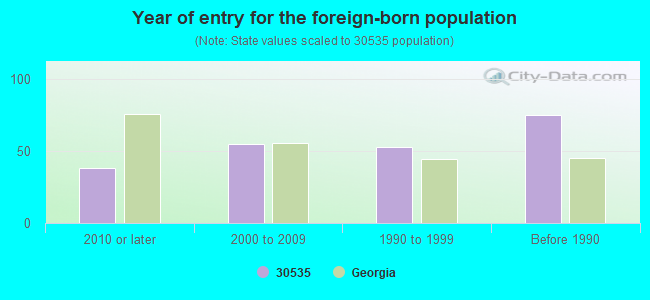
Year of entry for the foreign-born population
382010 or later
552000 to 2009
531990 to 1999
75Before 1990
Facilities with environmental interests located in this zip code:
MORGAN CONCRETE COMPANY (1005 DOUBLE SPRINGS ROAD in DEMOREST, GA)
ENFORCEMENT/COMPLIANCE ACTIVITY (Integrated Compliance Information System) - ICIS-04-2004-9916, FORMAL ENFORCEMENT ACTION (Integrated Compliance Information System) - ICIS-04-2004-9916, FORMAL ENFORCEMENT ACTION
FAIRVIEW ELEMENTARY SCHOOL (901 FAIRVIEW SCHOOL ROAD in DEMOREST, GA)
(Geographic Names Information System) (National Center for Education Statistics) - STATE ID-5050 Organizations: HABERSHAM COUNTY (SCHOOL DISTRICT)
MCALISTER, HAROLD (589 STATE HWY 115 in DEMOREST, GA)
(Integrated Compliance Information System) - ICIS-04-1999-0461, FORMAL ENFORCEMENT ACTION COMPLIANCE ACTIVITY (Tracking inspections of insecticide, fungicide, and rodenticide, and toxic substances) Business SIC classification: SCRAP AND WASTE MATERIALS Alternative names: HAROLD MCALISTER (RESIDENCE)
Housing units lacking complete plumbing facilities: 5.4% Housing units lacking complete kitchen facilities: 5.2%
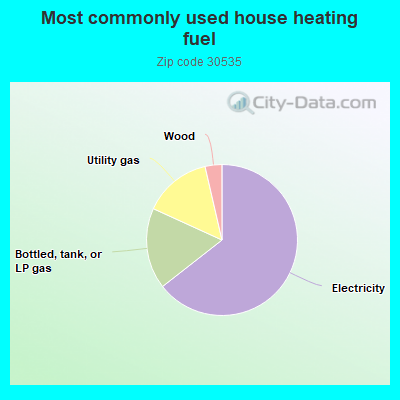
64.5%Electricity
17.4%Bottled, tank, or LP gas
14.6%Utility gas
3.6%Wood
Population in 1990: 3,521. Population change in the 1990s: +2,283 (+64.8%).
Place of birth for U.S.-born residents:
This state: 5,988
Northeast: 224
Midwest: 564
South: 1,564
West: 243
60% of the 30535 zip code residents lived in the same house 5 years ago. Out of people who lived in different houses, 59% lived in this county. Out of people who lived in different counties, 50% lived in Georgia.
93% of the 30535 zip code residents lived in the same house 1 year ago. Out of people who lived in different houses, 35% moved from this county. Out of people who lived in different houses, 44% moved from different county within same state. Out of people who lived in different houses, 23% moved from different state.
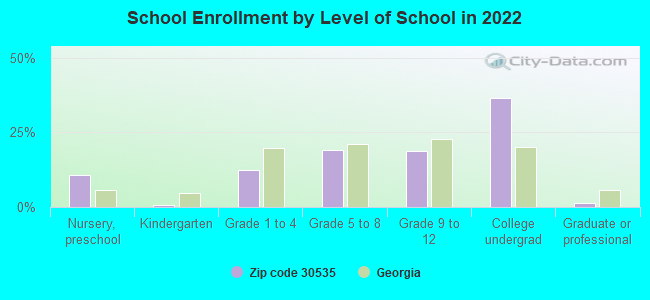
Private vs. public school enrollment:
Students in private schools in grades 1 to 8 (elementary and middle school): 66
Here:
8.5%
Georgia:
12.1%
Students in private schools in grades 9 to 12 (high school): 44
Here:
9.4%
Georgia:
10.8%
Students in private undergraduate colleges: 498
Here:
56.1%
Georgia:
17.1%
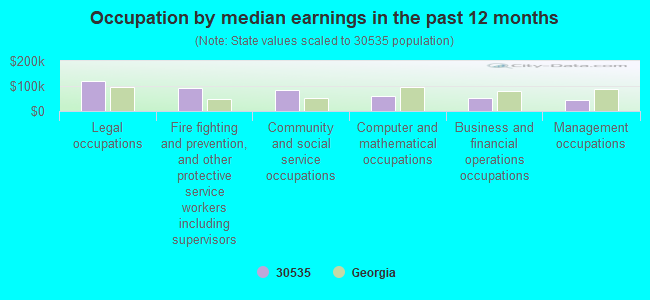
Occupation by median earnings in the past 12 months ($)
120,318Legal occupations
92,460Fire fighting and prevention, and other protective service workers including supervisors
82,179Community and social service occupations
61,704Computer and mathematical occupations
53,521Business and financial operations occupations
45,688Management occupations
Top industries in this zip code by the number of employees in 2005:
Health Care and Social Assistance: General Medical and Surgical Hospitals (500-999 employees: 1 establishment)
Educational Services: Colleges, Universities, and Professional Schools (250-499: 1)
Administrative and Support and Waste Management and Remediation Services: Temporary Help Services (100-249: 1)
Health Care and Social Assistance: Offices of Physicians (except Mental Health Specialists) (10-19: 1, 5-9: 7, 1-4: 10)
Construction: Plumbing, Heating, and Air-Conditioning Contractors (20-49: 2, 1-4: 2)
Accommodation and Food Services: Food Service Contractors (20-49: 1, 1-4: 1)
Health Care and Social Assistance: Child Day Care Services (10-19: 1, 5-9: 1, 1-4: 2)
Other Services (except Public Administration): Religious Organizations (10-19: 1, 1-4: 5)
Construction: New Single-Family Housing Construction (except Operative Builders) (5-9: 1, 1-4: 6)
Accommodation and Food Services: Limited-Service Restaurants (10-19: 1, 1-4: 2)
People in group quarters in 2010:
434 people in college/university student housing
People in group quarters in 2000:
311 people in college dormitories (includes college quarters off campus)
113 people in nursing homes
Fatal accident statistics in 2014:
Fatal accident count: 1
Vehicles involved in fatal accidents: 2
Fatal accidents caused by drunken drivers: 1
Fatalities: 1
Persons involved in fatal accidents: 3
Pedestrians involved in fatal accidents: 0
Fatal accident statistics in 2013:
Fatal accident count: 2
Vehicles involved in fatal accidents: 2
Fatal accidents caused by drunken drivers: 2
Fatalities: 2
Persons involved in fatal accidents: 2
Pedestrians involved in fatal accidents: 0
2007 - 2018 National Fire Incident Reporting System (NFIRS) incidents
According to the data from the years 2007 - 2018 the average number of fire incidents per year is 26. The highest number of reported fire incidents - 53 took place in 2015, and the least - 0 in 2009. The data has a rising trend.
When looking into fire subcategories, the most reports belonged to: Structure Fires (45.2%), and Outside Fires (41.3%).
Fire incident types reported to NFIRS in Zip Code 30535
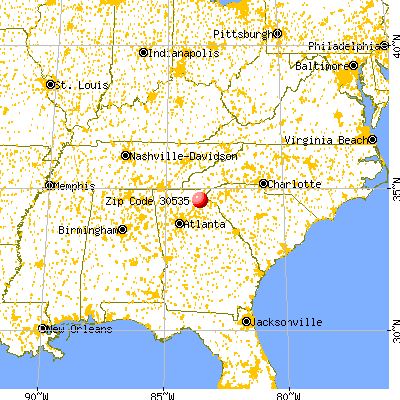


 Nearest zip codes: 30531, 30563, 30510, 30523, 30511, 30571.
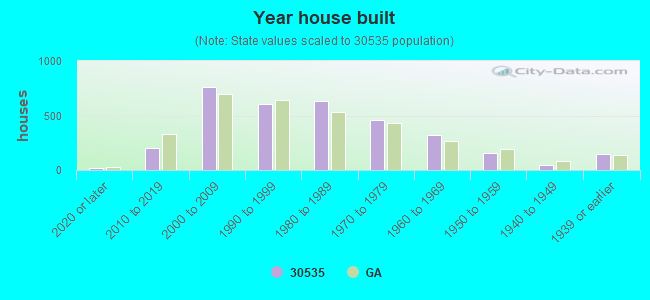


 According to the data from the years 2007 - 2018 the average number of fire incidents per year is 26. The highest number of reported fire incidents - 53 took place in 2015, and the least - 0 in 2009. The data has a rising trend.
 When looking into fire subcategories, the most reports belonged to: Structure Fires (45.2%), and Outside Fires (41.3%).