Estimated zip code population in 2022: 2,286 Zip code population in 2010: 2,438 Zip code population in 2000: 2,647
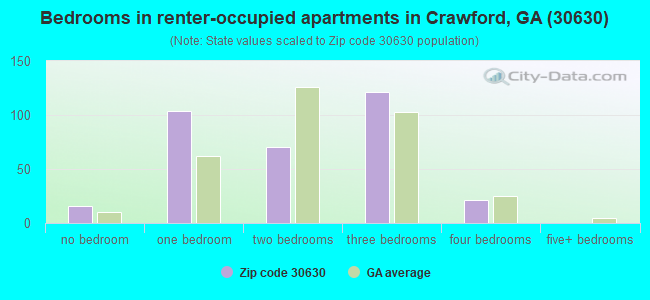
Houses and condos: 1,039 Renter-occupied apartments: 330
% of renters here:
38%
State:
34%
March 2022 cost of living index in zip code 30630: 82.0 (low, U.S. average is 100)
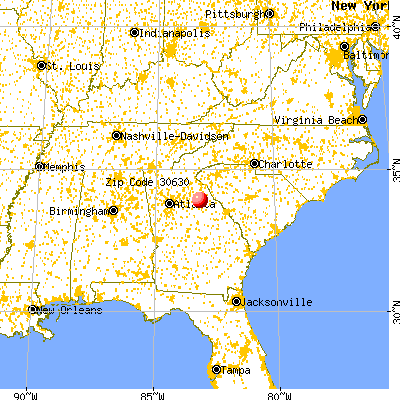
Land area: 36.4 sq. mi. Water area: 0.3 sq. mi.
Population density: 63 people per square mile
(very low).
OSM Map
General Map
Google Map
MSN Map
OSM Map
General Map
Google Map
MSN Map
OSM Map
General Map
Google Map
MSN Map
OSM Map
General Map
Google Map
MSN Map
Please wait while loading the map...
Real estate property taxes paid for housing units in 2022:
This zip code:
0.8% ($1,551)
Georgia:
0.7% ($2,160)
Median real estate property taxes paid for housing units with mortgages in 2022: $1,931 (0.9%) Median real estate property taxes paid for housing units with no mortgage in 2022: $1,403 (0.7%)
Business Search- 14 Million verified businesses
Males: 1,008
(44.1%)
Females: 1,279
(55.9%)
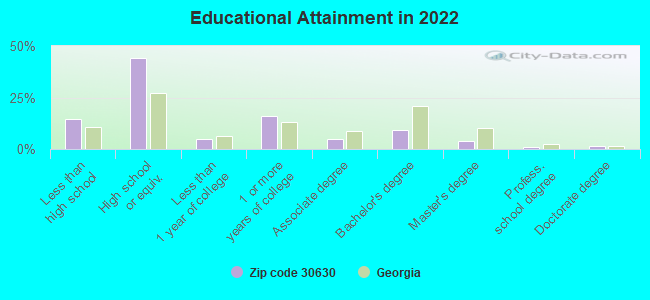
For population 25 years and over in 30630:
High school or higher: 84.4%
Bachelor's degree or higher: 15.2%
Graduate or professional degree: 6.2%
Unemployed: 0.7%
Mean travel time to work (commute): 34.9 minutes
For population 15 years and over in 30630:
Never married: 33.4%
Now married: 45.5%
Separated: 3.0%
Widowed: 9.7%
Divorced: 8.5%
Zip code 30630 compared to state average:
Median household income below state average.
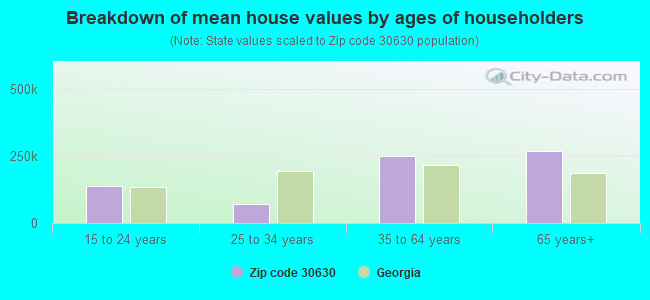
Median house value below state average.
Unemployed percentage significantly below state average.
Hispanic race population percentage below state average.
Foreign-born population percentage significantly below state average.
Length of stay since moving in significantly above state average.
Percentage of population with a bachelor's degree or higher below state average.
Averages for the 2020 tax year for zip code 30630, filed in 2021:
Average Adjusted Gross Income (AGI) in 2020: $44,581 (Individual Income Tax Returns)
Here:
$44,581
State:
$70,847
Salary/wage: $38,976 (reported on 80.5% of returns)
Here:
$38,976
State:
$59,126
(% of AGI for various income ranges: 1316.8% for AGIs below $25k, 3967.6% for AGIs $25k-50k, 5970.0% for AGIs $50k-75k, 9126.7% for AGIs $75k-100k, 18058.0% for AGIs $100k-200k)
Taxable interest for individuals: $836 (reported on 19.5% of returns)
This zip code:
$836
Georgia:
$2,011
(% of AGI for various income ranges: 16.8% for AGIs below $25k, 3.6% for AGIs $25k-50k, 8.2% for AGIs $50k-75k, 13.3% for AGIs $75k-100k, 202.0% for AGIs $100k-200k)
Ordinary dividends: $2,922 (reported on 8.0% of returns)
Here:
$2,922
State:
$8,996
(% of AGI for various income ranges: 8.2% for AGIs below $25k, 64.5% for AGIs $50k-75k, 328.0% for AGIs $100k-200k)
Net capital gain/loss in AGI: +$14,222 (reported on 8.0% of returns)
Here:
+$14,222
State:
+$28,402
(% of AGI for various income ranges: 7.6% for AGIs below $25k, 108.2% for AGIs $50k-75k, 2270.0% for AGIs $100k-200k)
Profit/loss from business: +$3,565 (reported on 17.7% of returns)
Here:
+$3,565
State:
+$6,707
(% of AGI for various income ranges: 101.2% for AGIs below $25k, 6.8% for AGIs $25k-50k, 140.0% for AGIs $50k-75k, 396.0% for AGIs $100k-200k)
Taxable individual retirement arrangement distribution: $9,633 (reported on 5.3% of returns)
30630:
$9,633
Georgia:
$20,525
(% of AGI for various income ranges: 55.3% for AGIs below $25k, 650.0% for AGIs $75k-100k)
Total itemized deductions: $24,525 (reported on 3.5% of returns)
Here:
$24,525
State:
$34,001
(% of AGI for various income ranges: 1962.0% for AGIs $100k-200k)
Charity contributions: $8,533 (reported on 2.7% of returns)
Here:
$8,533
State:
$14,164
(% of AGI for various income ranges: 426.7% for AGIs $75k-100k)
Taxes paid: $6,325 (reported on 3.5% of returns)
30630:
$6,325
State:
$7,540
(% of AGI for various income ranges: 506.0% for AGIs $100k-200k)
Earned income credit: $2,607 (reported on 26.5% of returns)
Here:
$2,607
State:
$2,530
(% of AGI for various income ranges: 142.1% for AGIs below $25k, 119.6% for AGIs $25k-50k)
Percentage of individuals using paid preparers for their 2020 taxes: 92.0%
Here:
92%
State:
93%
(% for various income ranges: 91.1% for AGIs below $25k, 91.2% for AGIs $25k-50k, 92.9% for AGIs $50k-75k, 100.0% for AGIs $75k-100k, 90.9% for AGIs $100k-200k)
Averages for the 2012 tax year for zip code 30630, filed in 2013:
Average Adjusted Gross Income (AGI) in 2012: $37,889 (Individual Income Tax Returns)
Here:
$37,889
State:
$56,131
Salary/wage: $33,216 (reported on 81.4% of returns)
Here:
$33,216
State:
$47,942
(% of AGI for various income ranges: 76.2% for AGIs below $25k, 83.0% for AGIs $25k-50k, 71.4% for AGIs $50k-75k, 78.5% for AGIs $75k-100k, 53.4% for AGIs $100k-200k)
Taxable interest for individuals: $771 (reported on 21.6% of returns)
This zip code:
$771
Georgia:
$1,706
(% of AGI for various income ranges: 0.6% for AGIs below $25k, 0.6% for AGIs $25k-50k, 0.4% for AGIs $50k-75k, 0.4% for AGIs $75k-100k, 0.2% for AGIs $100k-200k)
Ordinary dividends: $1,733 (reported on 9.3% of returns)
Here:
$1,733
State:
$7,265
(% of AGI for various income ranges: 0.4% for AGIs $25k-50k, 1.0% for AGIs $50k-75k, 0.5% for AGIs $100k-200k)
Net capital gain/loss in AGI: +$3,143 (reported on 7.2% of returns)
Here:
+$3,143
State:
+$16,323
(% of AGI for various income ranges: 0.9% for AGIs $50k-75k, 1.7% for AGIs $100k-200k)
Profit/loss from business: +$5,526 (reported on 19.6% of returns)
Here:
+$5,526
State:
+$7,583
(% of AGI for various income ranges: 8.4% for AGIs below $25k, 2.1% for AGIs $25k-50k, 1.6% for AGIs $50k-75k, 2.5% for AGIs $100k-200k)
Taxable individual retirement arrangement distribution: $9,900 (reported on 8.2% of returns)
30630:
$9,900
Georgia:
$17,199
Total itemized deductions: $16,670 (25% of AGI, reported on 27.8% of returns)
Here:
$16,670
State:
$23,886
Here:
24.6% of AGI
State:
21.5% of AGI
(% of AGI for various income ranges: 5.7% for AGIs below $25k, 13.1% for AGIs $25k-50k, 12.7% for AGIs $50k-75k, 13.5% for AGIs $75k-100k, 14.6% for AGIs $100k-200k)
Charity contributions: $4,145 (reported on 20.6% of returns)
Here:
$4,145
State:
$5,507
(% of AGI for various income ranges: 2.3% for AGIs $25k-50k, 1.6% for AGIs $50k-75k, 2.5% for AGIs $75k-100k, 4.0% for AGIs $100k-200k)
Taxes paid: $4,689 (reported on 27.8% of returns)
30630:
$4,689
State:
$7,838
(% of AGI for various income ranges: 0.9% for AGIs below $25k, 2.7% for AGIs $25k-50k, 3.3% for AGIs $50k-75k, 4.2% for AGIs $75k-100k, 5.5% for AGIs $100k-200k)
Earned income credit: $2,755 (reported on 29.9% of returns)
Here:
$2,755
State:
$2,589
(% of AGI for various income ranges: 10.7% for AGIs below $25k, 1.8% for AGIs $25k-50k)
Percentage of individuals using paid preparers for their 2012 taxes: 53.6%
Here:
54%
State:
55%
(% for various income ranges: 50.0% for AGIs below $25k, 53.8% for AGIs $25k-50k, 61.5% for AGIs $50k-75k, 60.0% for AGIs $75k-100k, 57.1% for AGIs $100k-200k)
Averages for the 2004 tax year for zip code 30630, filed in 2005:
Average Adjusted Gross Income (AGI) in 2004: $33,314 (Individual Income Tax Returns)
Here:
$33,314
State:
$47,553
Salary/wage: $30,030 (reported on 87.2% of returns)
Here:
$30,030
State:
$42,178
(% of AGI for various income ranges: 119.0% for AGIs below $10k, 82.1% for AGIs $10k-25k, 85.5% for AGIs $25k-50k, 80.6% for AGIs $50k-75k, 78.8% for AGIs $75k-100k, 44.4% for AGIs over 100k)
Taxable interest for individuals: $1,000 (reported on 29.7% of returns)
This zip code:
$1,000
Georgia:
$1,772
(% of AGI for various income ranges: 3.9% for AGIs below $10k, 1.2% for AGIs $10k-25k, 0.6% for AGIs $25k-50k, 0.5% for AGIs $50k-75k, 0.7% for AGIs $75k-100k, 1.7% for AGIs over 100k)
Taxable dividends: $1,486 (reported on 14.5% of returns)
Here:
$1,486
State:
$4,283
(% of AGI for various income ranges: 2.7% for AGIs below $10k, 0.9% for AGIs $10k-25k, 0.4% for AGIs $25k-50k, 0.1% for AGIs $50k-75k, 0.4% for AGIs $75k-100k, 1.8% for AGIs over 100k)
Net capital gain/loss: +$9,514 (reported on 10.7% of returns)
Here:
+$9,514
State:
+$16,461
(% of AGI for various income ranges: -3.1% for AGIs below $10k, 0.3% for AGIs $10k-25k, 0.4% for AGIs $25k-50k, 0.8% for AGIs $50k-75k, 0.7% for AGIs $75k-100k, 22.2% for AGIs over 100k)
Profit/loss from business: +$7,165 (reported on 17.4% of returns)
Here:
+$7,165
State:
+$8,201
(% of AGI for various income ranges: 20.1% for AGIs below $10k, 5.0% for AGIs $10k-25k, 1.8% for AGIs $25k-50k, 4.8% for AGIs $50k-75k, 3.4% for AGIs $75k-100k, 2.0% for AGIs over 100k)
Profit/loss from farming: +$447 (reported on 3.9% of returns)
Here:
+$447
State:
-$6,357
IRA payment deduction: $2,400 (reported on 1.5% of returns)
30630:
$2,400
Georgia:
$2,969
Total itemized deductions: $15,778 (27% of AGI, reported on 28.5% of returns)
Here:
$15,778
State:
$19,944
Here:
26.7% of AGI
State:
22.6% of AGI
(% of AGI for various income ranges: 9.0% for AGIs $10k-25k, 12.9% for AGIs $25k-50k, 15.6% for AGIs $50k-75k, 15.7% for AGIs $75k-100k, 16.0% for AGIs over 100k)
Charity contributions deductions: $3,169 (5% of AGI, reported on 25.4% of returns)
Here:
$3,169
State:
$4,354
Here:
5.3% of AGI
State:
4.7% of AGI
(% of AGI for various income ranges: 1.3% for AGIs $10k-25k, 1.9% for AGIs $25k-50k, 2.2% for AGIs $50k-75k, 3.9% for AGIs $75k-100k, 3.9% for AGIs over 100k)
Total tax: $3,718 (reported on 70.7% of returns)
30630:
$3,718
State:
$8,223
(% of AGI for various income ranges: 3.9% for AGIs below $10k, 3.7% for AGIs $10k-25k, 6.2% for AGIs $25k-50k, 8.3% for AGIs $50k-75k, 10.5% for AGIs $75k-100k, 13.9% for AGIs over 100k)
Earned income credit: $1,961 (reported on 26.4% of returns)
Here:
$1,961
State:
$1,986
Percentage of individuals using paid preparers for their 2004 taxes: 65.4%
Here:
65%
State:
62%
(% for various income ranges: 66.5% for AGIs below $10k, 64.3% for AGIs $10k-25k, 60.6% for AGIs $25k-50k, 73.6% for AGIs $50k-75k, 64.5% for AGIs $75k-100k, 78.6% for AGIs over 100k)
Notable locations in zip code 30630: Jefferson Mill (A), Crawford Volunteer Fire Department (B), Devil's Pond Volunteer Fire Department (C). Display/hide their locations on the map
Churches in zip code 30630 include: Crawford Methodist Church (A), Crawford Baptist Church (B), Mount Olive Church (C), Mount Pleasant Church (D), New Zion Church (E), Edwards Church (F), Clouds Creek Church (G), Welcome Avenue Church (H). Display/hide their locations on the map
In group quarters: 125 (-1 institutionalized population)
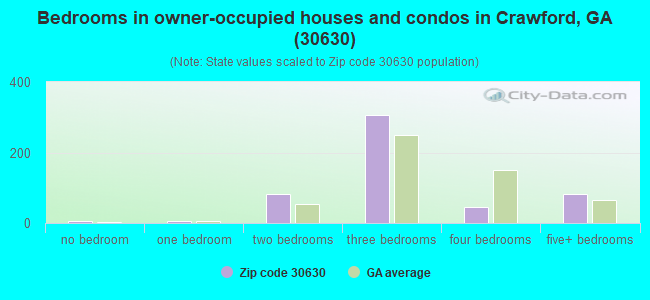
Size of family households: 241 2-persons, 169 3-persons, 138 4-persons, 18 5-persons, 5 6-persons
Size of nonfamily households: 267 1-person, 20 2-persons
287 married couples with children.
261 single-parent households (261 women).
97.3% of residents of 30630 zip code speak English at home.
0.1% of residents speak Spanish at home (100% not well).
2.3% of residents speak other Indo-European language at home (100% very well).
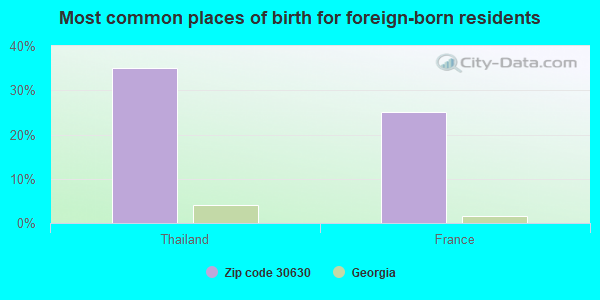
Foreign born population: 20 (0.9%) (37.2% of them are naturalized citizens)
This zip code:
0.9%
Whole state:
10.7%
35%Thailand
25%France
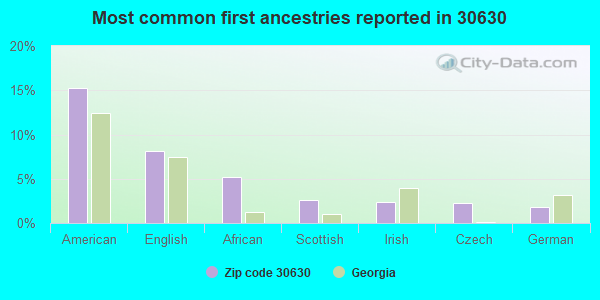
15%American
8%English
5%African
3%Scottish
2%Irish
2%Czech
2%German
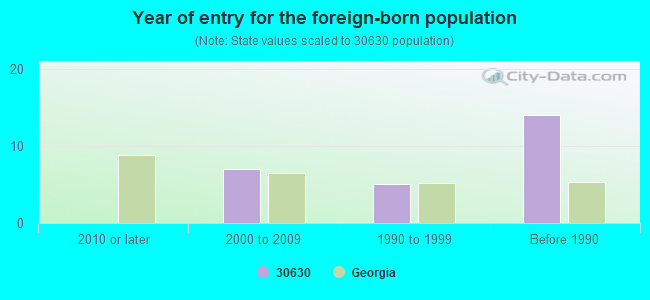
Year of entry for the foreign-born population
02010 or later
72000 to 2009
51990 to 1999
14Before 1990
Facilities with environmental interests located in this zip code:
JEFFERSON MILLS INC (NORTH ST. in CRAWFORD, GA)
AIR MINOR (AIRS/AFS) Business SIC classification: BROADWOVEN FABRIC MILLS, COTTON
Housing units lacking complete plumbing facilities: 9.5% Housing units lacking complete kitchen facilities: 10.5%
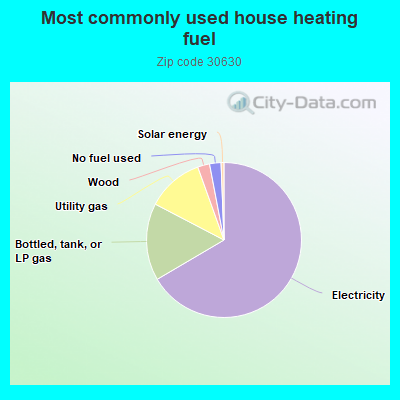
66.8%Electricity
16.2%Bottled, tank, or LP gas
11.9%Utility gas
2.5%Wood
2.4%No fuel used
0.6%Solar energy
Population in 1990: 2,883.
Place of birth for U.S.-born residents:
This state: 1,898
Northeast: 42
Midwest: 70
South: 144
West: 78
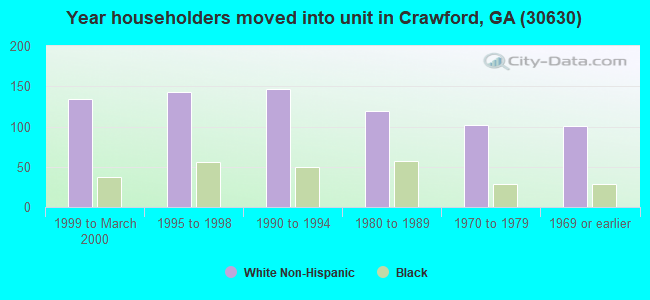
65% of the 30630 zip code residents lived in the same house 5 years ago. Out of people who lived in different houses, 48% lived in this county. Out of people who lived in different counties, 50% lived in Georgia.
94% of the 30630 zip code residents lived in the same house 1 year ago. Out of people who lived in different houses, 33% moved from this county. Out of people who lived in different houses, 66% moved from different county within same state.
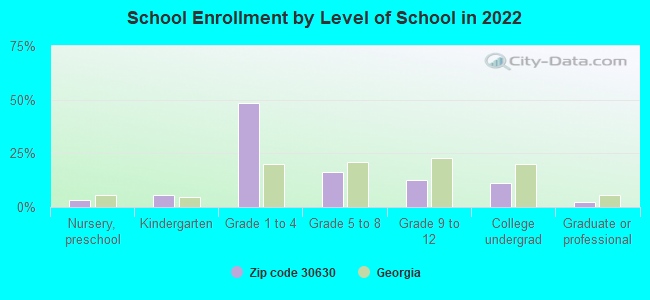
Private vs. public school enrollment:
Students in private schools in grades 1 to 8 (elementary and middle school): 10
Here:
2.9%
Georgia:
12.1%
Students in private schools in grades 9 to 12 (high school):
Here:
1.4%
Georgia:
10.8%
Students in private undergraduate colleges:
Here:
0.0%
Georgia:
17.1%
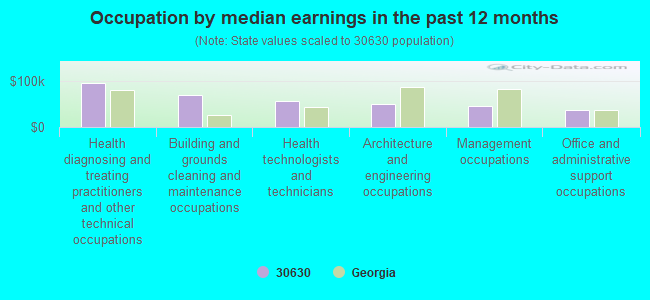
Occupation by median earnings in the past 12 months ($)
95,313Health diagnosing and treating practitioners and other technical occupations
69,404Building and grounds cleaning and maintenance occupations
55,972Health technologists and technicians
50,531Architecture and engineering occupations
45,588Management occupations
37,692Office and administrative support occupations
Companies with federal contracts located in this zip code:
PATTON MECHANICAL INC (851 COMER RD in CRAWFORD, GA; small business)
$12,300 with Navy for Maintenance, Repair or Alteration of Real Property -- Sewage and Waste Facilities. Signed on 2000-07-17. Completion date: 2000-08-25.
Top industries in this zip code by the number of employees in 2005:
Construction: All Other Specialty Trade Contractors (50-99 employees: 1 establishment)
Health Care and Social Assistance: Nursing Care Facilities (50-99: 1)
Finance and Insurance: Commercial Banking (20-49: 1)
Construction: Site Preparation Contractors (10-19: 1, 1-4: 1)
Accommodation and Food Services: Limited-Service Restaurants (10-19: 1)
Professional, Scientific, and Technical Services: Veterinary Services (10-19: 1)
Educational Services: Fine Arts Schools (10-19: 1)
People in group quarters in 2010:
61 people in nursing facilities/skilled-nursing facilities
57 people in local jails and other municipal confinement facilities
6 people in group homes intended for adults
People in group quarters in 2000:
63 people in other noninstitutional group quarters
22 people in nursing homes
Fatal accident statistics in 2014:
Fatal accident count: 1
Vehicles involved in fatal accidents: 1
Fatal accidents caused by drunken drivers: 0
Fatalities: 1
Persons involved in fatal accidents: 1
Pedestrians involved in fatal accidents: 0
Fatal accident statistics in 2011:
Fatal accident count: 1
Vehicles involved in fatal accidents: 2
Fatal accidents caused by drunken drivers: 0
Fatalities: 2
Persons involved in fatal accidents: 3
Pedestrians involved in fatal accidents: 0
2003 - 2018 National Fire Incident Reporting System (NFIRS) incidents
Based on the data from the years 2003 - 2018 the average number of fire incidents per year is 9. The highest number of reported fires - 19 took place in 2016, and the least - 2 in 2003. The data has a growing trend.
When looking into fire subcategories, the most reports belonged to: Structure Fires (53.7%), and Outside Fires (32.0%).
Fire incident types reported to NFIRS in Zip Code 30630


+$447
-$6,357
 Nearest zip codes: 30648, 30619, 30683, 30628, 30667, 30629.


 Based on the data from the years 2003 - 2018 the average number of fire incidents per year is 9. The highest number of reported fires - 19 took place in 2016, and the least - 2 in 2003. The data has a growing trend.
 When looking into fire subcategories, the most reports belonged to: Structure Fires (53.7%), and Outside Fires (32.0%).