Estimated zip code population in 2022: 6,763 Zip code population in 2010: 6,153 Zip code population in 2000: 5,497
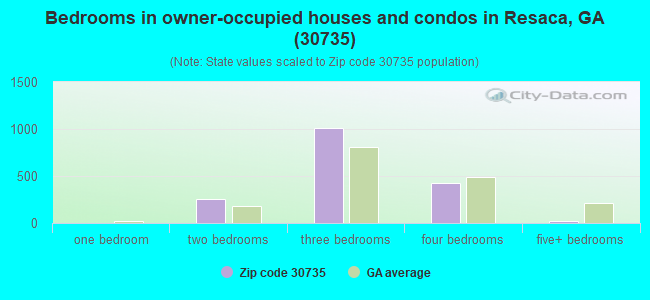
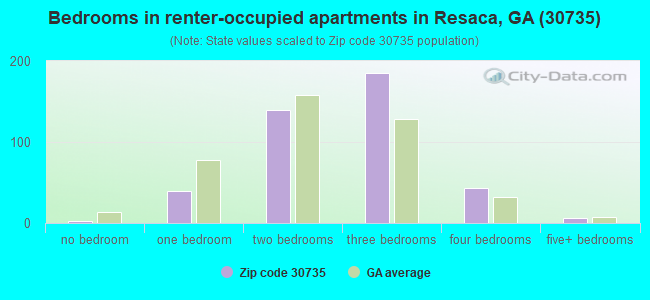
Houses and condos: 2,438 Renter-occupied apartments: 415
% of renters here:
19%
State:
34%
March 2022 cost of living index in zip code 30735: 81.1 (low, U.S. average is 100)
Land area: 62.3 sq. mi. Water area: 0.6 sq. mi.
Population density: 109 people per square mile
(very low).
OSM Map
General Map
Google Map
MSN Map
OSM Map
General Map
Google Map
MSN Map
OSM Map
General Map
Google Map
MSN Map
OSM Map
General Map
Google Map
MSN Map
Please wait while loading the map...
Real estate property taxes paid for housing units in 2022:
This zip code:
0.7% ($1,076)
Georgia:
0.7% ($2,160)
Median real estate property taxes paid for housing units with mortgages in 2022: $1,357 (0.8%) Median real estate property taxes paid for housing units with no mortgage in 2022: $614 (0.4%)
Business Search- 14 Million verified businesses
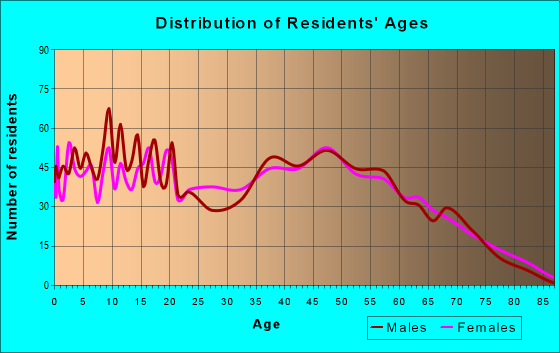
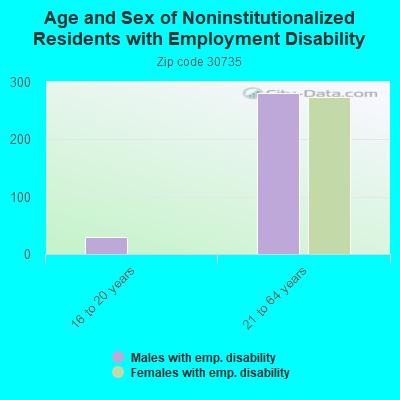
Males: 3,281
(48.5%)
Females: 3,481
(51.5%)
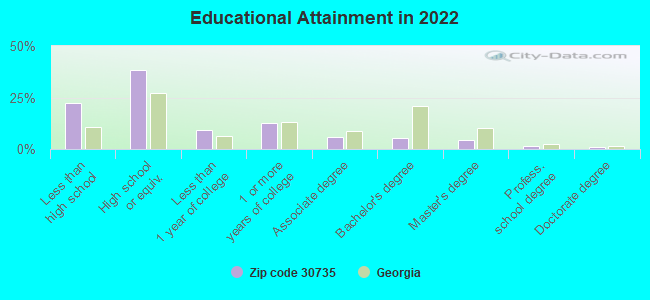
For population 25 years and over in 30735:
High school or higher: 76.3%
Bachelor's degree or higher: 12.3%
Graduate or professional degree: 6.8%
Unemployed: 5.6%
Mean travel time to work (commute): 24.7 minutes
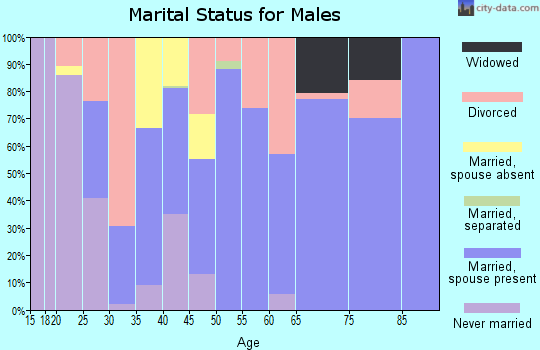
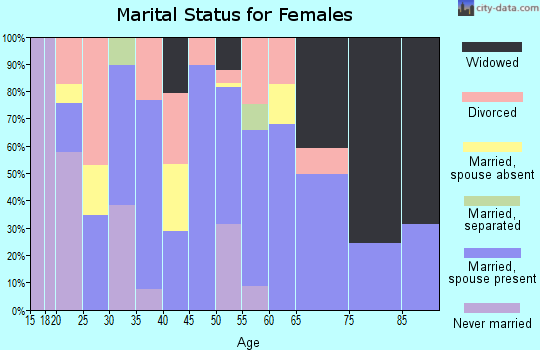
For population 15 years and over in 30735:
Never married: 21.0%
Now married: 54.5%
Separated: 1.7%
Widowed: 11.5%
Divorced: 11.2%
Zip code 30735 compared to state average:
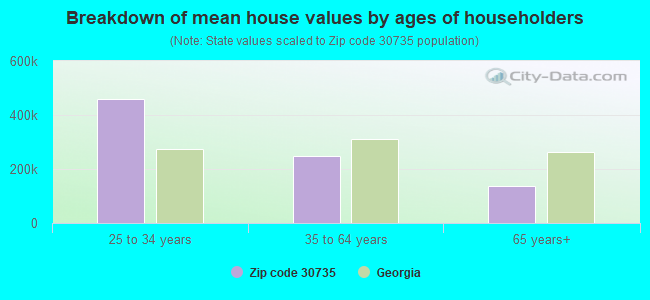
Median house value below state average.
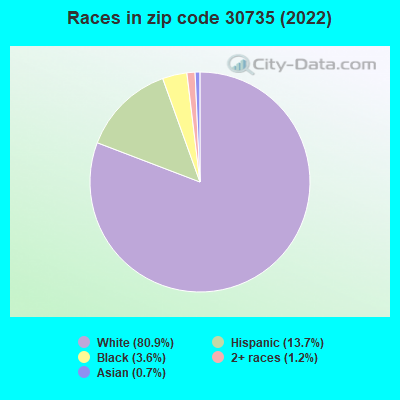
Black race population percentage significantly below state average.
Median age above state average.
Foreign-born population percentage below state average.
Renting percentage below state average.
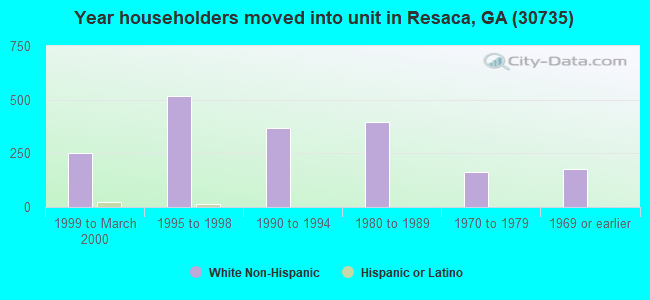
Length of stay since moving in significantly above state average.
Number of college students below state average.
Percentage of population with a bachelor's degree or higher significantly below state average.
Averages for the 2020 tax year for zip code 30735, filed in 2021:
Average Adjusted Gross Income (AGI) in 2020: $43,548 (Individual Income Tax Returns)
Here:
$43,548
State:
$70,847
Salary/wage: $38,596 (reported on 86.2% of returns)
Here:
$38,596
State:
$59,126
(% of AGI for various income ranges: 1191.6% for AGIs below $25k, 3858.0% for AGIs $25k-50k, 6517.7% for AGIs $50k-75k, 10219.2% for AGIs $75k-100k, 18071.8% for AGIs $100k-200k)
Taxable interest for individuals: $847 (reported on 12.6% of returns)
This zip code:
$847
Georgia:
$2,011
(% of AGI for various income ranges: 6.6% for AGIs below $25k, 5.9% for AGIs $25k-50k, 22.7% for AGIs $50k-75k, 12.5% for AGIs $75k-100k, 97.3% for AGIs $100k-200k)
Ordinary dividends: $3,636 (reported on 4.3% of returns)
Here:
$3,636
State:
$8,996
(% of AGI for various income ranges: 2.8% for AGIs below $25k, 30.0% for AGIs $50k-75k, 39.2% for AGIs $75k-100k, 230.9% for AGIs $100k-200k)
Net capital gain/loss in AGI: +$9,040 (reported on 5.9% of returns)
Here:
+$9,040
State:
+$28,402
(% of AGI for various income ranges: 1.5% for AGIs below $25k, 19.4% for AGIs $25k-50k, 165.4% for AGIs $50k-75k, 710.0% for AGIs $100k-200k)
Profit/loss from business: +$8,054 (reported on 14.6% of returns)
Here:
+$8,054
State:
+$6,707
(% of AGI for various income ranges: 141.5% for AGIs below $25k, 141.3% for AGIs $25k-50k, 165.4% for AGIs $50k-75k, 480.0% for AGIs $100k-200k)
Taxable individual retirement arrangement distribution: $13,510 (reported on 3.9% of returns)
30735:
$13,510
Georgia:
$20,525
(% of AGI for various income ranges: 31.9% for AGIs below $25k, 54.9% for AGIs $25k-50k, 613.3% for AGIs $75k-100k)
Total itemized deductions: $28,200 (reported on 3.1% of returns)
Here:
$28,200
State:
$34,001
(% of AGI for various income ranges: 73.6% for AGIs below $25k, 184.6% for AGIs $50k-75k, 1119.1% for AGIs $100k-200k)
Charity contributions: $9,329 (reported on 2.8% of returns)
Here:
$9,329
State:
$14,164
(% of AGI for various income ranges: 41.9% for AGIs $25k-50k, 330.9% for AGIs $100k-200k)
Taxes paid: $6,138 (reported on 3.1% of returns)
30735:
$6,138
State:
$7,540
(% of AGI for various income ranges: 10.7% for AGIs below $25k, 43.1% for AGIs $50k-75k, 272.7% for AGIs $100k-200k)
Earned income credit: $2,411 (reported on 28.0% of returns)
Here:
$2,411
State:
$2,530
(% of AGI for various income ranges: 128.9% for AGIs below $25k, 109.9% for AGIs $25k-50k)
Percentage of individuals using paid preparers for their 2020 taxes: 94.1%
Here:
94%
State:
93%
(% for various income ranges: 93.6% for AGIs below $25k, 94.3% for AGIs $25k-50k, 94.3% for AGIs $50k-75k, 94.4% for AGIs $75k-100k, 94.4% for AGIs $100k-200k, 100.0% for AGIs over 200k)
Averages for the 2012 tax year for zip code 30735, filed in 2013:
Average Adjusted Gross Income (AGI) in 2012: $35,606 (Individual Income Tax Returns)
Here:
$35,606
State:
$56,131
Salary/wage: $33,155 (reported on 88.5% of returns)
Here:
$33,155
State:
$47,942
(% of AGI for various income ranges: 78.6% for AGIs below $25k, 90.9% for AGIs $25k-50k, 85.3% for AGIs $50k-75k, 83.8% for AGIs $75k-100k, 65.3% for AGIs $100k-200k)
Taxable interest for individuals: $617 (reported on 14.3% of returns)
This zip code:
$617
Georgia:
$1,706
(% of AGI for various income ranges: 0.4% for AGIs below $25k, 0.3% for AGIs $25k-50k, 0.2% for AGIs $50k-75k, 0.2% for AGIs $75k-100k, 0.2% for AGIs $100k-200k)
Ordinary dividends: $1,425 (reported on 4.9% of returns)
Here:
$1,425
State:
$7,265
(% of AGI for various income ranges: 0.1% for AGIs below $25k, 0.3% for AGIs $50k-75k, 0.7% for AGIs $100k-200k)
Net capital gain/loss in AGI: +$1,238 (reported on 3.3% of returns)
Here:
+$1,238
State:
+$16,323
(% of AGI for various income ranges: 1.1% for AGIs $75k-100k)
Profit/loss from business: +$7,361 (reported on 15.6% of returns)
Here:
+$7,361
State:
+$7,583
(% of AGI for various income ranges: 10.7% for AGIs below $25k, 1.7% for AGIs $25k-50k, 2.2% for AGIs $50k-75k, 2.2% for AGIs $75k-100k, 0.9% for AGIs $100k-200k)
Taxable individual retirement arrangement distribution: $9,436 (reported on 4.5% of returns)
30735:
$9,436
Georgia:
$17,199
(% of AGI for various income ranges: 1.7% for AGIs below $25k, 1.2% for AGIs $25k-50k, 3.8% for AGIs $75k-100k)
Total itemized deductions: $17,149 (24% of AGI, reported on 18.4% of returns)
Here:
$17,149
State:
$23,886
Here:
24.1% of AGI
State:
21.5% of AGI
(% of AGI for various income ranges: 4.3% for AGIs below $25k, 6.3% for AGIs $25k-50k, 10.9% for AGIs $50k-75k, 11.7% for AGIs $75k-100k, 13.4% for AGIs $100k-200k)
Charity contributions: $4,049 (reported on 14.3% of returns)
Here:
$4,049
State:
$5,507
(% of AGI for various income ranges: 0.5% for AGIs below $25k, 0.8% for AGIs $25k-50k, 2.2% for AGIs $50k-75k, 3.0% for AGIs $75k-100k, 2.5% for AGIs $100k-200k)
Taxes paid: $4,527 (reported on 18.4% of returns)
30735:
$4,527
State:
$7,838
(% of AGI for various income ranges: 0.5% for AGIs below $25k, 1.2% for AGIs $25k-50k, 2.7% for AGIs $50k-75k, 3.6% for AGIs $75k-100k, 4.8% for AGIs $100k-200k)
Earned income credit: $2,565 (reported on 32.4% of returns)
Here:
$2,565
State:
$2,589
(% of AGI for various income ranges: 10.0% for AGIs below $25k, 2.1% for AGIs $25k-50k)
Percentage of individuals using paid preparers for their 2012 taxes: 61.1%
Here:
61%
State:
55%
(% for various income ranges: 59.5% for AGIs below $25k, 63.3% for AGIs $25k-50k, 58.1% for AGIs $50k-75k, 64.3% for AGIs $75k-100k, 66.7% for AGIs $100k-200k)
Averages for the 2004 tax year for zip code 30735, filed in 2005:
Average Adjusted Gross Income (AGI) in 2004: $32,159 (Individual Income Tax Returns)
Here:
$32,159
State:
$47,553
Salary/wage: $30,644 (reported on 90.6% of returns)
Here:
$30,644
State:
$42,178
(% of AGI for various income ranges: 122.5% for AGIs below $10k, 85.9% for AGIs $10k-25k, 91.3% for AGIs $25k-50k, 89.2% for AGIs $50k-75k, 86.0% for AGIs $75k-100k, 58.0% for AGIs over 100k)
Taxable interest for individuals: $1,078 (reported on 21.7% of returns)
This zip code:
$1,078
Georgia:
$1,772
(% of AGI for various income ranges: 3.2% for AGIs below $10k, 1.0% for AGIs $10k-25k, 0.4% for AGIs $25k-50k, 0.4% for AGIs $50k-75k, 0.2% for AGIs $75k-100k, 2.3% for AGIs over 100k)
Taxable dividends: $1,261 (reported on 6.2% of returns)
Here:
$1,261
State:
$4,283
(% of AGI for various income ranges: 0.4% for AGIs below $10k, 0.1% for AGIs $10k-25k, 0.1% for AGIs $25k-50k, 0.2% for AGIs $50k-75k, 0.2% for AGIs $75k-100k, 1.1% for AGIs over 100k)
Net capital gain/loss: +$5,588 (reported on 5.8% of returns)
Here:
+$5,588
State:
+$16,461
(% of AGI for various income ranges: -1.0% for AGIs below $10k, 0.1% for AGIs $10k-25k, 0.1% for AGIs $25k-50k, 0.7% for AGIs $50k-75k, 1.4% for AGIs $75k-100k, 5.9% for AGIs over 100k)
Profit/loss from business: +$6,856 (reported on 14.3% of returns)
Here:
+$6,856
State:
+$8,201
(% of AGI for various income ranges: 15.1% for AGIs below $10k, 7.8% for AGIs $10k-25k, 3.2% for AGIs $25k-50k, 1.9% for AGIs $50k-75k, -1.0% for AGIs $75k-100k)
IRA payment deduction: $2,818 (reported on 0.4% of returns)
30735:
$2,818
Georgia:
$2,969
Total itemized deductions: $14,404 (24% of AGI, reported on 21.1% of returns)
Here:
$14,404
State:
$19,944
Here:
24.0% of AGI
State:
22.6% of AGI
(% of AGI for various income ranges: 5.9% for AGIs below $10k, 4.5% for AGIs $10k-25k, 8.3% for AGIs $25k-50k, 10.9% for AGIs $50k-75k, 13.0% for AGIs $75k-100k, 14.1% for AGIs over 100k)
Charity contributions deductions: $3,328 (5% of AGI, reported on 16.4% of returns)
Here:
$3,328
State:
$4,354
Here:
5.3% of AGI
State:
4.7% of AGI
(% of AGI for various income ranges: 0.9% for AGIs $10k-25k, 1.2% for AGIs $25k-50k, 1.9% for AGIs $50k-75k, 3.1% for AGIs $75k-100k, 2.8% for AGIs over 100k)
Total tax: $3,598 (reported on 69.0% of returns)
30735:
$3,598
State:
$8,223
(% of AGI for various income ranges: 4.3% for AGIs below $10k, 3.9% for AGIs $10k-25k, 5.9% for AGIs $25k-50k, 8.0% for AGIs $50k-75k, 10.5% for AGIs $75k-100k, 16.5% for AGIs over 100k)
Earned income credit: $1,843 (reported on 27.1% of returns)
Here:
$1,843
State:
$1,986
Percentage of individuals using paid preparers for their 2004 taxes: 67.3%
Here:
67%
State:
62%
(% for various income ranges: 60.6% for AGIs below $10k, 69.8% for AGIs $10k-25k, 70.5% for AGIs $25k-50k, 65.1% for AGIs $50k-75k, 63.3% for AGIs $75k-100k, 68.5% for AGIs over 100k)
Notable locations in zip code 30735: Gordon County Fire / Rescue Department Station 11Nickelsville (A), Gordon County Fire / Rescue Department Station 5 Resaca (B), Whitfield County Fire Department Station 5 Carbondale (C). Display/hide their locations on the map
Churches in zip code 30735 include: Beulah Land Church (A), Faith Tabernacle (B), Holy Hills Church (C), Jesus Church (D), Resaca Church (E), Hill City Baptist Church (F), Canaanland Church (G), Pine Chapel (H), Mount Zion Church (I). Display/hide their locations on the map
Streams, rivers, and creeks: Polecat Creek (A), Noblet Creek (B), Howell Creek (C), Dry Creek (D), Conasauga River (E), Blue Springs Creek (F), Jackson Branch (G), Coosawattee River (H). Display/hide their locations on the map
In group quarters: 4 (-1 institutionalized population)
Size of family households: 805 2-persons, 279 3-persons, 431 4-persons, 127 5-persons, 94 6-persons, 81 7-or-more-persons
Size of nonfamily households: 318 1-person, 5 2-persons
984 married couples with children.
368 single-parent households (66 men, 302 women).
87.0% of residents of 30735 zip code speak English at home.
10.6% of residents speak Spanish at home (69% very well, 12% well, 9% not well, 9% not at all).
1.3% of residents speak other Indo-European language at home (67% very well, 33% well).
0.9% of residents speak Asian or Pacific Island language at home (67% very well, 33% well).
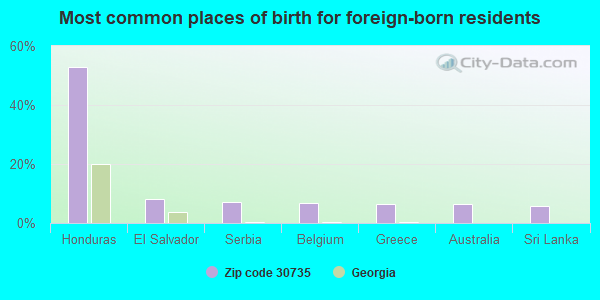
Foreign born population: 308 (4.6%) (25.2% of them are naturalized citizens)
This zip code:
4.6%
Whole state:
10.7%
53%Honduras
8%El Salvador
7%Serbia
7%Belgium
6%Greece
6%Australia
6%Sri Lanka
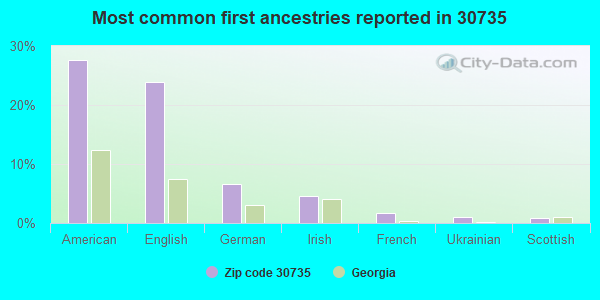
28%American
24%English
7%German
5%Irish
2%French
1%Ukrainian
1%Scottish
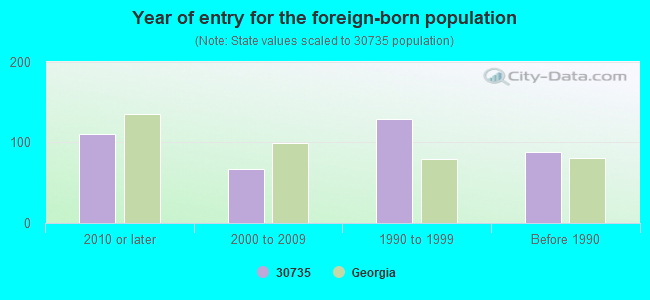
Year of entry for the foreign-born population
1102010 or later
672000 to 2009
1291990 to 1999
88Before 1990
Facilities with environmental interests located in this zip code:
NORTH GEORGIA READYMIX CONCRETE COMPANY INCORPORATED (I-75 & GA HWY 136 in RESACA, GA)
AIR MINOR (AIRS/AFS) ENFORCEMENT/COMPLIANCE ACTIVITY (Integrated Compliance Information System) - ICIS-04-2004-9917, FORMAL ENFORCEMENT ACTION (Integrated Compliance Information System) - ICIS-04-2004-9917, FORMAL ENFORCEMENT ACTION Business SIC classification: READY-MIXED CONCRETE Alternative names: NORTH GEORGIA READY MIX
CALHOUN #2 METER STATION (INTERSEC HWY 136 & HUDGE R in RESACA, GA)
Small Quantity Generators, between 100 kg and 1000 kg of hazardous waste/month (Resource Conservation and Recovery Act (tracking hazardous waste)) Organizations: SOUTHERN NATURAL GAS CO (CONTACT/OPERATOR)
Housing units lacking complete plumbing facilities: 5.3% Housing units lacking complete kitchen facilities: 6.0%
71.7%Electricity
17.9%Bottled, tank, or LP gas
6.2%Utility gas
2.0%Wood
1.5%Other fuel
0.8%No fuel used
Population in 1990: 2,926. Population change in the 1990s: +2,571 (+87.9%).
Place of birth for U.S.-born residents:
This state: 4,938
Northeast: 112
Midwest: 161
South: 954
West: 149
60% of the 30735 zip code residents lived in the same house 5 years ago. Out of people who lived in different houses, 48% lived in this county. Out of people who lived in different counties, 50% lived in Georgia.
96% of the 30735 zip code residents lived in the same house 1 year ago. Out of people who lived in different houses, 50% moved from this county. Out of people who lived in different houses, 49% moved from different county within same state. Out of people who lived in different houses, 4% moved from abroad.
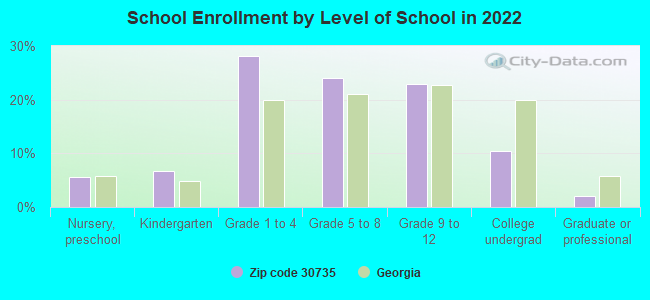
Private vs. public school enrollment:
Students in private schools in grades 1 to 8 (elementary and middle school): 50
Here:
5.8%
Georgia:
12.1%
Students in private schools in grades 9 to 12 (high school): 1
Here:
0.3%
Georgia:
10.8%
Students in private undergraduate colleges: 47
Here:
26.3%
Georgia:
17.1%
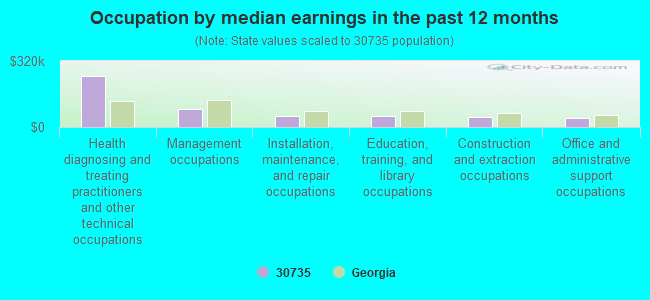
Occupation by median earnings in the past 12 months ($)
248,563Health diagnosing and treating practitioners and other technical occupations
86,141Management occupations
54,034Installation, maintenance, and repair occupations
53,776Education, training, and library occupations
49,823Construction and extraction occupations
42,065Office and administrative support occupations
Top industries in this zip code by the number of employees in 2005:
Wholesale Trade: Construction and Mining (except Oil Well) Machinery and Equipment Merchant Wholesalers (10-19 employees: 1 establishment)
Construction: Residential Remodelers (5-9: 1)
Other Services (except Public Administration): Political Organizations (5-9: 1)
Professional, Scientific, and Technical Services: Other Accounting Services (1-4: 1)
People in group quarters in 2010:
3 people in other noninstitutional facilities
People in group quarters in 2000:
8 people in religious group quarters
Fatal accident statistics in 2013:
Fatal accident count: 1
Vehicles involved in fatal accidents: 1
Fatal accidents caused by drunken drivers: 0
Fatalities: 1
Persons involved in fatal accidents: 1
Pedestrians involved in fatal accidents: 0
Fatal accident statistics in 2012:
Fatal accident count: 4
Vehicles involved in fatal accidents: 4
Fatal accidents caused by drunken drivers: 0
Fatalities: 4
Persons involved in fatal accidents: 7
Pedestrians involved in fatal accidents: 1
Home Mortgage Disclosure Act Aggregated Statistics For Year 2009 (Based on 4 partial tracts)
A) FHA, FSA/RHS & VA Home Purchase Loans
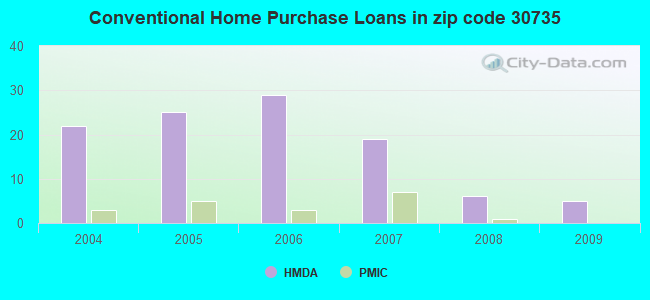
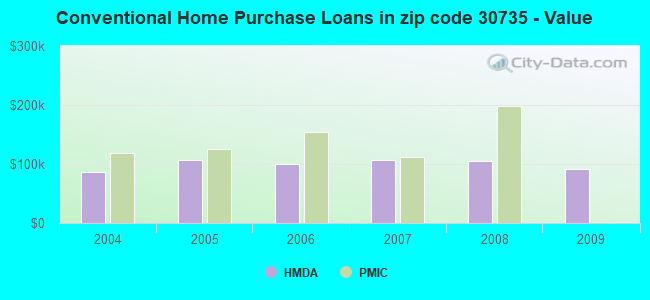
B) Conventional Home Purchase Loans
C) Refinancings
D) Home Improvement Loans
F) Non-occupant Loans on < 5 Family Dwellings (A B C & D)
G) Loans On Manufactured Home Dwelling (A B C & D)
Number
Average Value
Number
Average Value
Number
Average Value
Number
Average Value
Number
Average Value
Number
Average Value
LOANS ORIGINATED
5
$98,360
5
$91,046
28
$105,950
2
$19,515
8
$86,851
4
$51,382
APPLICATIONS APPROVED, NOT ACCEPTED
0
$0
0
$0
1
$93,700
0
$0
0
$0
0
$0
APPLICATIONS DENIED
2
$83,700
2
$107,475
18
$122,959
3
$19,400
1
$121,710
3
$59,047
APPLICATIONS WITHDRAWN
1
$84,180
2
$133,090
11
$142,634
0
$0
0
$0
1
$56,430
FILES CLOSED FOR INCOMPLETENESS
1
$74,270
0
$0
4
$140,708
0
$0
0
$0
0
$0
Aggregated Statistics For Year 2008 (Based on 4 partial tracts)
A) FHA, FSA/RHS & VA Home Purchase Loans
B) Conventional Home Purchase Loans
C) Refinancings
D) Home Improvement Loans
E) Loans on Dwellings For 5+ Families
F) Non-occupant Loans on < 5 Family Dwellings (A B C & D)
G) Loans On Manufactured Home Dwelling (A B C & D)
Number
Average Value
Number
Average Value
Number
Average Value
Number
Average Value
Number
Average Value
Number
Average Value
Number
Average Value
LOANS ORIGINATED
6
$110,087
6
$105,397
28
$121,810
3
$38,317
1
$178,360
8
$107,375
8
$65,682
APPLICATIONS APPROVED, NOT ACCEPTED
1
$66,580
2
$55,845
3
$107,583
1
$56,970
0
$0
0
$0
2
$56,940
APPLICATIONS DENIED
1
$135,300
3
$56,263
26
$109,744
5
$55,952
0
$0
2
$62,645
8
$61,956
APPLICATIONS WITHDRAWN
1
$146,080
1
$107,600
9
$110,218
1
$16,090
0
$0
0
$0
1
$76,050
FILES CLOSED FOR INCOMPLETENESS
0
$0
0
$0
2
$180,580
0
$0
0
$0
0
$0
0
$0
Aggregated Statistics For Year 2007 (Based on 4 partial tracts)
A) FHA, FSA/RHS & VA Home Purchase Loans
B) Conventional Home Purchase Loans
C) Refinancings
D) Home Improvement Loans
E) Loans on Dwellings For 5+ Families
F) Non-occupant Loans on < 5 Family Dwellings (A B C & D)
G) Loans On Manufactured Home Dwelling (A B C & D)
Number
Average Value
Number
Average Value
Number
Average Value
Number
Average Value
Number
Average Value
Number
Average Value
Number
Average Value
LOANS ORIGINATED
4
$123,728
19
$106,307
30
$117,763
7
$37,164
1
$231,310
8
$109,372
10
$63,622
APPLICATIONS APPROVED, NOT ACCEPTED
0
$0
3
$80,250
8
$79,746
1
$43,040
0
$0
0
$0
3
$50,287
APPLICATIONS DENIED
1
$157,620
7
$85,973
20
$115,341
6
$25,050
0
$0
1
$28,920
8
$60,452
APPLICATIONS WITHDRAWN
0
$0
1
$118,900
12
$115,035
1
$30,770
0
$0
1
$92,140
1
$112,030
FILES CLOSED FOR INCOMPLETENESS
0
$0
1
$118,390
5
$132,612
0
$0
0
$0
0
$0
0
$0
Aggregated Statistics For Year 2006 (Based on 4 partial tracts)
A) FHA, FSA/RHS & VA Home Purchase Loans
B) Conventional Home Purchase Loans
C) Refinancings
D) Home Improvement Loans
F) Non-occupant Loans on < 5 Family Dwellings (A B C & D)
G) Loans On Manufactured Home Dwelling (A B C & D)
Number
Average Value
Number
Average Value
Number
Average Value
Number
Average Value
Number
Average Value
Number
Average Value
LOANS ORIGINATED
5
$100,580
29
$99,396
41
$102,008
9
$49,516
12
$109,502
15
$65,406
APPLICATIONS APPROVED, NOT ACCEPTED
0
$0
5
$88,818
6
$92,187
2
$18,900
0
$0
3
$71,590
APPLICATIONS DENIED
1
$67,990
12
$71,117
31
$103,687
5
$39,086
3
$72,040
17
$56,218
APPLICATIONS WITHDRAWN
1
$118,340
2
$122,045
17
$119,804
0
$0
1
$46,740
2
$52,150
FILES CLOSED FOR INCOMPLETENESS
0
$0
0
$0
5
$113,118
0
$0
0
$0
0
$0
Aggregated Statistics For Year 2005 (Based on 4 partial tracts)
A) FHA, FSA/RHS & VA Home Purchase Loans
B) Conventional Home Purchase Loans
C) Refinancings
D) Home Improvement Loans
F) Non-occupant Loans on < 5 Family Dwellings (A B C & D)
G) Loans On Manufactured Home Dwelling (A B C & D)
Number
Average Value
Number
Average Value
Number
Average Value
Number
Average Value
Number
Average Value
Number
Average Value
LOANS ORIGINATED
2
$104,380
25
$105,990
35
$96,878
6
$37,360
8
$101,779
10
$57,417
APPLICATIONS APPROVED, NOT ACCEPTED
0
$0
6
$71,040
9
$87,958
1
$97,420
1
$60,100
5
$54,478
APPLICATIONS DENIED
2
$62,275
12
$71,250
27
$96,895
6
$35,525
2
$73,855
14
$50,674
APPLICATIONS WITHDRAWN
1
$134,280
4
$130,002
15
$104,656
3
$144,077
1
$96,620
2
$34,395
FILES CLOSED FOR INCOMPLETENESS
0
$0
2
$108,740
8
$99,720
0
$0
0
$0
1
$85,100
Aggregated Statistics For Year 2004 (Based on 4 partial tracts)
A) FHA, FSA/RHS & VA Home Purchase Loans
B) Conventional Home Purchase Loans
C) Refinancings
D) Home Improvement Loans
F) Non-occupant Loans on < 5 Family Dwellings (A B C & D)
G) Loans On Manufactured Home Dwelling (A B C & D)
Detailed PMIC statistics for the following Tracts:0015.00
, 0107.00
2002 - 2018 National Fire Incident Reporting System (NFIRS) incidents
Based on the data from the years 2002 - 2018 the average number of fires per year is 22. The highest number of reported fire incidents - 56 took place in 2016, and the least - 0 in 2006. The data has an increasing trend.
When looking into fire subcategories, the most reports belonged to: Outside Fires (51.4%), and Structure Fires (29.9%).
Fire incident types reported to NFIRS in Zip Code 30735


 Nearest zip codes: 30701, 30746, 30720, 30734, 30721, 30705.


 Based on the data from the years 2002 - 2018 the average number of fires per year is 22. The highest number of reported fire incidents - 56 took place in 2016, and the least - 0 in 2006. The data has an increasing trend.
 When looking into fire subcategories, the most reports belonged to: Outside Fires (51.4%), and Structure Fires (29.9%).