Estimated zip code population in 2022: 34,695 Zip code population in 2010: 33,965 Zip code population in 2000: 34,753
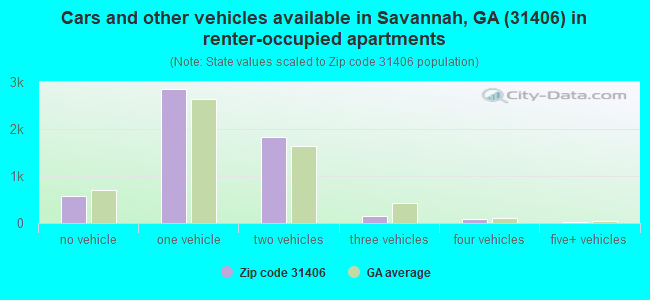
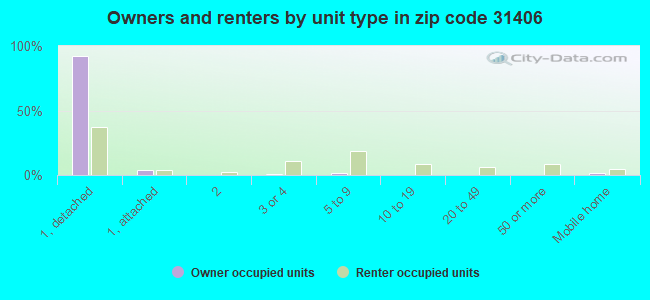
Houses and condos: 15,539 Renter-occupied apartments: 5,543
% of renters here:
39%
State:
34%
March 2022 cost of living index in zip code 31406: 93.9 (less than average, U.S. average is 100)
Land area: 25.7 sq. mi. Water area: 3.3 sq. mi.
Population density: 1,348 people per square mile
(low).
OSM Map
General Map
Google Map
MSN Map
OSM Map
General Map
Google Map
MSN Map
OSM Map
General Map
Google Map
MSN Map
OSM Map
General Map
Google Map
MSN Map
Please wait while loading the map...
Real estate property taxes paid for housing units in 2022:
This zip code:
0.8% ($2,397)
Georgia:
0.7% ($2,160)
Median real estate property taxes paid for housing units with mortgages in 2022: $2,645 (0.9%) Median real estate property taxes paid for housing units with no mortgage in 2022: $2,041 (0.7%)
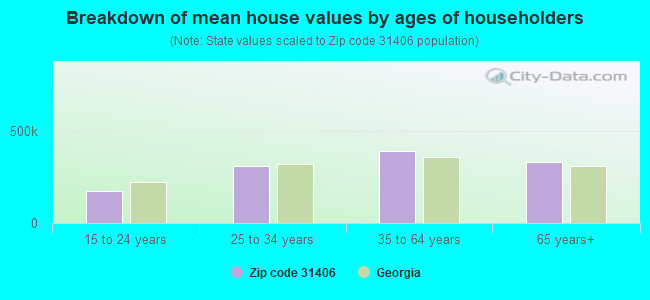
Estimated median house/condo value in 2022: $289,539
31406:
$289,539
Georgia:
$297,400
According to our research of Georgia and other state lists, there were 74 registered sex offenders living in 31406 zip code as of April 27, 2024. The ratio of all residents to sex offenders in zip code 31406 is 489 to 1. The ratio of registered sex offenders to all residents in this zip code is lower than the state average.
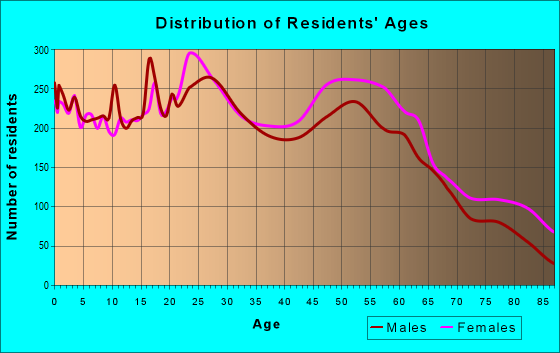
Median resident age:
This zip code:
37.4 years
Georgia median age:
37.6 years
Average household size:
This zip code:
2.4 people
Georgia:
2.6 people
Averages for the 2020 tax year for zip code 31406, filed in 2021:
Average Adjusted Gross Income (AGI) in 2020: $71,517 (Individual Income Tax Returns)
Here:
$71,517
State:
$70,847
Salary/wage: $51,391 (reported on 80.2% of returns)
Here:
$51,391
State:
$59,126
(% of AGI for various income ranges: 1185.5% for AGIs below $25k, 3516.7% for AGIs $25k-50k, 6574.9% for AGIs $50k-75k, 9483.2% for AGIs $75k-100k, 18487.8% for AGIs $100k-200k, 86028.6% for AGIs over 200k)
Taxable interest for individuals: $3,137 (reported on 24.1% of returns)
This zip code:
$3,137
Georgia:
$2,011
(% of AGI for various income ranges: 10.5% for AGIs below $25k, 16.9% for AGIs $25k-50k, 57.2% for AGIs $50k-75k, 107.1% for AGIs $75k-100k, 210.5% for AGIs $100k-200k, 3704.8% for AGIs over 200k)
Ordinary dividends: $10,191 (reported on 18.0% of returns)
Here:
$10,191
State:
$8,996
(% of AGI for various income ranges: 22.7% for AGIs below $25k, 35.1% for AGIs $25k-50k, 123.9% for AGIs $50k-75k, 275.9% for AGIs $75k-100k, 745.1% for AGIs $100k-200k, 8219.5% for AGIs over 200k)
Net capital gain/loss in AGI: +$38,310 (reported on 15.9% of returns)
Here:
+$38,310
State:
+$28,402
(% of AGI for various income ranges: 22.4% for AGIs below $25k, 29.8% for AGIs $25k-50k, 100.9% for AGIs $50k-75k, 257.4% for AGIs $75k-100k, 908.8% for AGIs $100k-200k, 40202.4% for AGIs over 200k)
Profit/loss from business: +$10,345 (reported on 18.3% of returns)
Here:
+$10,345
State:
+$6,707
(% of AGI for various income ranges: 120.8% for AGIs below $25k, 84.7% for AGIs $25k-50k, 164.1% for AGIs $50k-75k, 429.4% for AGIs $75k-100k, 554.6% for AGIs $100k-200k, 5876.7% for AGIs over 200k)
Taxable individual retirement arrangement distribution: $20,019 (reported on 8.0% of returns)
31406:
$20,019
Georgia:
$20,525
(% of AGI for various income ranges: 36.1% for AGIs below $25k, 77.9% for AGIs $25k-50k, 229.5% for AGIs $50k-75k, 433.2% for AGIs $75k-100k, 1135.4% for AGIs $100k-200k, 2836.2% for AGIs over 200k)
Self-employed (Keogh) retirement plans: $23,660 (reported on 0.6% of returns)
31406:
$23,660
Georgia:
$27,751
(% of AGI for various income ranges: 52.7% for AGIs $75k-100k, 961.0% for AGIs over 200k)
Total itemized deductions: $39,667 (reported on 11.3% of returns)
Here:
$39,667
State:
$34,001
(% of AGI for various income ranges: 49.9% for AGIs below $25k, 140.9% for AGIs $25k-50k, 450.3% for AGIs $50k-75k, 830.8% for AGIs $75k-100k, 2027.9% for AGIs $100k-200k, 17092.9% for AGIs over 200k)
Charity contributions: $18,893 (reported on 9.8% of returns)
Here:
$18,893
State:
$14,164
(% of AGI for various income ranges: 6.8% for AGIs below $25k, 32.4% for AGIs $25k-50k, 107.1% for AGIs $50k-75k, 195.5% for AGIs $75k-100k, 553.8% for AGIs $100k-200k, 9910.0% for AGIs over 200k)
Taxes paid: $7,496 (reported on 11.1% of returns)
31406:
$7,496
State:
$7,540
(% of AGI for various income ranges: 6.2% for AGIs below $25k, 25.8% for AGIs $25k-50k, 101.5% for AGIs $50k-75k, 211.1% for AGIs $75k-100k, 521.8% for AGIs $100k-200k, 2386.7% for AGIs over 200k)
Earned income credit: $2,422 (reported on 21.5% of returns)
Here:
$2,422
State:
$2,530
(% of AGI for various income ranges: 124.6% for AGIs below $25k, 82.1% for AGIs $25k-50k, 0.9% for AGIs $50k-75k)
Percentage of individuals using paid preparers for their 2020 taxes: 92.6%
Here:
93%
State:
93%
(% for various income ranges: 91.4% for AGIs below $25k, 93.1% for AGIs $25k-50k, 93.2% for AGIs $50k-75k, 91.2% for AGIs $75k-100k, 93.5% for AGIs $100k-200k, 96.4% for AGIs over 200k)
Averages for the 2012 tax year for zip code 31406, filed in 2013:
Average Adjusted Gross Income (AGI) in 2012: $55,470 (Individual Income Tax Returns)
Here:
$55,470
State:
$56,131
Salary/wage: $42,947 (reported on 83.1% of returns)
Here:
$42,947
State:
$47,942
(% of AGI for various income ranges: 79.4% for AGIs below $25k, 79.0% for AGIs $25k-50k, 71.6% for AGIs $50k-75k, 71.0% for AGIs $75k-100k, 67.7% for AGIs $100k-200k, 43.7% for AGIs over 200k)
Taxable interest for individuals: $2,679 (reported on 26.5% of returns)
This zip code:
$2,679
Georgia:
$1,706
(% of AGI for various income ranges: 0.9% for AGIs below $25k, 0.7% for AGIs $25k-50k, 0.9% for AGIs $50k-75k, 0.8% for AGIs $75k-100k, 1.0% for AGIs $100k-200k, 2.2% for AGIs over 200k)
Ordinary dividends: $7,787 (reported on 16.9% of returns)
Here:
$7,787
State:
$7,265
(% of AGI for various income ranges: 1.3% for AGIs below $25k, 1.0% for AGIs $25k-50k, 1.4% for AGIs $50k-75k, 1.5% for AGIs $75k-100k, 2.3% for AGIs $100k-200k, 4.2% for AGIs over 200k)
Net capital gain/loss in AGI: +$15,602 (reported on 13.3% of returns)
Here:
+$15,602
State:
+$16,323
(% of AGI for various income ranges: 0.2% for AGIs $25k-50k, 0.2% for AGIs $50k-75k, 0.8% for AGIs $75k-100k, 2.4% for AGIs $100k-200k, 10.5% for AGIs over 200k)
Profit/loss from business: +$11,004 (reported on 15.1% of returns)
Here:
+$11,004
State:
+$7,583
(% of AGI for various income ranges: 7.3% for AGIs below $25k, 2.4% for AGIs $25k-50k, 2.0% for AGIs $50k-75k, 2.2% for AGIs $75k-100k, 3.4% for AGIs $100k-200k, 2.3% for AGIs over 200k)
Taxable individual retirement arrangement distribution: $15,360 (reported on 9.3% of returns)
31406:
$15,360
Georgia:
$17,199
(% of AGI for various income ranges: 1.9% for AGIs below $25k, 2.3% for AGIs $25k-50k, 2.9% for AGIs $50k-75k, 3.2% for AGIs $75k-100k, 3.5% for AGIs $100k-200k, 2.0% for AGIs over 200k)
Self-employment retirement plans: $25,222 (reported on 0.6% of returns)
31406:
$25,222
Georgia:
$23,277
Total itemized deductions: $24,335 (21% of AGI, reported on 32.5% of returns)
Here:
$24,335
State:
$23,886
Here:
20.8% of AGI
State:
21.5% of AGI
(% of AGI for various income ranges: 8.7% for AGIs below $25k, 12.9% for AGIs $25k-50k, 15.4% for AGIs $50k-75k, 16.8% for AGIs $75k-100k, 17.2% for AGIs $100k-200k, 13.6% for AGIs over 200k)
Charity contributions: $5,792 (reported on 28.1% of returns)
Here:
$5,792
State:
$5,507
(% of AGI for various income ranges: 0.9% for AGIs below $25k, 2.1% for AGIs $25k-50k, 2.6% for AGIs $50k-75k, 3.4% for AGIs $75k-100k, 3.6% for AGIs $100k-200k, 3.6% for AGIs over 200k)
Taxes paid: $8,292 (reported on 32.3% of returns)
31406:
$8,292
State:
$7,838
(% of AGI for various income ranges: 1.3% for AGIs below $25k, 2.6% for AGIs $25k-50k, 4.2% for AGIs $50k-75k, 5.1% for AGIs $75k-100k, 6.3% for AGIs $100k-200k, 6.4% for AGIs over 200k)
Earned income credit: $2,443 (reported on 24.6% of returns)
Here:
$2,443
State:
$2,589
(% of AGI for various income ranges: 8.3% for AGIs below $25k, 1.2% for AGIs $25k-50k)
Percentage of individuals using paid preparers for their 2012 taxes: 49.3%
Here:
49%
State:
55%
(% for various income ranges: 42.7% for AGIs below $25k, 46.1% for AGIs $25k-50k, 53.9% for AGIs $50k-75k, 61.0% for AGIs $75k-100k, 65.6% for AGIs $100k-200k, 86.0% for AGIs over 200k)
Averages for the 2004 tax year for zip code 31406, filed in 2005:
Average Adjusted Gross Income (AGI) in 2004: $46,084 (Individual Income Tax Returns)
Here:
$46,084
State:
$47,553
Salary/wage: $39,757 (reported on 83.5% of returns)
Here:
$39,757
State:
$42,178
(% of AGI for various income ranges: 175.0% for AGIs below $10k, 80.0% for AGIs $10k-25k, 79.8% for AGIs $25k-50k, 76.6% for AGIs $50k-75k, 76.4% for AGIs $75k-100k, 60.2% for AGIs over 100k)
Taxable interest for individuals: $2,521 (reported on 35.8% of returns)
This zip code:
$2,521
Georgia:
$1,772
(% of AGI for various income ranges: 12.3% for AGIs below $10k, 2.0% for AGIs $10k-25k, 1.6% for AGIs $25k-50k, 1.6% for AGIs $50k-75k, 1.3% for AGIs $75k-100k, 2.1% for AGIs over 100k)
Taxable dividends: $4,219 (reported on 22.6% of returns)
Here:
$4,219
State:
$4,283
(% of AGI for various income ranges: 7.3% for AGIs below $10k, 1.4% for AGIs $10k-25k, 1.2% for AGIs $25k-50k, 1.4% for AGIs $50k-75k, 1.4% for AGIs $75k-100k, 3.0% for AGIs over 100k)
Net capital gain/loss: +$11,028 (reported on 17.7% of returns)
Here:
+$11,028
State:
+$16,461
(% of AGI for various income ranges: 1.2% for AGIs below $10k, 0.1% for AGIs $10k-25k, 0.5% for AGIs $25k-50k, 0.8% for AGIs $50k-75k, 1.4% for AGIs $75k-100k, 9.4% for AGIs over 100k)
Profit/loss from business: +$10,095 (reported on 13.9% of returns)
Here:
+$10,095
State:
+$8,201
(% of AGI for various income ranges: 6.2% for AGIs below $10k, 4.1% for AGIs $10k-25k, 1.9% for AGIs $25k-50k, 2.6% for AGIs $50k-75k, 3.1% for AGIs $75k-100k, 3.4% for AGIs over 100k)
IRA payment deduction: $3,006 (reported on 2.2% of returns)
31406:
$3,006
Georgia:
$2,969
(% of AGI for various income ranges: 0.2% for AGIs $10k-25k, 0.2% for AGIs $25k-50k, 0.2% for AGIs $50k-75k, 0.2% for AGIs $75k-100k, 0.1% for AGIs over 100k)
Self-employed pension: $15,172 (reported on 0.7% of returns)
Here:
$15,172
Georgia:
$16,203
Total itemized deductions: $19,626 (22% of AGI, reported on 36.0% of returns)
Here:
$19,626
State:
$19,944
Here:
21.9% of AGI
State:
22.6% of AGI
(% of AGI for various income ranges: 11.9% for AGIs below $10k, 9.0% for AGIs $10k-25k, 15.3% for AGIs $25k-50k, 17.2% for AGIs $50k-75k, 18.4% for AGIs $75k-100k, 15.4% for AGIs over 100k)
Charity contributions deductions: $4,743 (5% of AGI, reported on 33.0% of returns)
Here:
$4,743
State:
$4,354
Here:
5.1% of AGI
State:
4.7% of AGI
(% of AGI for various income ranges: 1.2% for AGIs below $10k, 1.4% for AGIs $10k-25k, 2.8% for AGIs $25k-50k, 3.5% for AGIs $50k-75k, 4.1% for AGIs $75k-100k, 4.0% for AGIs over 100k)
Total tax: $7,985 (reported on 71.4% of returns)
31406:
$7,985
State:
$8,223
(% of AGI for various income ranges: 4.1% for AGIs below $10k, 3.5% for AGIs $10k-25k, 6.6% for AGIs $25k-50k, 9.0% for AGIs $50k-75k, 10.2% for AGIs $75k-100k, 19.7% for AGIs over 100k)
Earned income credit: $1,918 (reported on 20.9% of returns)
Here:
$1,918
State:
$1,986
Percentage of individuals using paid preparers for their 2004 taxes: 59.9%
Here:
60%
State:
62%
(% for various income ranges: 54.2% for AGIs below $10k, 60.7% for AGIs $10k-25k, 57.2% for AGIs $25k-50k, 61.9% for AGIs $50k-75k, 61.8% for AGIs $75k-100k, 74.3% for AGIs over 100k)
Likely homosexual households (counted as self-reported same-sex unmarried-partner households)
Lesbian couples: 0.0% of all households
Gay men: 0.1% of all households
Household received Food Stamps/SNAP in the past 12 months: 1,894 Household did not receive Food Stamps/SNAP in the past 12 months: 12,386
Women who had a birth in the past 12 months: 529 (269 now married, 259 unmarried) Women who did not have a birth in the past 12 months: 8,969 (3,075 now married, 5,899 unmarried)
Housing units in zip code 31406 with a mortgage: 5,405 (437 second mortgage, 378 both second mortgage and home equity loan) Houses without a mortgage: 211
Median monthly owner costs for units with a mortgage: $1,685 Median monthly owner costs for units without a mortgage: $538
Residents with income below the poverty level in 2022:
This zip code:
12.8%
Whole state:
12.7%
Residents with income below 50% of the poverty level in 2022:
This zip code:
5.1%
Whole state:
6.3%
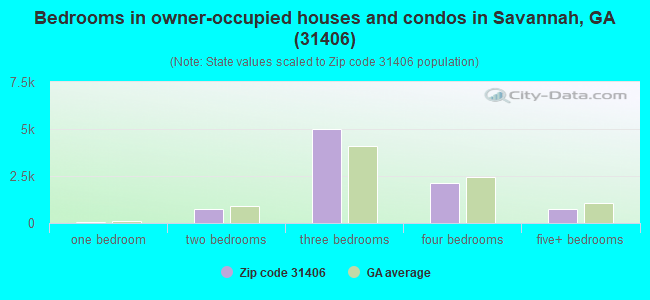
Median number of rooms in houses and condos:
Here:
6.6
State:
6.8
Median number of rooms in apartments:
Here:
4.5
State:
4.6
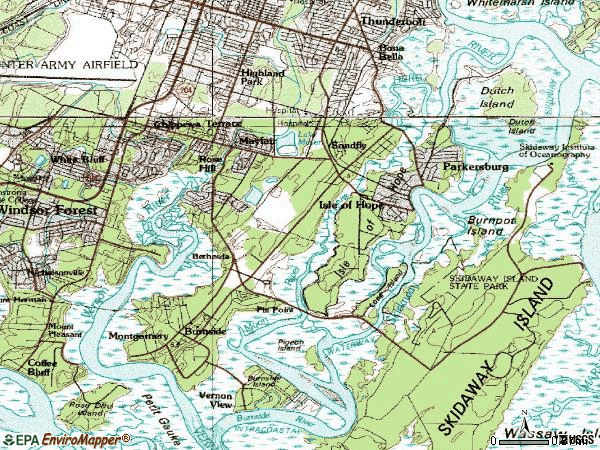
Notable locations in this zip code not listed on our city pages
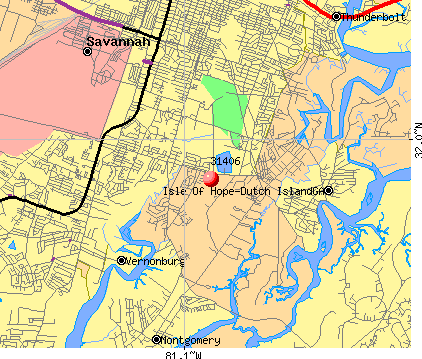
Notable locations in zip code 31406: Camp Strachan (A), Forest City Gun Club (B), Savannah Municipal Golf Course (C), Wormsloe Plantation (D), City of Savannah Wastewater Convergence Management (E), Bacon Park Golf Course (F), Jennifer Ross Soccer Complex (G), Savannah Fire Department Station 2 (H), Savannah Fire Department Station 7 (I), Isle of Hope Volunteer Fire Department (J), Southside Fire Department Station 6 (K), Azalealand Nursing Home (L), Saint Thomas Boys Home (M), Chatham County Building Safety and Regulatory Services (N), Bethesda Home for Boys (O), Riverview Health and Rehabilitation Center (P). Display/hide their locations on the map
Shopping Centers: Bacon Park Shopping Center (1), Chatham Plaza Shopping Center (2), Grove Park Plaza Shopping Center (3), Montgomery Crossroads Shopping Center (4), Oakhurst Shopping Center (5), Oglethorpe Mall Shopping Center (6), Tri-Roads Shopping Center (7), Live Oak Public Library System Oglethorpe Mall Branch (8). Display/hide their locations on the map
Churches in zip code 31406 include: Fellowship Church (A), Victory Church (B), Saint Thomas Church (C), Antioch Church (D), Cresthill Church (E), Temple Baptist Church (F), Savannah Community Church (G), Grace United Methodist Church (H), Evangelical Temple Full Gospel Church (I). Display/hide their locations on the map
Streams, rivers, and creeks: Shipyard Creek (A), Jones Narrows (B), Isle of Hope River (C), Haneys Creek (D), Grimball Creek (E), Friday Creek (F), The Branches (G), Moon River (H). Display/hide their locations on the map
Parks in zip code 31406 include: Bacon Park (1), Wormsloe State Historic Site (2), Isle of Hope Historic District (3), Lake Mayer Park (4), Butter Bean Beach (5), Memorial Stadium (6). Display/hide their locations on the map
3,653 married couples with children.
2,471 single-parent households (548 men, 1,923 women).
89.5% of residents of 31406 zip code speak English at home.
4.6% of residents speak Spanish at home (70% very well, 17% well, 13% not well, 1% not at all).
1.0% of residents speak other Indo-European language at home (82% very well, 18% well).
4.6% of residents speak Asian or Pacific Island language at home (61% very well, 27% well, 11% not well, 1% not at all).
0.2% of residents speak other language at home (57% very well, 43% well).
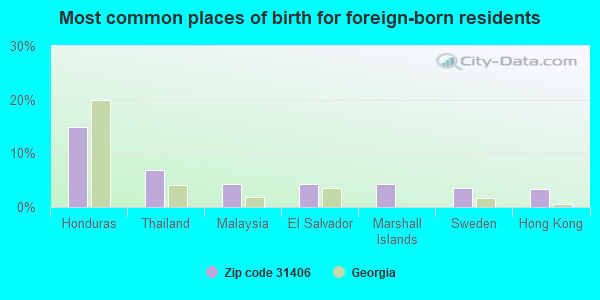
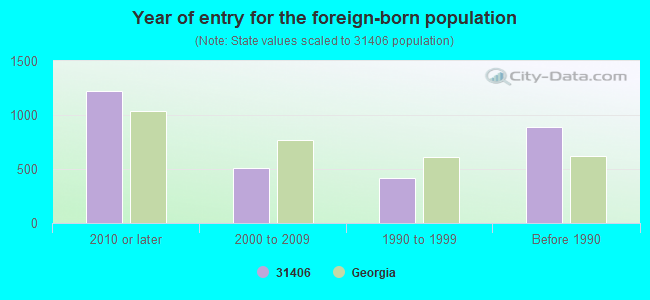
Foreign born population: 2,382 (6.9%) (51.9% of them are naturalized citizens)
Major facilities with environmental interests located in this zip code:
CHATHAM COUNTY MOSQUITO CONTROL (1321 EISENHOWER DR in SAVANNAH, GA)
STATE MASTER (Georgia's Geographic Environmental Information) - UST-1, UNDERGROUND STORAGE TANK PROGRAM, UST-2, UST-3, UST-4, UST-5, (Resource Conservation and Recovery Act (tracking hazardous waste)) Organizations: CHATHAM COUNTY COMMISSIONERS (CONTACT/OWNER)
, P&I SUPPLY CO, INC (INSTALLER)
ERTZBERGERS SERVICE CENTER (1170 E. DERENNE AVENUE in SAVANNAH, GA)
AIR MINOR (AIRS/AFS) STATE MASTER (Georgia's Geographic Environmental Information) - UST-1, UNDERGROUND STORAGE TANK PROGRAM, UST-2, UST-3, Business SIC classification: NONCLASSIFIABLE ESTABLISHMENTS Organizations: R G ERTZBERGER (CONTACT/OPERATOR)
PEP BOYS #129 (8702 ABERCORN ST in SAVANNAH, GA)
AIR MINOR (AIRS/AFS) (Integrated Compliance Information System) - ICIS-04-1999-0031, FORMAL ENFORCEMENT ACTION Conditionally Exempt Small Quantity Generators, less than 100 kg/month of hazardous waste (Resource Conservation and Recovery Act (tracking hazardous waste)) - notification Business SIC classification: GENERAL AUTOMOTIVE REPAIR SHOPS Organizations: THE PEP BOYS MANNY MOE & JACK (CONTACT/OWNER)
C&F AUTO REPAIR, INC (606 MALL BLVD in SAVANNAH, GA)
AIR MINOR (AIRS/AFS) (Integrated Compliance Information System) - ICIS-04-1999-0229, FORMAL ENFORCEMENT ACTION Business SIC classification: GENERAL AUTOMOTIVE REPAIR SHOPS
OLSON TOTAL CAR CARE (7010 ABERCORN ST in SAVANNAH, GA)
AIR MINOR (AIRS/AFS) (Integrated Compliance Information System) - ICIS-04-1999-0044, FORMAL ENFORCEMENT ACTION Business SIC classification: GENERAL AUTOMOTIVE REPAIR SHOPS
MALL AUTO REPAIR (76 W MONTGOMERY CROSSROADS in SAVANNAH, GA)
AIR MINOR (AIRS/AFS) (Integrated Compliance Information System) - ICIS-04-1999-0050, FORMAL ENFORCEMENT ACTION Business SIC classification: GENERAL AUTOMOTIVE REPAIR SHOPS
BARTLETT MIDDLE SCHOOL (207 MONTGOMERY CROSSROADS in SAVANNAH, GA)
(National Center for Education Statistics) - STATE ID-5050 Organizations: CHATHAM COUNTY (SCHOOL DISTRICT)
JENKINS HIGH SCHOOL (1800 EAST DERENNE AVENUE in SAVANNAH, GA)
(National Center for Education Statistics) - STATE ID-5060 Organizations: CHATHAM COUNTY (SCHOOL DISTRICT)
LARGO-TIBET ELEMENTARY SCHOOL (430 TIBET AVENUE in SAVANNAH, GA)
(National Center for Education Statistics) - STATE ID-2062 Organizations: CHATHAM COUNTY (SCHOOL DISTRICT)
MIXONS SMALL ENGINE SERVICE (1123 E MONTGOMERY CROSS RD in SAVANNAH, GA)
(Resource Conservation and Recovery Act (tracking hazardous waste)) Business NAICS classification: OTHER AUTOMOTIVE MECHANICAL AND ELECTRICAL REPAIR AND MAINTENANCE. Organizations: OPERNAME (CONTACT/OPERATOR)
, MIXON C L (CONTACT/OWNER)
ACME (5406 SKIDAWAY RD in SAVANNAH, GA)
(Resource Conservation and Recovery Act (tracking hazardous waste)) Organizations: OPERNAME (CONTACT/OPERATOR)
, WRENN DANA (CONTACT/OWNER)
AKINS & BOBB MOTORS (7510 WHITE BLUFF RD in SAVANNAH, GA)
(Resource Conservation and Recovery Act (tracking hazardous waste)) Organizations: OPERNAME (CONTACT/OPERATOR)
, GRIMM FRANK (CONTACT/OWNER)
AUTOVALET (7701 WATERS AVE in SAVANNAH, GA)
(Resource Conservation and Recovery Act (tracking hazardous waste)) Organizations: OPERNAME (CONTACT/OPERATOR)
, MOELLER ERIK (CONTACT/OWNER)
Housing units lacking complete plumbing facilities: 0.7% Housing units lacking complete kitchen facilities: 2.2%
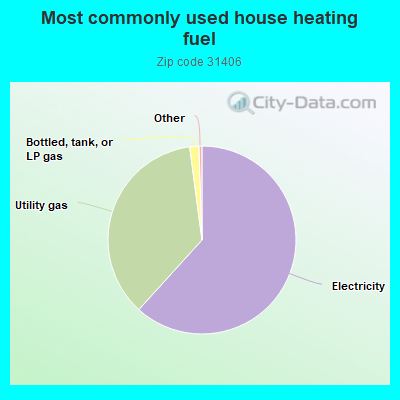
61.8%Electricity
36.2%Utility gas
1.6%Bottled, tank, or LP gas
Population in 1990: 34,024. Population change in the 1990s: +729 (+2.1%).
Place of birth for U.S.-born residents:
This state: 20,664
Northeast: 2,148
Midwest: 1,753
South: 6,021
West: 994
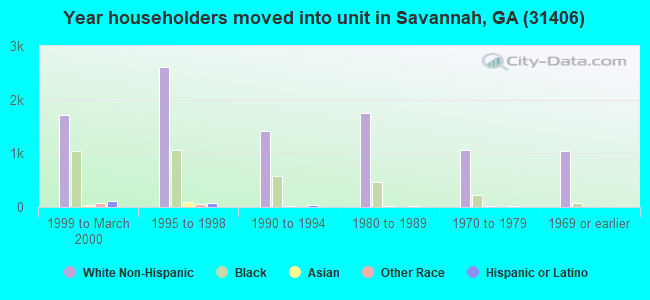
54% of the 31406 zip code residents lived in the same house 5 years ago. Out of people who lived in different houses, 60% lived in this county. Out of people who lived in different counties, 50% lived in Georgia.
86% of the 31406 zip code residents lived in the same house 1 year ago. Out of people who lived in different houses, 40% moved from this county. Out of people who lived in different houses, 16% moved from different county within same state. Out of people who lived in different houses, 43% moved from different state. Out of people who lived in different houses, 2% moved from abroad.
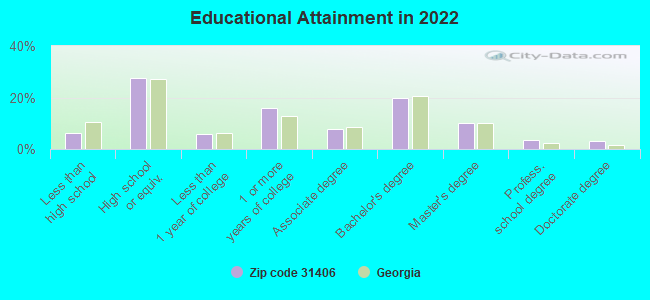
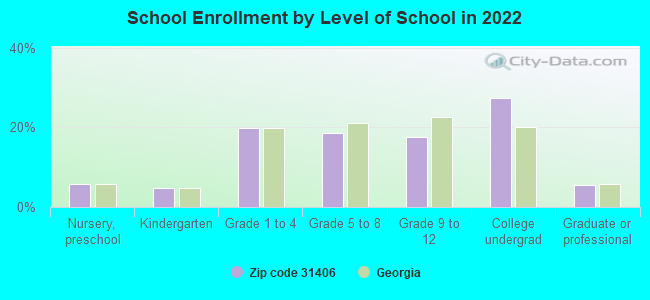
Private vs. public school enrollment:
Students in private schools in grades 1 to 8 (elementary and middle school): 670
Here:
20.7%
Georgia:
12.1%
Students in private schools in grades 9 to 12 (high school): 408
Here:
28.2%
Georgia:
10.8%
Students in private undergraduate colleges: 320
Here:
14.1%
Georgia:
17.1%
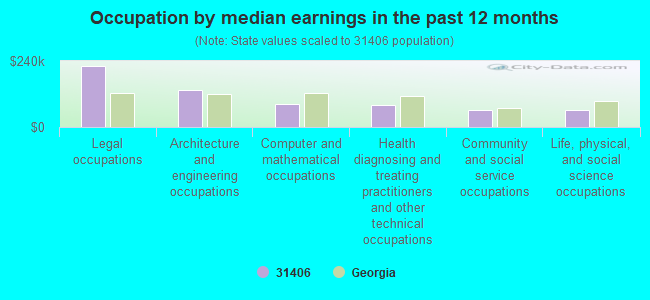
Occupation by median earnings in the past 12 months ($)
221,437Legal occupations
134,573Architecture and engineering occupations
85,159Computer and mathematical occupations
80,938Health diagnosing and treating practitioners and other technical occupations
61,836Community and social service occupations
61,278Life, physical, and social science occupations
Companies with biggest federal contracts located in this zip code (SAVANNAH, GA):
HUSSEY GAY BELL & DEYOUNG IN (329 COMMERCIAL DR STE 200) : $3,049,601 in 19 contractsfrom 2000 to 2005
Contracts for Other Architect and Engineering Services, Architect - Engineer Services (including landscaping, interior layout, and designing) by Army, Navy Signed by year:2000: $81,344; 2001: $0; 2002: $0; 2003: $1,449,482; 2004: $839,216; 2005: $679,559; 2006: $0.
Biggest contracts:
$1,163,917 with Army for Other Architect and Engineering Services. Signed on 2003-09-26. Completion date: 2004-06-25.
$552,820, same as above.Signed on 2005-02-04. Completion date: 2007-02-03.
$305,690, same as above.Signed on 2004-12-20. Completion date: 2005-12-19.
$181,556, same as above.Signed on 2003-09-30. Completion date: 2003-12-15.
SOUTHEASTERN SALES ENTERPRISES (5 CARDINAL ROAD; small business) : $1,923,101 in 138 contractsfrom 2000 to 2005
Contracts for Construction of Structures and Facilities -- Miscellaneous Buildings, Maintenance, Repair or Alteration of Real Property -- Miscellaneous Buildings, Maintenance, Repair or Alteration of Real Property -- Office Buildings, Construction of Structures and Facilities -- Family Housing Facilities by Army Signed by year:2000: $869,000; 2001: $0; 2002: $833,306; 2003: $187,459; 2004: $22,413; 2005: $10,923; 2006: $0.
Biggest contracts:
$869,000 with Army for Construction of Structures and Facilities -- Miscellaneous Buildings. Signed on 2000-09-27. Completion date: 2000-10-12.
$764,588 with Army for Maintenance, Repair or Alteration of Real Property -- Miscellaneous Buildings. Signed on 2002-11-15. Completion date: 2003-11-29.
$31,000, same as above.Signed on 2003-08-04. Completion date: 2004-02-02.
$10,923, same as above.Signed on 2005-01-27. Completion date: 2004-02-02.
INTERMARINE USA LLC (25 ECHOLS STREET; small business) 50 employees, $0 revenue. : $1,825,930 in 5 contractsfrom 2000 to 2002
Contracts for Minelayers And Minesweepers, Non-nuclear Ship Repair (East) Ship repair (including overhauls and conversions) performed on non-nuclear propelled and nonpropelled ships east of the 108th meridian, Maintenance, Repair and Rebuilding of Equipment -- Ships, Small Craft, Pontoons, and Floating Docks by Navy, U.S. Army Corps of Engineers - civil program financing only Signed by year:2000: $1,488,966; 2001: $29,258; 2002: $307,706; 2003: $0; 2004: $0; 2005: $0; 2006: $0.
Biggest contracts:
$1,500,000 with Navy for Minelayers And Minesweepers. Signed on 2000-06-14. Completion date: 1999-09-30.
$307,706 with U.S. Army Corps of Engineers - civil program financing only for Non-nuclear Ship Repair (East) Ship repair (including overhauls and conversions) performed on non-nuclear propelled and nonpropelled ships east of the 108th meridian. Signed on 2002-11-27. Completion date: 2002-12-24.
$29,258 with U.S. Army Corps of Engineers - civil program financing only for Maintenance, Repair and Rebuilding of Equipment -- Ships, Small Craft, Pontoons, and Floating Docks. Taking place in NC. Signed on 2001-04-30. Completion date: 2001-04-30.
$0 with U.S. Army Corps of Engineers - civil program financing only for Maintenance, Repair and Rebuilding of Equipment -- Ships, Small Craft, Pontoons, and Floating Docks. Signed on 2000-06-29. Completion date: 2000-05-18.
PORTMAN'S MUSIC INC (7650 ABERCORN ST; small business) : $780,784 in 6 contractsfrom 2003 to 2006
Contracts for Musical Instruments, Office Furniture by Army Signed by year:2000: $0; 2001: $0; 2002: $0; 2003: $141,342; 2004: $7,483; 2005: $0; 2006: $631,959.
Biggest contracts:
$631,959 with Army for Musical Instruments. Signed on 2006-03-09. Completion date: 2006-09-15.
$85,066 with Army for Office Furniture. Signed on 2003-07-17. Completion date: 2004-01-16.
$53,938 with Army for Musical Instruments. Signed on 2003-08-06. Completion date: 2003-08-31.
$4,758, same as above.Signed on 2004-09-16. Completion date: 2004-10-01.
CHARLES LANE CONSTRUCTION, INC (2121 EAST DERENNE AVE; small business) : $581,175 in 3 contractsfrom 2003 to 2004
$492,602 with Army for Construction of Structures and Facilities -- Other Administrative Facilities and Service Buildings. Signed on 2003-09-23. Completion date: 2004-03-24.
$85,459 with Army for Construction of Structures and Facilities -- Parking Facilities Conservation. Signed on 2004-02-11. Completion date: 2004-04-20.
$3,114 with Army for Construction of Structures and Facilities -- Other Administrative Facilities and Service Buildings. Signed on 2004-06-10. Completion date: 2004-03-24.
EAGLE ELECTRICAL & MECHANICAL (125 HOLCOMB ST; small business) : $574,095 in 36 contractsfrom 2000 to 2006
Contracts for Maintenance, Repair or Alteration of Real Property -- Other Administrative Facilities and Service Buildings, Maintenance, Repair or Alteration of Real Property -- Maintenance Buildings, Maintenance, Repair or Alteration of Real Property -- Other Utilities, Maintenance, Repair or Alteration of Real Property -- Other Industrial Buildings, and moreby Army, Public Buildings Service Signed by year:2000: $201,733; 2001: $39,132; 2002: $105,927; 2003: $99,888; 2004: $101,791; 2005: $23,424; 2006: $2,200.
Biggest contracts:
$72,868 with Army for Maintenance, Repair or Alteration of Real Property -- Other Administrative Facilities and Service Buildings. Signed on 2000-03-28. Completion date: 2000-06-30.
$57,848 with Army for Maintenance, Repair or Alteration of Real Property -- Maintenance Buildings. Signed on 2002-09-17. Completion date: 2002-11-26.
$55,105 with Army for Maintenance, Repair or Alteration of Real Property -- Other Utilities. Signed on 2004-08-17. Completion date: 2004-09-30.
$41,095 with Army for Maintenance, Repair or Alteration of Real Property -- Other Industrial Buildings. Signed on 2002-04-18. Completion date: 2002-08-23.
PATCOMP INC (51 WEST FAIRMONT AVENUE; small business) : $570,842 in 10 contractsfrom 1999 to 2005
Contracts for ADP Support Equipment, Maintenance, Repair and Rebuilding of Equipment -- Automatic Data Processing Equipment (Including Firmware), Software, Supplies and Support Equipment, Other ADP and Telecommunications Services (includes data storage on tapes, compact disks, etc.) by Army Signed by year:2000: $67,400; 2001: $45,000; 2002: $0; 2003: $2,695; 2004: $387,813; 2005: $284; 2006: $0.
Biggest contracts:
$387,813 with Army for ADP Support Equipment. Signed on 2004-11-30. Completion date: 2004-12-05.
$67,650 with Army for Maintenance, Repair and Rebuilding of Equipment -- Automatic Data Processing Equipment (Including Firmware), Software, Supplies and Support Equipment. Signed on 1999-12-08. Completion date: 2000-09-30.
$67,400, same as above.Signed on 2000-10-23. Completion date: 2001-09-30.
$45,000 with Army for Other ADP and Telecommunications Services (includes data storage on tapes, compact disks, etc.). Signed on 2001-08-10. Completion date: 2001-09-30.
REMOTE TECHNOLOGY INC (714 MALL BLVD; small business) : $488,616 in 6 contractsfrom 2004 to 2005
Contracts for Installation of Equipment -- Alarm, Signal, and Security Detection Systems, Communications Security Equipment and Components by U.S. Army Corps of Engineers - civil program financing only, Army Signed by year:2000: $0; 2001: $0; 2002: $0; 2003: $0; 2004: $12,240; 2005: $476,376; 2006: $0.
Biggest contracts:
$223,761 with U.S. Army Corps of Engineers - civil program financing only for Installation of Equipment -- Alarm, Signal, and Security Detection Systems. Taking place in SC. Signed on 2005-07-08. Completion date: 2005-09-15.
$223,761 with Army for Installation of Equipment -- Alarm, Signal, and Security Detection Systems. Taking place in SC. Signed on 2005-07-08. Completion date: 2005-09-15.
$14,427 with U.S. Army Corps of Engineers - civil program financing only for Installation of Equipment -- Alarm, Signal, and Security Detection Systems. Taking place in SC. Signed on 2005-09-01. Completion date: 2005-09-15.
$14,427 with Army for Installation of Equipment -- Alarm, Signal, and Security Detection Systems. Taking place in SC. Signed on 2005-09-01. Completion date: 2005-09-15.
ALLOY INDUSTRIAL CONTRACTORS, (9601 WHITFIELD AVENUE; small business) : $350,241 in 3 contractsfrom 2000 to 2004
$313,193 with Navy for Cranes and Crane-Shovels. Signed on 2000-09-29. Completion date: 2000-12-15.
$29,662, same as above.Signed on 2000-12-11. Completion date: 2001-06-30.
$7,386 with Army for Installation of Equipment -- Materials Handling Equipment. Signed on 2004-09-28. Completion date: 2004-11-08.
RESCUE TRAINING, INC (9 MALL TER; small business) : $315,614 in 27 contractsfrom 2002 to 2006
Contracts for Vocational/Technical, Other Education and Training Services, Other Administrative Support Services, Training/Curriculum Development, and moreby Army, U.S. Army Corps of Engineers - civil program financing only Signed by year:2000: $0; 2001: $0; 2002: $28,800; 2003: $43,345; 2004: $82,696; 2005: $87,773; 2006: $73,000.
Biggest contracts:
$49,600 with Army for Vocational/Technical. Taking place in AK. Signed on 2005-10-21. Completion date: 2005-11-18.
$31,473 with Army for Other Education and Training Services. Signed on 2005-06-08. Completion date: 2005-08-18.
$28,800 with Army for Other Administrative Support Services. Signed on 2002-06-25. Completion date: 2002-09-28.
$27,625 with Army for Other Education and Training Services. Signed on 2004-01-30. Completion date: 2004-03-27.
Top industries in this zip code by the number of employees in 2005:
Administrative and Support and Waste Management and Remediation Services: Temporary Help Services (250-499 employees: 1 establishment, 100-249 employees: 5 establishments, 50-99 employees: 5 establishments, 20-49 employees: 2 establishments, 10-19 employees: 3 establishments, 1-4 employees: 2 establishments)
Health Care and Social Assistance: Psychiatric and Substance Abuse Hospitals (250-499: 2)
Accommodation and Food Services: Hotels (except Casino Hotels) and Motels (250-499: 1, 50-99: 3, 20-49: 3, 10-19: 2, 1-4: 1)
Health Care and Social Assistance: Offices of Physicians (except Mental Health Specialists) (100-249: 1, 50-99: 1, 20-49: 5, 10-19: 8, 5-9: 13, 1-4: 11)
People in group quarters in 2010:
370 people in nursing facilities/skilled-nursing facilities
137 people in residential treatment centers for juveniles (non-correctional)
132 people in mental (psychiatric) hospitals and psychiatric units in other hospitals
40 people in workers' group living quarters and job corps centers
7 people in residential treatment centers for adults
People in group quarters in 2000:
265 people in other group homes
165 people in other noninstitutional group quarters
133 people in mental (psychiatric) hospitals or wards
81 people in nursing homes
25 people in other nonhousehold living situations
Fatal accident statistics in 2014:
Fatal accident count: 4
Vehicles involved in fatal accidents: 5
Fatal accidents caused by drunken drivers: 1
Fatalities: 4
Persons involved in fatal accidents: 5
Pedestrians involved in fatal accidents: 1
Fatal accident statistics in 2013:
Fatal accident count: 4
Vehicles involved in fatal accidents: 6
Fatal accidents caused by drunken drivers: 1
Fatalities: 4
Persons involved in fatal accidents: 7
Pedestrians involved in fatal accidents: 0
Home Mortgage Disclosure Act Aggregated Statistics For Year 2009 (Based on 7 full and 14 partial tracts)
A) FHA, FSA/RHS & VA Home Purchase Loans
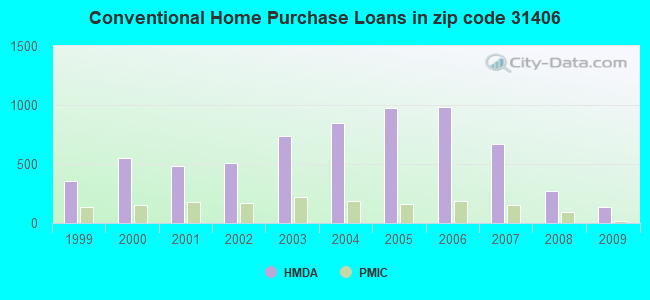
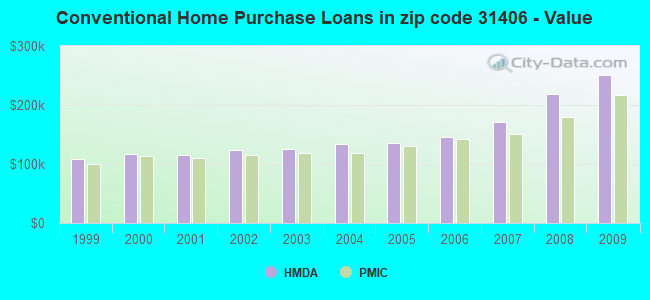
B) Conventional Home Purchase Loans
C) Refinancings
D) Home Improvement Loans
E) Loans on Dwellings For 5+ Families
F) Non-occupant Loans on < 5 Family Dwellings (A B C & D)
G) Loans On Manufactured Home Dwelling (A B C & D)
Number
Average Value
Number
Average Value
Number
Average Value
Number
Average Value
Number
Average Value
Number
Average Value
Number
Average Value
LOANS ORIGINATED
148
$146,406
134
$250,856
1,004
$204,050
45
$136,714
8
$5,316,222
165
$173,292
0
$0
APPLICATIONS APPROVED, NOT ACCEPTED
4
$101,675
8
$368,662
67
$236,366
4
$44,440
0
$0
5
$121,836
0
$0
APPLICATIONS DENIED
28
$145,682
29
$221,032
349
$173,891
35
$65,360
0
$0
39
$118,901
1
$6,870
APPLICATIONS WITHDRAWN
21
$156,126
25
$200,950
279
$198,416
12
$54,607
0
$0
18
$95,786
0
$0
FILES CLOSED FOR INCOMPLETENESS
7
$143,331
4
$279,655
51
$182,859
1
$93,000
0
$0
1
$98,410
0
$0
Aggregated Statistics For Year 2008 (Based on 7 full and 14 partial tracts)
A) FHA, FSA/RHS & VA Home Purchase Loans
B) Conventional Home Purchase Loans
C) Refinancings
D) Home Improvement Loans
E) Loans on Dwellings For 5+ Families
F) Non-occupant Loans on < 5 Family Dwellings (A B C & D)
G) Loans On Manufactured Home Dwelling (A B C & D)
Number
Average Value
Number
Average Value
Number
Average Value
Number
Average Value
Number
Average Value
Number
Average Value
Number
Average Value
LOANS ORIGINATED
164
$145,220
272
$219,074
795
$188,978
63
$97,882
9
$2,342,100
191
$177,804
5
$36,270
APPLICATIONS APPROVED, NOT ACCEPTED
11
$127,996
23
$170,265
105
$135,877
26
$52,427
0
$0
21
$109,100
2
$47,530
APPLICATIONS DENIED
30
$133,136
44
$145,045
566
$163,446
88
$82,496
0
$0
62
$137,544
7
$86,209
APPLICATIONS WITHDRAWN
13
$123,905
42
$199,335
205
$177,302
20
$83,600
0
$0
32
$170,596
0
$0
FILES CLOSED FOR INCOMPLETENESS
5
$140,664
4
$205,628
58
$170,257
9
$115,299
0
$0
3
$160,430
0
$0
Aggregated Statistics For Year 2007 (Based on 7 full and 14 partial tracts)
A) FHA, FSA/RHS & VA Home Purchase Loans
B) Conventional Home Purchase Loans
C) Refinancings
D) Home Improvement Loans
E) Loans on Dwellings For 5+ Families
F) Non-occupant Loans on < 5 Family Dwellings (A B C & D)
G) Loans On Manufactured Home Dwelling (A B C & D)
Number
Average Value
Number
Average Value
Number
Average Value
Number
Average Value
Number
Average Value
Number
Average Value
Number
Average Value
LOANS ORIGINATED
98
$149,729
668
$171,635
885
$164,962
106
$84,465
15
$7,092,748
311
$138,158
0
$0
APPLICATIONS APPROVED, NOT ACCEPTED
7
$129,469
70
$153,170
184
$141,305
21
$73,231
0
$0
28
$123,300
0
$0
APPLICATIONS DENIED
20
$141,646
147
$138,212
553
$148,154
160
$51,710
0
$0
107
$94,624
3
$65,750
APPLICATIONS WITHDRAWN
23
$187,892
163
$195,390
279
$167,479
47
$96,757
0
$0
47
$123,133
0
$0
FILES CLOSED FOR INCOMPLETENESS
0
$0
15
$121,909
63
$139,963
6
$59,572
0
$0
10
$111,935
0
$0
Aggregated Statistics For Year 2006 (Based on 7 full and 14 partial tracts)
A) FHA, FSA/RHS & VA Home Purchase Loans
B) Conventional Home Purchase Loans
C) Refinancings
D) Home Improvement Loans
E) Loans on Dwellings For 5+ Families
F) Non-occupant Loans on < 5 Family Dwellings (A B C & D)
G) Loans On Manufactured Home Dwelling (A B C & D)
Number
Average Value
Number
Average Value
Number
Average Value
Number
Average Value
Number
Average Value
Number
Average Value
Number
Average Value
LOANS ORIGINATED
124
$138,315
985
$145,205
986
$146,668
144
$71,329
8
$1,300,896
392
$116,311
2
$68,910
APPLICATIONS APPROVED, NOT ACCEPTED
5
$188,502
88
$136,994
216
$104,667
27
$55,080
0
$0
40
$105,587
3
$41,043
APPLICATIONS DENIED
15
$151,144
163
$110,702
587
$121,589
151
$49,966
0
$0
81
$85,579
3
$38,560
APPLICATIONS WITHDRAWN
38
$160,061
126
$162,244
343
$133,602
42
$52,162
0
$0
49
$134,898
0
$0
FILES CLOSED FOR INCOMPLETENESS
3
$155,983
26
$189,938
125
$152,018
6
$50,520
0
$0
5
$141,320
0
$0
Aggregated Statistics For Year 2005 (Based on 7 full and 14 partial tracts)
A) FHA, FSA/RHS & VA Home Purchase Loans
B) Conventional Home Purchase Loans
C) Refinancings
D) Home Improvement Loans
E) Loans on Dwellings For 5+ Families
F) Non-occupant Loans on < 5 Family Dwellings (A B C & D)
G) Loans On Manufactured Home Dwelling (A B C & D)
Number
Average Value
Number
Average Value
Number
Average Value
Number
Average Value
Number
Average Value
Number
Average Value
Number
Average Value
LOANS ORIGINATED
92
$125,919
977
$135,334
1,130
$145,954
100
$58,813
4
$2,349,928
380
$112,358
2
$47,610
APPLICATIONS APPROVED, NOT ACCEPTED
10
$112,900
128
$130,667
207
$118,950
28
$40,142
0
$0
47
$82,525
5
$31,490
APPLICATIONS DENIED
8
$134,819
150
$161,778
618
$107,194
140
$52,030
0
$0
91
$95,411
19
$33,508
APPLICATIONS WITHDRAWN
6
$115,483
120
$179,950
361
$130,924
52
$101,642
1
$404,000
40
$135,411
2
$129,610
FILES CLOSED FOR INCOMPLETENESS
2
$105,215
36
$102,913
177
$144,090
5
$46,074
0
$0
13
$136,810
0
$0
Aggregated Statistics For Year 2004 (Based on 7 full and 14 partial tracts)
A) FHA, FSA/RHS & VA Home Purchase Loans
B) Conventional Home Purchase Loans
C) Refinancings
D) Home Improvement Loans
E) Loans on Dwellings For 5+ Families
F) Non-occupant Loans on < 5 Family Dwellings (A B C & D)
G) Loans On Manufactured Home Dwelling (A B C & D)
Number
Average Value
Number
Average Value
Number
Average Value
Number
Average Value
Number
Average Value
Number
Average Value
Number
Average Value
LOANS ORIGINATED
108
$119,982
848
$133,670
1,117
$131,540
84
$68,064
5
$4,482,656
311
$107,767
2
$77,665
APPLICATIONS APPROVED, NOT ACCEPTED
5
$115,408
72
$110,573
217
$106,296
41
$37,388
0
$0
27
$76,471
7
$53,657
APPLICATIONS DENIED
29
$103,995
161
$106,120
573
$98,828
116
$46,010
0
$0
63
$81,760
23
$59,979
APPLICATIONS WITHDRAWN
10
$107,751
90
$124,816
366
$116,271
36
$54,429
0
$0
18
$129,750
3
$64,170
FILES CLOSED FOR INCOMPLETENESS
1
$165,160
26
$170,572
173
$125,078
12
$41,198
0
$0
6
$101,990
1
$91,000
Aggregated Statistics For Year 2003 (Based on 7 full and 14 partial tracts)
A) FHA, FSA/RHS & VA Home Purchase Loans
B) Conventional Home Purchase Loans
C) Refinancings
D) Home Improvement Loans
E) Loans on Dwellings For 5+ Families
F) Non-occupant Loans on < 5 Family Dwellings (A B C & D)
Number
Average Value
Number
Average Value
Number
Average Value
Number
Average Value
Number
Average Value
Number
Average Value
LOANS ORIGINATED
146
$108,233
740
$125,846
2,156
$133,821
59
$61,814
4
$703,768
343
$101,832
APPLICATIONS APPROVED, NOT ACCEPTED
5
$81,606
77
$140,434
228
$106,528
14
$27,062
0
$0
21
$146,721
APPLICATIONS DENIED
14
$126,011
143
$95,876
541
$105,055
89
$25,356
0
$0
70
$122,265
APPLICATIONS WITHDRAWN
12
$115,783
99
$114,461
358
$126,223
20
$20,850
0
$0
37
$140,242
FILES CLOSED FOR INCOMPLETENESS
1
$105,000
20
$115,396
126
$120,619
5
$16,344
0
$0
18
$104,158
Aggregated Statistics For Year 2002 (Based on 5 full and 14 partial tracts)
A) FHA, FSA/RHS & VA Home Purchase Loans
B) Conventional Home Purchase Loans
C) Refinancings
D) Home Improvement Loans
E) Loans on Dwellings For 5+ Families
F) Non-occupant Loans on < 5 Family Dwellings (A B C & D)
Number
Average Value
Number
Average Value
Number
Average Value
Number
Average Value
Number
Average Value
Number
Average Value
LOANS ORIGINATED
129
$102,358
506
$122,885
1,315
$132,015
43
$25,752
3
$1,652,953
177
$86,837
APPLICATIONS APPROVED, NOT ACCEPTED
5
$93,240
72
$93,251
198
$97,620
7
$24,500
0
$0
16
$91,720
APPLICATIONS DENIED
17
$100,469
97
$93,272
425
$91,231
53
$19,280
0
$0
39
$60,596
APPLICATIONS WITHDRAWN
17
$105,410
63
$112,546
303
$100,450
14
$23,259
0
$0
12
$94,186
FILES CLOSED FOR INCOMPLETENESS
3
$77,710
16
$104,425
113
$109,418
3
$118,397
0
$0
2
$119,565
Aggregated Statistics For Year 2001 (Based on 5 full and 14 partial tracts)
A) FHA, FSA/RHS & VA Home Purchase Loans
B) Conventional Home Purchase Loans
C) Refinancings
D) Home Improvement Loans
E) Loans on Dwellings For 5+ Families
F) Non-occupant Loans on < 5 Family Dwellings (A B C & D)
Number
Average Value
Number
Average Value
Number
Average Value
Number
Average Value
Number
Average Value
Number
Average Value
LOANS ORIGINATED
174
$96,906
487
$115,516
1,130
$129,935
68
$44,056
1
$4,302,860
173
$94,478
APPLICATIONS APPROVED, NOT ACCEPTED
6
$68,200
58
$66,389
144
$81,197
18
$16,484
0
$0
20
$61,779
APPLICATIONS DENIED
11
$87,939
118
$71,508
507
$77,925
50
$17,622
0
$0
32
$71,362
APPLICATIONS WITHDRAWN
23
$92,233
52
$113,646
291
$89,844
10
$20,680
0
$0
21
$84,200
FILES CLOSED FOR INCOMPLETENESS
1
$73,000
14
$151,843
64
$88,111
8
$34,689
0
$0
5
$38,832
Aggregated Statistics For Year 2000 (Based on 5 full and 14 partial tracts)
A) FHA, FSA/RHS & VA Home Purchase Loans
B) Conventional Home Purchase Loans
C) Refinancings
D) Home Improvement Loans
E) Loans on Dwellings For 5+ Families
F) Non-occupant Loans on < 5 Family Dwellings (A B C & D)
Number
Average Value
Number
Average Value
Number
Average Value
Number
Average Value
Number
Average Value
Number
Average Value
LOANS ORIGINATED
166
$86,261
549
$116,758
367
$101,465
97
$32,430
4
$895,388
95
$75,496
APPLICATIONS APPROVED, NOT ACCEPTED
5
$49,466
68
$78,159
81
$90,926
32
$26,387
0
$0
11
$93,271
APPLICATIONS DENIED
19
$67,927
149
$75,734
409
$71,329
56
$23,503
0
$0
48
$80,281
APPLICATIONS WITHDRAWN
30
$82,377
95
$115,838
257
$69,314
23
$35,010
0
$0
30
$74,664
FILES CLOSED FOR INCOMPLETENESS
6
$101,782
10
$217,155
61
$95,310
0
$0
0
$0
3
$139,933
Aggregated Statistics For Year 1999 (Based on 4 full and 8 partial tracts)
A) FHA, FSA/RHS & VA Home Purchase Loans
B) Conventional Home Purchase Loans
C) Refinancings
D) Home Improvement Loans
E) Loans on Dwellings For 5+ Families
F) Non-occupant Loans on < 5 Family Dwellings (A B C & D)
2002 - 2018 National Fire Incident Reporting System (NFIRS) incidents
Based on the data from the years 2002 - 2018 the average number of fire incidents per year is 158. The highest number of fire incidents - 418 took place in 2007, and the least - 0 in 2005. The data has an increasing trend.
When looking into fire subcategories, the most incidents belonged to: Outside Fires (50.1%), and Structure Fires (29.5%).
Fire incident types reported to NFIRS in Zip Code 31406
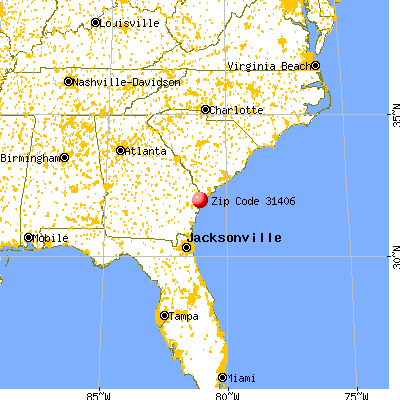


 Nearest zip codes: 31411, 31409, 31404, 31401, 31410, 31415.
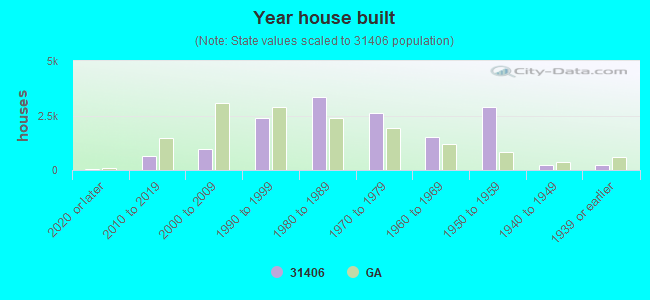


 Based on the data from the years 2002 - 2018 the average number of fire incidents per year is 158. The highest number of fire incidents - 418 took place in 2007, and the least - 0 in 2005. The data has an increasing trend.
 When looking into fire subcategories, the most incidents belonged to: Outside Fires (50.1%), and Structure Fires (29.5%).