Estimated zip code population in 2022: 9,553 Zip code population in 2010: 8,384 Zip code population in 2000: 6,958
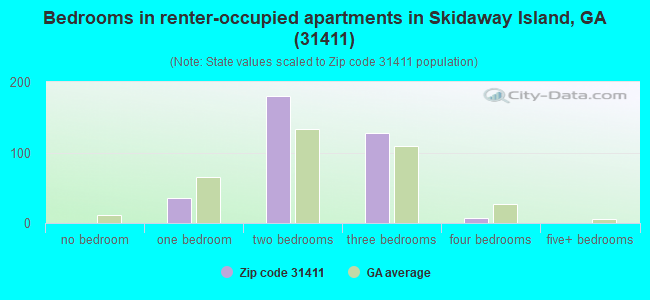
Houses and condos: 4,984 Renter-occupied apartments: 345
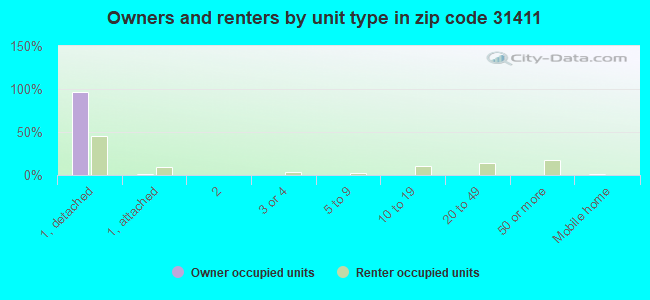
% of renters here:
7%
State:
34%
March 2022 cost of living index in zip code 31411: 99.4 (near average, U.S. average is 100)
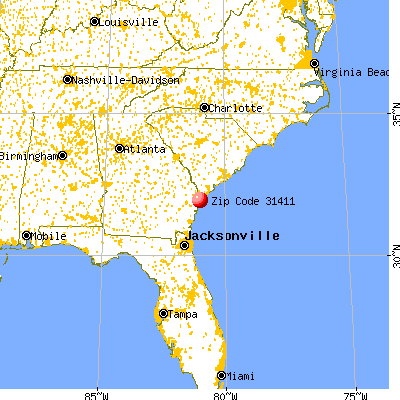
Land area: 21.1 sq. mi. Water area: 3.8 sq. mi.
Population density: 452 people per square mile
(low).
OSM Map
General Map
Google Map
MSN Map
OSM Map
General Map
Google Map
MSN Map
OSM Map
General Map
Google Map
MSN Map
OSM Map
General Map
Google Map
MSN Map
Please wait while loading the map...
Real estate property taxes paid for housing units in 2022:
This zip code:
0.8% ($6,663)
Georgia:
0.7% ($2,160)
Median real estate property taxes paid for housing units with mortgages in 2022: $6,388 (0.8%) Median real estate property taxes paid for housing units with no mortgage in 2022: $6,973 (0.8%)
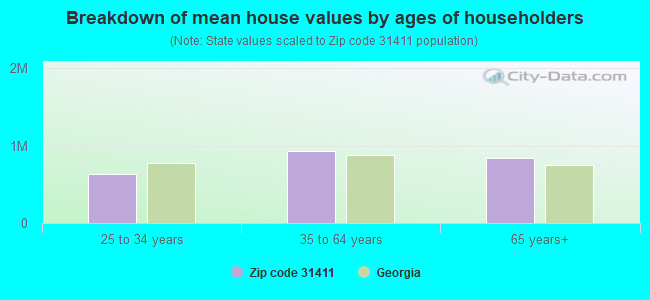
Estimated median house/condo value in 2022: $830,277
31411:
$830,277
Georgia:
$297,400
According to our research of Georgia and other state lists, there was 1 registered sex offender living in 31411 zip code as of April 27, 2024. The ratio of all residents to sex offenders in zip code 31411 is 8,117 to 1. The ratio of registered sex offenders to all residents in this zip code is much lower than the state average.
Median resident age:
This zip code:
67.0 years
Georgia median age:
37.6 years
Average household size:
This zip code:
2.0 people
Georgia:
2.6 people
Averages for the 2020 tax year for zip code 31411, filed in 2021:
Average Adjusted Gross Income (AGI) in 2020: $204,875 (Individual Income Tax Returns)
Here:
$204,875
State:
$70,847
Salary/wage: $136,632 (reported on 54.6% of returns)
Here:
$136,632
State:
$59,126
(% of AGI for various income ranges: 1060.9% for AGIs below $25k, 2883.7% for AGIs $25k-50k, 3879.5% for AGIs $50k-75k, 4972.9% for AGIs $75k-100k, 11898.5% for AGIs $100k-200k, 82031.6% for AGIs over 200k)
Taxable interest for individuals: $5,628 (reported on 69.0% of returns)
This zip code:
$5,628
Georgia:
$2,011
(% of AGI for various income ranges: 62.4% for AGIs below $25k, 241.1% for AGIs $25k-50k, 415.2% for AGIs $50k-75k, 604.7% for AGIs $75k-100k, 613.2% for AGIs $100k-200k, 3898.7% for AGIs over 200k)
Ordinary dividends: $27,597 (reported on 67.1% of returns)
Here:
$27,597
State:
$8,996
(% of AGI for various income ranges: 315.8% for AGIs below $25k, 922.1% for AGIs $25k-50k, 1450.5% for AGIs $50k-75k, 3135.3% for AGIs $75k-100k, 3446.0% for AGIs $100k-200k, 18054.1% for AGIs over 200k)
Net capital gain/loss in AGI: +$39,831 (reported on 65.8% of returns)
Here:
+$39,831
State:
+$28,402
(% of AGI for various income ranges: 92.4% for AGIs below $25k, 312.1% for AGIs $25k-50k, 478.6% for AGIs $50k-75k, 1246.5% for AGIs $75k-100k, 2732.1% for AGIs $100k-200k, 32804.4% for AGIs over 200k)
Profit/loss from business: +$33,263 (reported on 19.3% of returns)
Here:
+$33,263
State:
+$6,707
(% of AGI for various income ranges: 164.5% for AGIs below $25k, 380.5% for AGIs $25k-50k, 387.1% for AGIs $50k-75k, 678.2% for AGIs $75k-100k, 1072.5% for AGIs $100k-200k, 6672.8% for AGIs over 200k)
Taxable individual retirement arrangement distribution: $41,342 (reported on 31.8% of returns)
31411:
$41,342
Georgia:
$20,525
(% of AGI for various income ranges: 170.6% for AGIs below $25k, 830.0% for AGIs $25k-50k, 1261.4% for AGIs $50k-75k, 2282.4% for AGIs $75k-100k, 4891.1% for AGIs $100k-200k, 8569.1% for AGIs over 200k)
Self-employed (Keogh) retirement plans: $27,431 (reported on 2.8% of returns)
31411:
$27,431
Georgia:
$27,751
(% of AGI for various income ranges: 61.9% for AGIs $100k-200k, 1011.9% for AGIs over 200k)
Total itemized deductions: $50,024 (reported on 36.1% of returns)
Here:
$50,024
State:
$34,001
(% of AGI for various income ranges: 362.4% for AGIs below $25k, 1345.8% for AGIs $25k-50k, 1443.3% for AGIs $50k-75k, 2611.2% for AGIs $75k-100k, 3382.1% for AGIs $100k-200k, 17466.6% for AGIs over 200k)
Charity contributions: $24,470 (reported on 32.9% of returns)
Here:
$24,470
State:
$14,164
(% of AGI for various income ranges: 37.9% for AGIs below $25k, 142.6% for AGIs $25k-50k, 164.3% for AGIs $50k-75k, 400.0% for AGIs $75k-100k, 700.4% for AGIs $100k-200k, 10248.4% for AGIs over 200k)
Taxes paid: $8,614 (reported on 36.1% of returns)
31411:
$8,614
State:
$7,540
(% of AGI for various income ranges: 73.6% for AGIs below $25k, 236.8% for AGIs $25k-50k, 318.6% for AGIs $50k-75k, 549.4% for AGIs $75k-100k, 836.6% for AGIs $100k-200k, 2473.1% for AGIs over 200k)
Earned income credit: $1,222 (reported on 1.9% of returns)
Here:
$1,222
State:
$2,530
(% of AGI for various income ranges: 17.9% for AGIs below $25k, 26.8% for AGIs $25k-50k)
Percentage of individuals using paid preparers for their 2020 taxes: 92.4%
Here:
92%
State:
93%
(% for various income ranges: 90.6% for AGIs below $25k, 90.0% for AGIs $25k-50k, 90.5% for AGIs $50k-75k, 93.0% for AGIs $75k-100k, 92.3% for AGIs $100k-200k, 94.2% for AGIs over 200k)
Averages for the 2012 tax year for zip code 31411, filed in 2013:
Average Adjusted Gross Income (AGI) in 2012: $171,081 (Individual Income Tax Returns)
Here:
$171,081
State:
$56,131
Salary/wage: $114,738 (reported on 52.6% of returns)
Here:
$114,738
State:
$47,942
(% of AGI for various income ranges: 49.7% for AGIs below $25k, 34.3% for AGIs $25k-50k, 26.8% for AGIs $50k-75k, 25.8% for AGIs $75k-100k, 29.4% for AGIs $100k-200k, 39.0% for AGIs over 200k)
Taxable interest for individuals: $6,410 (reported on 73.5% of returns)
This zip code:
$6,410
Georgia:
$1,706
(% of AGI for various income ranges: 5.4% for AGIs below $25k, 4.1% for AGIs $25k-50k, 3.3% for AGIs $50k-75k, 3.4% for AGIs $75k-100k, 2.4% for AGIs $100k-200k, 2.7% for AGIs over 200k)
Ordinary dividends: $22,388 (reported on 68.5% of returns)
Here:
$22,388
State:
$7,265
(% of AGI for various income ranges: 16.5% for AGIs below $25k, 11.4% for AGIs $25k-50k, 11.1% for AGIs $50k-75k, 9.0% for AGIs $75k-100k, 8.8% for AGIs $100k-200k, 8.7% for AGIs over 200k)
Net capital gain/loss in AGI: +$26,687 (reported on 65.3% of returns)
Here:
+$26,687
State:
+$16,323
(% of AGI for various income ranges: 0.3% for AGIs $25k-50k, 1.3% for AGIs $50k-75k, 1.7% for AGIs $75k-100k, 3.2% for AGIs $100k-200k, 15.0% for AGIs over 200k)
Profit/loss from business: +$31,178 (reported on 19.5% of returns)
Here:
+$31,178
State:
+$7,583
(% of AGI for various income ranges: 8.2% for AGIs below $25k, 4.7% for AGIs $25k-50k, 4.2% for AGIs $50k-75k, 2.5% for AGIs $75k-100k, 3.8% for AGIs $100k-200k, 3.4% for AGIs over 200k)
Taxable individual retirement arrangement distribution: $43,641 (reported on 42.0% of returns)
31411:
$43,641
Georgia:
$17,199
(% of AGI for various income ranges: 13.6% for AGIs below $25k, 12.0% for AGIs $25k-50k, 11.9% for AGIs $50k-75k, 15.9% for AGIs $75k-100k, 15.6% for AGIs $100k-200k, 8.0% for AGIs over 200k)
Self-employment retirement plans: $22,536 (reported on 3.3% of returns)
31411:
$22,536
Georgia:
$23,277
Total itemized deductions: $40,354 (19% of AGI, reported on 73.7% of returns)
Here:
$40,354
State:
$23,886
Here:
18.9% of AGI
State:
21.5% of AGI
(% of AGI for various income ranges: 51.8% for AGIs below $25k, 31.7% for AGIs $25k-50k, 24.8% for AGIs $50k-75k, 23.0% for AGIs $75k-100k, 18.9% for AGIs $100k-200k, 14.8% for AGIs over 200k)
Charity contributions: $8,937 (reported on 69.2% of returns)
Here:
$8,937
State:
$5,507
(% of AGI for various income ranges: 3.5% for AGIs below $25k, 3.7% for AGIs $25k-50k, 3.9% for AGIs $50k-75k, 3.7% for AGIs $75k-100k, 3.4% for AGIs $100k-200k, 3.7% for AGIs over 200k)
Taxes paid: $15,402 (reported on 73.5% of returns)
31411:
$15,402
State:
$7,838
(% of AGI for various income ranges: 11.8% for AGIs below $25k, 7.3% for AGIs $25k-50k, 6.8% for AGIs $50k-75k, 6.4% for AGIs $75k-100k, 6.7% for AGIs $100k-200k, 6.5% for AGIs over 200k)
Earned income credit: $1,250 (reported on 2.3% of returns)
Here:
$1,250
State:
$2,589
(% of AGI for various income ranges: 1.5% for AGIs below $25k, 0.2% for AGIs $25k-50k)
Percentage of individuals using paid preparers for their 2012 taxes: 68.5%
Here:
69%
State:
55%
(% for various income ranges: 60.3% for AGIs below $25k, 65.9% for AGIs $25k-50k, 68.2% for AGIs $50k-75k, 68.8% for AGIs $75k-100k, 63.2% for AGIs $100k-200k, 83.0% for AGIs over 200k)
Averages for the 2004 tax year for zip code 31411, filed in 2005:
Average Adjusted Gross Income (AGI) in 2004: $150,893 (Individual Income Tax Returns)
Here:
$150,893
State:
$47,553
Salary/wage: $106,168 (reported on 56.4% of returns)
Here:
$106,168
State:
$42,178
(% of AGI for various income ranges: 38.0% for AGIs $10k-25k, 34.3% for AGIs $25k-50k, 30.0% for AGIs $50k-75k, 28.3% for AGIs $75k-100k, 41.1% for AGIs over 100k)
Taxable interest for individuals: $6,522 (reported on 82.0% of returns)
This zip code:
$6,522
Georgia:
$1,772
(% of AGI for various income ranges: 9.2% for AGIs $10k-25k, 7.2% for AGIs $25k-50k, 5.6% for AGIs $50k-75k, 3.7% for AGIs $75k-100k, 3.1% for AGIs over 100k)
Taxable dividends: $14,784 (reported on 75.8% of returns)
Here:
$14,784
State:
$4,283
(% of AGI for various income ranges: 15.6% for AGIs $10k-25k, 12.6% for AGIs $25k-50k, 10.5% for AGIs $50k-75k, 7.9% for AGIs $75k-100k, 6.8% for AGIs over 100k)
Net capital gain/loss: +$24,605 (reported on 70.9% of returns)
Here:
+$24,605
State:
+$16,461
(% of AGI for various income ranges: -2.5% for AGIs $10k-25k, 1.8% for AGIs $25k-50k, 2.8% for AGIs $50k-75k, 3.5% for AGIs $75k-100k, 13.3% for AGIs over 100k)
Profit/loss from business: +$32,943 (reported on 19.8% of returns)
Here:
+$32,943
State:
+$8,201
(% of AGI for various income ranges: 5.6% for AGIs $10k-25k, 4.4% for AGIs $25k-50k, 4.8% for AGIs $50k-75k, 4.6% for AGIs $75k-100k, 4.2% for AGIs over 100k)
IRA payment deduction: $4,621 (reported on 4.4% of returns)
31411:
$4,621
Georgia:
$2,969
(% of AGI for various income ranges: 0.6% for AGIs $25k-50k, 0.4% for AGIs $50k-75k, 0.2% for AGIs $75k-100k, 0.1% for AGIs over 100k)
Self-employed pension: $20,566 (reported on 3.9% of returns)
Here:
$20,566
Georgia:
$16,203
(% of AGI for various income ranges: 0.4% for AGIs $50k-75k, 0.4% for AGIs $75k-100k, 0.6% for AGIs over 100k)
Total itemized deductions: $36,244 (19% of AGI, reported on 73.7% of returns)
Here:
$36,244
State:
$19,944
Here:
18.7% of AGI
State:
22.6% of AGI
(% of AGI for various income ranges: 45.0% for AGIs $10k-25k, 33.3% for AGIs $25k-50k, 28.4% for AGIs $50k-75k, 22.0% for AGIs $75k-100k, 15.7% for AGIs over 100k)
Charity contributions deductions: $9,962 (5% of AGI, reported on 70.7% of returns)
Here:
$9,962
State:
$4,354
Here:
5.0% of AGI
State:
4.7% of AGI
(% of AGI for various income ranges: 4.7% for AGIs $10k-25k, 4.2% for AGIs $25k-50k, 4.9% for AGIs $50k-75k, 4.1% for AGIs $75k-100k, 4.7% for AGIs over 100k)
Total tax: $32,517 (reported on 87.2% of returns)
31411:
$32,517
State:
$8,223
(% of AGI for various income ranges: 4.0% for AGIs $10k-25k, 6.4% for AGIs $25k-50k, 8.8% for AGIs $50k-75k, 10.5% for AGIs $75k-100k, 20.7% for AGIs over 100k)
Earned income credit: $804 (reported on 1.3% of returns)
Here:
$804
State:
$1,986
Percentage of individuals using paid preparers for their 2004 taxes: 67.8%
Here:
68%
State:
62%
(% for various income ranges: 67.0% for AGIs below $10k, 61.0% for AGIs $10k-25k, 62.0% for AGIs $25k-50k, 65.6% for AGIs $50k-75k, 63.7% for AGIs $75k-100k, 72.5% for AGIs over 100k)
Household received Food Stamps/SNAP in the past 12 months: 68 Household did not receive Food Stamps/SNAP in the past 12 months: 4,578
Women who had a birth in the past 12 months: 22 (22 now married, 0 unmarried) Women who did not have a birth in the past 12 months: 865 (552 now married, 310 unmarried)
Housing units in zip code 31411 with a mortgage: 2,225 (142 second mortgage, 7 home equity loan, 142 both second mortgage and home equity loan) Houses without a mortgage: 198
Median monthly owner costs for units with a mortgage: $2,710 Median monthly owner costs for units without a mortgage: $1,202
Residents with income below the poverty level in 2022:
This zip code:
2.2%
Whole state:
12.7%
Residents with income below 50% of the poverty level in 2022:
This zip code:
1.3%
Whole state:
6.3%
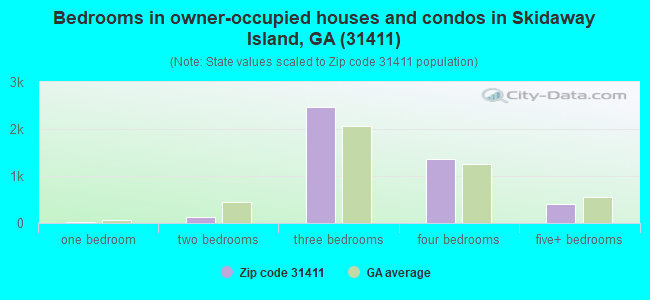
Median number of rooms in houses and condos:
Here:
8.1
State:
6.8
Median number of rooms in apartments:
Here:
5.2
State:
4.6
Notable locations in this zip code not listed on our city pages
Notable locations in zip code 31411: Priest Landing (A), The Landings Golf Course (B), Southside Fire Department Station 5 (C), Southside Fire Department Station 9 - Skidaway Island (D). Display/hide their locations on the map
Churches in zip code 31411 include: Saint Peters Episcopal Church (A), Skidaway Island Baptist Church (B), Messiah Lutheran Church (C). Display/hide their locations on the map
In group quarters: 33 (-1 institutionalized population)
Size of family households: 2,625 2-persons, 262 3-persons, 239 4-persons, 113 5-persons, 72 6-persons
Size of nonfamily households: 1,012 1-person, 93 2-persons, 317 3-persons
900 married couples with children.
182 single-parent households (24 men, 158 women).
97.9% of residents of 31411 zip code speak English at home.
0.6% of residents speak Spanish at home (100% very well).
2.7% of residents speak other Indo-European language at home (89% very well, 11% not well).
0.5% of residents speak Asian or Pacific Island language at home (100% not well).
0.2% of residents speak other language at home (100% very well).
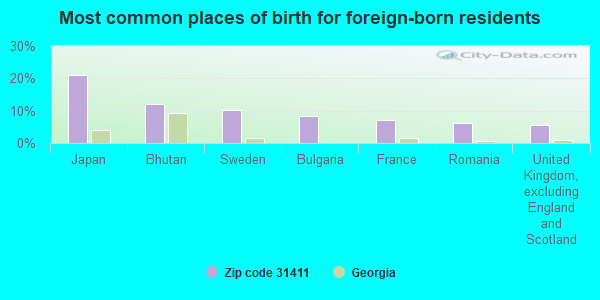
Foreign born population: 583 (6.1%) (93.2% of them are naturalized citizens)
This zip code:
6.1%
Whole state:
10.7%
21%Japan
12%Bhutan
10%Sweden
8%Bulgaria
7%France
6%Romania
6%United Kingdom, excluding England and Scotland
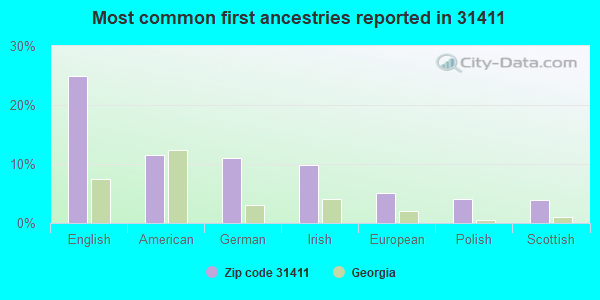
25%English
11%American
11%German
10%Irish
5%European
4%Polish
4%Scottish
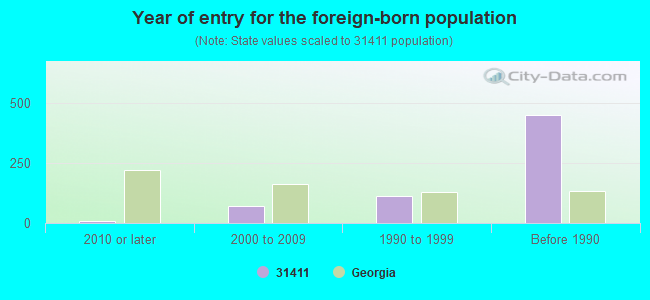
Year of entry for the foreign-born population
82010 or later
722000 to 2009
1131990 to 1999
450Before 1990
Facilities with environmental interests located in this zip code:
SKIDAWAY INST OF OCEANOGRAPHY (10 OCEAN SCIENCE CIR in SAVANNAH, GA)
STATE MASTER (Georgia's Geographic Environmental Information) - UST-1, UNDERGROUND STORAGE TANK PROGRAM, UST-2, UST-3, UST-5, UST-4, Conditionally Exempt Small Quantity Generators, less than 100 kg/month of hazardous waste (Resource Conservation and Recovery Act (tracking hazardous waste)) - notification Organizations: SKIDAWAY INSTITUTE OF OCEANOGRAP (CONTACT/OPERATOR)
, BOARD OF REGENTS UNIVERSITY SYST (CONTACT/OWNER)
, UNIV SYSTEM OF GA (CONTACT/OWNER)
, P&I SUPPLY CO, INC (INSTALLER)
THE LANDINGS CLUB (71 GREEN ISLAND RD in SAVANNAH, GA)
(Resource Conservation and Recovery Act (tracking hazardous waste))
UTILITIES INC.OF GEORGIA (12 LANDINGS WAY in SAVANNAH, GA)
National Pollutant Discharge Elimination System NON-MAJOR (Tracking pollutant discharge elimination systems) - permit Business SIC classification: SEWERAGE SYSTEMS Organizations: SKIDAWAY ISLAND (CONTACT/OWNER)
Alternative names: SKIDAWAY ISLAND UTILITIES
Housing units lacking complete kitchen facilities: 0.3%
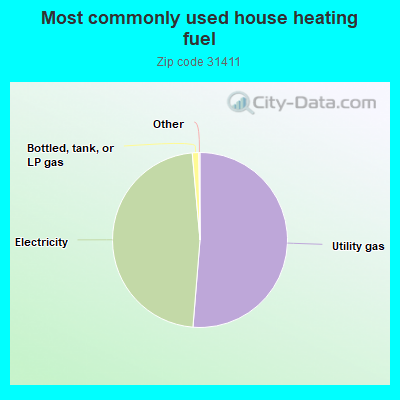
51.3%Utility gas
47.3%Electricity
1.2%Bottled, tank, or LP gas
Population in 1990: 4,707. Population change in the 1990s: +2,251 (+47.8%).
Place of birth for U.S.-born residents:
This state: 3,130
Northeast: 2,538
Midwest: 1,345
South: 1,484
West: 363
51% of the 31411 zip code residents lived in the same house 5 years ago. Out of people who lived in different houses, 30% lived in this county. Out of people who lived in different counties, 50% lived in Georgia.
88% of the 31411 zip code residents lived in the same house 1 year ago. Out of people who lived in different houses, 33% moved from this county. Out of people who lived in different houses, 30% moved from different county within same state. Out of people who lived in different houses, 38% moved from different state. Out of people who lived in different houses, 1% moved from abroad.
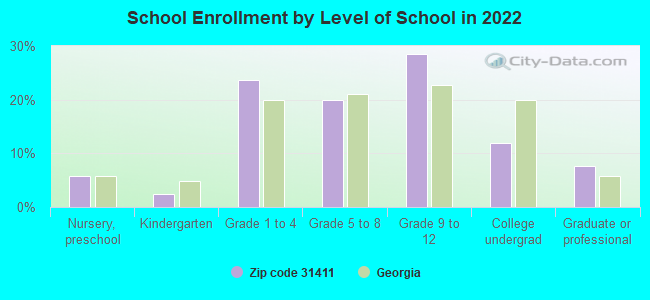
Private vs. public school enrollment:
Students in private schools in grades 1 to 8 (elementary and middle school): 413
Here:
75.8%
Georgia:
12.1%
Students in private schools in grades 9 to 12 (high school): 306
Here:
90.3%
Georgia:
10.8%
Students in private undergraduate colleges: 58
Here:
41.1%
Georgia:
17.1%
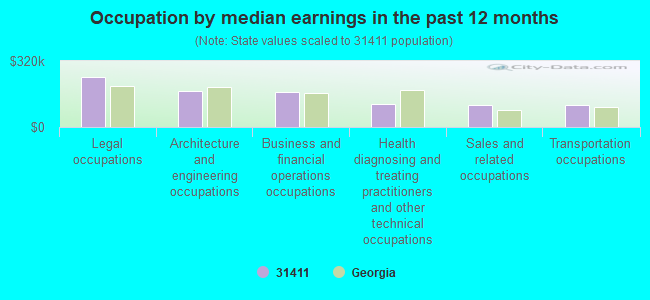
Occupation by median earnings in the past 12 months ($)
241,916Legal occupations
174,308Architecture and engineering occupations
168,838Business and financial operations occupations
113,256Health diagnosing and treating practitioners and other technical occupations
105,829Sales and related occupations
105,770Transportation occupations
Companies with federal contracts located in this zip code:
BOARD OF REGENTS (10 OCEAN SCIENCE CIRCLE in SAVANNAH, GA) : $290,286 in 2 contractsfrom 2001 to 2004
$264,036 with NASA for Space Science and Applications -- Basic Research (R&D). Signed on 2001-03-14. Effective on 2003-10-01. Completion date: 2005-03-14.
$26,250 with Navy for Other Vehicle Charter for Transportation of Things. Signed on 2004-06-30. Completion date: 2004-07-30.
Top industries in this zip code by the number of employees in 2005:
Arts, Entertainment, and Recreation: Golf Courses and Country Clubs (250-499 employees: 1 establishment)
Accommodation and Food Services: Full-Service Restaurants (20-49: 3, 1-4: 1)
Other Services (except Public Administration): Other Similar Organizations (except Business, Professional, Labor, and Political Organizations) (50-99: 1)
Other Services (except Public Administration): Religious Organizations (20-49: 1, 10-19: 1, 5-9: 1, 1-4: 1)
Health Care and Social Assistance: Offices of Physicians (except Mental Health Specialists) (20-49: 1, 5-9: 1, 1-4: 3)
Real Estate and Rental and Leasing: Offices of Real Estate Agents and Brokers (20-49: 1, 1-4: 2)
Detailed PMIC statistics for the following Tracts:0109.02
, 0110.02
2003 - 2018 National Fire Incident Reporting System (NFIRS) incidents
Based on the data from the years 2003 - 2018 the average number of fire incidents per year is 7. The highest number of fire incidents - 23 took place in 2016, and the least - 0 in 2005. The data has an increasing trend.
When looking into fire subcategories, the most incidents belonged to: Outside Fires (41.5%), and Structure Fires (39.0%).
Fire incident types reported to NFIRS in Zip Code 31411


 Nearest zip codes: 31406, 31410, 31404, 31409, 31401, 31328.
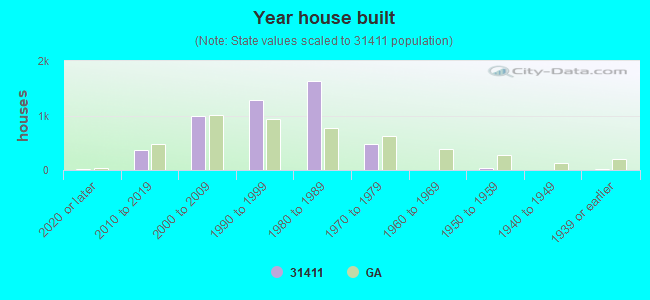


 Based on the data from the years 2003 - 2018 the average number of fire incidents per year is 7. The highest number of fire incidents - 23 took place in 2016, and the least - 0 in 2005. The data has an increasing trend.
 When looking into fire subcategories, the most incidents belonged to: Outside Fires (41.5%), and Structure Fires (39.0%).