Estimated zip code population in 2022: 29,506 Zip code population in 2010: 28,996 Zip code population in 2000: 27,767
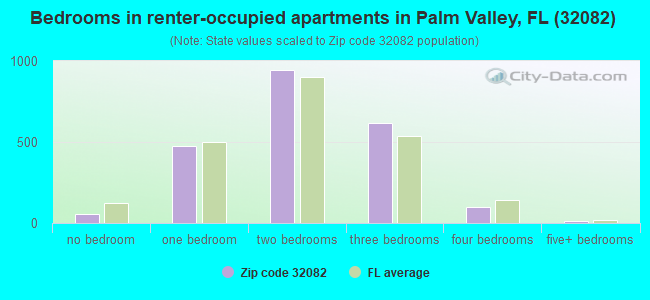
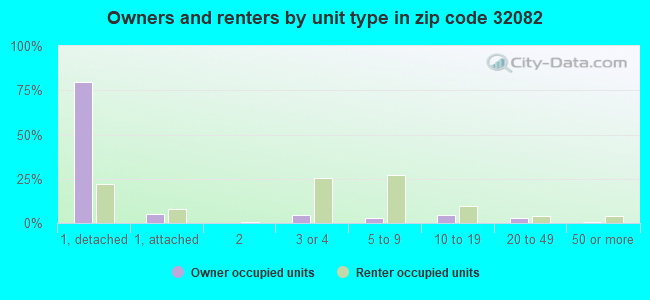
Houses and condos: 15,273 Renter-occupied apartments: 2,224
% of renters here:
17%
State:
33%
March 2022 cost of living index in zip code 32082: 92.2 (less than average, U.S. average is 100)
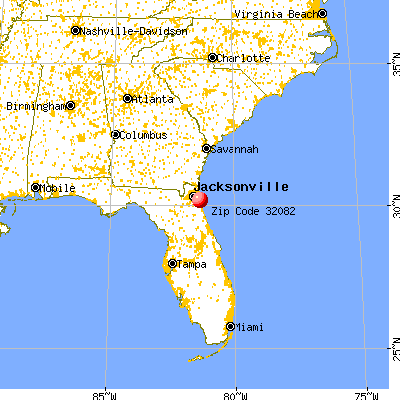
Land area: 33.3 sq. mi. Water area: 14.4 sq. mi.
Population density: 887 people per square mile
(low).
OSM Map
General Map
Google Map
MSN Map
OSM Map
General Map
Google Map
MSN Map
OSM Map
General Map
Google Map
MSN Map
OSM Map
General Map
Google Map
MSN Map
Please wait while loading the map...
Real estate property taxes paid for housing units in 2022:
This zip code:
0.6% ($4,963)
Florida:
0.7% ($2,529)
Median real estate property taxes paid for housing units with mortgages in 2022: $5,076 (0.6%) Median real estate property taxes paid for housing units with no mortgage in 2022: $4,659 (0.6%)
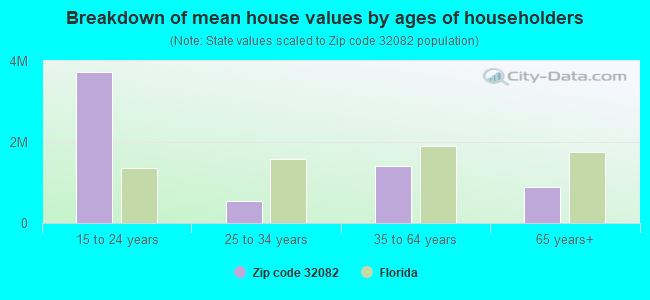
Estimated median house/condo value in 2022: $819,568
32082:
$819,568
Florida:
$354,100
According to our research of Florida and other state lists, there were 5 registered sex offenders living in 32082 zip code as of April 26, 2024. The ratio of all residents to sex offenders in zip code 32082 is 6,191 to 1. The ratio of registered sex offenders to all residents in this zip code is much lower than the state average.
Median resident age:
This zip code:
52.3 years
Florida median age:
42.7 years
Average household size:
This zip code:
2.3 people
Florida:
2.5 people
Averages for the 2020 tax year for zip code 32082, filed in 2021:
Average Adjusted Gross Income (AGI) in 2020: $285,570 (Individual Income Tax Returns)
Here:
$285,570
State:
$82,200
Salary/wage: $175,014 (reported on 71.4% of returns)
Here:
$175,014
State:
$58,347
(% of AGI for various income ranges: 1204.0% for AGIs below $25k, 3532.9% for AGIs $25k-50k, 6390.0% for AGIs $50k-75k, 8814.3% for AGIs $75k-100k, 16384.2% for AGIs $100k-200k, 141365.8% for AGIs over 200k)
Taxable interest for individuals: $9,260 (reported on 56.0% of returns)
This zip code:
$9,260
Florida:
$4,272
(% of AGI for various income ranges: 50.3% for AGIs below $25k, 77.1% for AGIs $25k-50k, 142.8% for AGIs $50k-75k, 332.6% for AGIs $75k-100k, 494.7% for AGIs $100k-200k, 6332.1% for AGIs over 200k)
Ordinary dividends: $36,080 (reported on 51.6% of returns)
Here:
$36,080
State:
$15,863
(% of AGI for various income ranges: 137.2% for AGIs below $25k, 248.7% for AGIs $25k-50k, 500.5% for AGIs $50k-75k, 946.0% for AGIs $75k-100k, 2168.6% for AGIs $100k-200k, 22524.3% for AGIs over 200k)
Net capital gain/loss in AGI: +$124,700 (reported on 49.3% of returns)
Here:
+$124,700
State:
+$62,983
(% of AGI for various income ranges: 50.2% for AGIs below $25k, 165.8% for AGIs $25k-50k, 411.0% for AGIs $50k-75k, 797.9% for AGIs $75k-100k, 1860.5% for AGIs $100k-200k, 85019.9% for AGIs over 200k)
Profit/loss from business: +$35,555 (reported on 19.2% of returns)
Here:
+$35,555
State:
+$9,719
(% of AGI for various income ranges: 156.3% for AGIs below $25k, 254.5% for AGIs $25k-50k, 289.0% for AGIs $50k-75k, 575.4% for AGIs $75k-100k, 1151.1% for AGIs $100k-200k, 7183.4% for AGIs over 200k)
Taxable individual retirement arrangement distribution: $42,698 (reported on 17.8% of returns)
32082:
$42,698
Florida:
$24,823
(% of AGI for various income ranges: 97.1% for AGIs below $25k, 250.4% for AGIs $25k-50k, 508.1% for AGIs $50k-75k, 1316.9% for AGIs $75k-100k, 2546.0% for AGIs $100k-200k, 5990.1% for AGIs over 200k)
Self-employed (Keogh) retirement plans: $38,655 (reported on 2.0% of returns)
32082:
$38,655
Florida:
$29,694
(% of AGI for various income ranges: 34.3% for AGIs $50k-75k, 77.2% for AGIs $100k-200k, 1011.0% for AGIs over 200k)
Total itemized deductions: $59,979 (reported on 24.9% of returns)
Here:
$59,979
State:
$45,393
(% of AGI for various income ranges: 178.6% for AGIs below $25k, 348.3% for AGIs $25k-50k, 672.9% for AGIs $50k-75k, 1138.7% for AGIs $75k-100k, 2165.3% for AGIs $100k-200k, 16686.2% for AGIs over 200k)
Charity contributions: $31,100 (reported on 22.3% of returns)
Here:
$31,100
State:
$20,178
(% of AGI for various income ranges: 11.0% for AGIs below $25k, 40.8% for AGIs $25k-50k, 90.1% for AGIs $50k-75k, 179.7% for AGIs $75k-100k, 456.3% for AGIs $100k-200k, 9133.8% for AGIs over 200k)
Taxes paid: $8,108 (reported on 24.8% of returns)
32082:
$8,108
State:
$6,967
(% of AGI for various income ranges: 26.3% for AGIs below $25k, 52.9% for AGIs $25k-50k, 111.6% for AGIs $50k-75k, 203.4% for AGIs $75k-100k, 443.8% for AGIs $100k-200k, 1999.3% for AGIs over 200k)
Earned income credit: $1,476 (reported on 4.4% of returns)
Here:
$1,476
State:
$2,306
(% of AGI for various income ranges: 37.0% for AGIs below $25k, 23.4% for AGIs $25k-50k)
Percentage of individuals using paid preparers for their 2020 taxes: 91.7%
Here:
92%
State:
92%
(% for various income ranges: 90.7% for AGIs below $25k, 91.7% for AGIs $25k-50k, 91.9% for AGIs $50k-75k, 90.5% for AGIs $75k-100k, 90.5% for AGIs $100k-200k, 93.5% for AGIs over 200k)
Averages for the 2012 tax year for zip code 32082, filed in 2013:
Average Adjusted Gross Income (AGI) in 2012: $216,848 (Individual Income Tax Returns)
Here:
$216,848
State:
$60,316
Salary/wage: $151,565 (reported on 74.8% of returns)
Here:
$151,565
State:
$45,277
(% of AGI for various income ranges: 73.6% for AGIs below $25k, 68.9% for AGIs $25k-50k, 58.4% for AGIs $50k-75k, 53.7% for AGIs $75k-100k, 58.2% for AGIs $100k-200k, 50.1% for AGIs over 200k)
Taxable interest for individuals: $7,322 (reported on 54.8% of returns)
This zip code:
$7,322
Florida:
$3,587
(% of AGI for various income ranges: 2.5% for AGIs below $25k, 1.4% for AGIs $25k-50k, 1.9% for AGIs $50k-75k, 2.1% for AGIs $75k-100k, 1.9% for AGIs $100k-200k, 1.8% for AGIs over 200k)
Ordinary dividends: $36,637 (reported on 47.1% of returns)
Here:
$36,637
State:
$12,831
(% of AGI for various income ranges: 7.0% for AGIs below $25k, 4.2% for AGIs $25k-50k, 4.9% for AGIs $50k-75k, 5.0% for AGIs $75k-100k, 6.0% for AGIs $100k-200k, 8.7% for AGIs over 200k)
Net capital gain/loss in AGI: +$78,492 (reported on 44.1% of returns)
Here:
+$78,492
State:
+$33,493
(% of AGI for various income ranges: 0.7% for AGIs $25k-50k, 1.0% for AGIs $50k-75k, 2.0% for AGIs $75k-100k, 3.1% for AGIs $100k-200k, 20.1% for AGIs over 200k)
Profit/loss from business: +$28,426 (reported on 17.7% of returns)
Here:
+$28,426
State:
+$10,012
(% of AGI for various income ranges: 7.1% for AGIs below $25k, 4.5% for AGIs $25k-50k, 2.9% for AGIs $50k-75k, 2.4% for AGIs $75k-100k, 3.8% for AGIs $100k-200k, 1.9% for AGIs over 200k)
Taxable individual retirement arrangement distribution: $42,726 (reported on 20.3% of returns)
32082:
$42,726
Florida:
$21,544
(% of AGI for various income ranges: 5.8% for AGIs below $25k, 4.7% for AGIs $25k-50k, 6.4% for AGIs $50k-75k, 7.9% for AGIs $75k-100k, 7.6% for AGIs $100k-200k, 3.1% for AGIs over 200k)
Self-employment retirement plans: $26,904 (reported on 1.7% of returns)
32082:
$26,904
Florida:
$20,611
(% of AGI for various income ranges: 0.3% for AGIs $50k-75k, 0.2% for AGIs $100k-200k, 0.2% for AGIs over 200k)
Total itemized deductions: $44,971 (12% of AGI, reported on 51.8% of returns)
Here:
$44,971
State:
$25,533
Here:
12.0% of AGI
State:
18.0% of AGI
(% of AGI for various income ranges: 23.2% for AGIs below $25k, 16.2% for AGIs $25k-50k, 17.2% for AGIs $50k-75k, 16.7% for AGIs $75k-100k, 16.8% for AGIs $100k-200k, 8.9% for AGIs over 200k)
Charity contributions: $14,151 (reported on 47.0% of returns)
Here:
$14,151
State:
$5,698
(% of AGI for various income ranges: 1.6% for AGIs below $25k, 1.7% for AGIs $25k-50k, 2.0% for AGIs $50k-75k, 2.4% for AGIs $75k-100k, 2.6% for AGIs $100k-200k, 3.3% for AGIs over 200k)
Taxes paid: $12,770 (reported on 51.2% of returns)
32082:
$12,770
State:
$6,203
(% of AGI for various income ranges: 4.5% for AGIs below $25k, 3.2% for AGIs $25k-50k, 3.8% for AGIs $50k-75k, 3.9% for AGIs $75k-100k, 4.5% for AGIs $100k-200k, 2.7% for AGIs over 200k)
Earned income credit: $1,638 (reported on 6.2% of returns)
Here:
$1,638
State:
$2,372
(% of AGI for various income ranges: 2.6% for AGIs below $25k, 0.5% for AGIs $25k-50k)
Percentage of individuals using paid preparers for their 2012 taxes: 58.8%
Here:
59%
State:
54%
(% for various income ranges: 48.6% for AGIs below $25k, 47.9% for AGIs $25k-50k, 56.5% for AGIs $50k-75k, 59.2% for AGIs $75k-100k, 62.9% for AGIs $100k-200k, 79.6% for AGIs over 200k)
Averages for the 2004 tax year for zip code 32082, filed in 2005:
Average Adjusted Gross Income (AGI) in 2004: $153,106 (Individual Income Tax Returns)
Here:
$153,106
State:
$50,523
Salary/wage: $112,456 (reported on 75.1% of returns)
Here:
$112,456
State:
$39,563
(% of AGI for various income ranges: 67.5% for AGIs $10k-25k, 70.6% for AGIs $25k-50k, 60.0% for AGIs $50k-75k, 60.1% for AGIs $75k-100k, 52.1% for AGIs over 100k)
Taxable interest for individuals: $7,119 (reported on 64.3% of returns)
This zip code:
$7,119
Florida:
$3,211
(% of AGI for various income ranges: 4.2% for AGIs $10k-25k, 2.9% for AGIs $25k-50k, 3.3% for AGIs $50k-75k, 3.0% for AGIs $75k-100k, 2.8% for AGIs over 100k)
Taxable dividends: $14,279 (reported on 52.2% of returns)
Here:
$14,279
State:
$6,129
(% of AGI for various income ranges: 5.6% for AGIs $10k-25k, 4.4% for AGIs $25k-50k, 4.8% for AGIs $50k-75k, 4.7% for AGIs $75k-100k, 4.7% for AGIs over 100k)
Net capital gain/loss: +$63,697 (reported on 47.5% of returns)
Here:
+$63,697
State:
+$27,205
(% of AGI for various income ranges: 1.0% for AGIs $10k-25k, 1.7% for AGIs $25k-50k, 2.2% for AGIs $50k-75k, 2.6% for AGIs $75k-100k, 22.5% for AGIs over 100k)
Profit/loss from business: +$27,609 (reported on 16.8% of returns)
Here:
+$27,609
State:
+$10,634
(% of AGI for various income ranges: 6.0% for AGIs $10k-25k, 3.6% for AGIs $25k-50k, 4.0% for AGIs $50k-75k, 3.1% for AGIs $75k-100k, 2.8% for AGIs over 100k)
IRA payment deduction: $3,691 (reported on 4.0% of returns)
32082:
$3,691
Florida:
$3,082
(% of AGI for various income ranges: 0.4% for AGIs $10k-25k, 0.4% for AGIs $25k-50k, 0.3% for AGIs $50k-75k, 0.3% for AGIs $75k-100k, 0.1% for AGIs over 100k)
Self-employed pension: $20,801 (reported on 2.3% of returns)
Here:
$20,801
Florida:
$15,857
(% of AGI for various income ranges: 0.2% for AGIs $25k-50k, 0.2% for AGIs $50k-75k, 0.2% for AGIs $75k-100k, 0.3% for AGIs over 100k)
Total itemized deductions: $31,609 (13% of AGI, reported on 54.8% of returns)
Here:
$31,609
State:
$20,370
Here:
13.3% of AGI
State:
20.7% of AGI
(% of AGI for various income ranges: 23.3% for AGIs $10k-25k, 20.8% for AGIs $25k-50k, 20.4% for AGIs $50k-75k, 20.9% for AGIs $75k-100k, 9.3% for AGIs over 100k)
Charity contributions deductions: $8,019 (3% of AGI, reported on 50.4% of returns)
Here:
$8,019
State:
$4,064
Here:
3.2% of AGI
State:
3.8% of AGI
(% of AGI for various income ranges: 2.0% for AGIs $10k-25k, 2.2% for AGIs $25k-50k, 2.7% for AGIs $50k-75k, 3.2% for AGIs $75k-100k, 2.6% for AGIs over 100k)
Total tax: $38,552 (reported on 83.0% of returns)
32082:
$38,552
State:
$9,431
(% of AGI for various income ranges: 4.7% for AGIs $10k-25k, 7.7% for AGIs $25k-50k, 10.0% for AGIs $50k-75k, 10.5% for AGIs $75k-100k, 22.6% for AGIs over 100k)
Earned income credit: $1,305 (reported on 4.4% of returns)
Here:
$1,305
State:
$1,808
Percentage of individuals using paid preparers for their 2004 taxes: 61.1%
Here:
61%
State:
60%
(% for various income ranges: 54.3% for AGIs below $10k, 53.3% for AGIs $10k-25k, 53.9% for AGIs $25k-50k, 60.8% for AGIs $50k-75k, 60.4% for AGIs $75k-100k, 72.3% for AGIs over 100k)
Household received Food Stamps/SNAP in the past 12 months: 106 Household did not receive Food Stamps/SNAP in the past 12 months: 12,840
Women who had a birth in the past 12 months: 210 (221 now married, 0 unmarried) Women who did not have a birth in the past 12 months: 5,305 (2,193 now married, 3,112 unmarried)
Housing units in zip code 32082 with a mortgage: 6,193 (828 second mortgage, 18 home equity loan, 774 both second mortgage and home equity loan) Houses without a mortgage: 256
Median monthly owner costs for units with a mortgage: $2,811 Median monthly owner costs for units without a mortgage: $947
Residents with income below the poverty level in 2022:
This zip code:
4.0%
Whole state:
12.7%
Residents with income below 50% of the poverty level in 2022:
This zip code:
1.3%
Whole state:
6.6%
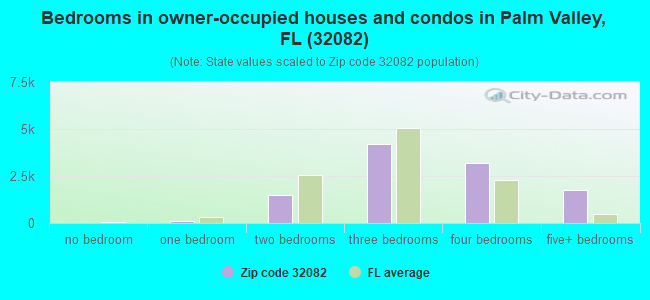
Median number of rooms in houses and condos:
Here:
7.2
State:
5.9
Median number of rooms in apartments:
Here:
4.4
State:
4.2
Notable locations in this zip code not listed on our city pages
Notable locations in zip code 32082: Booth Landing (A), Cook Landing (B), Silver Lakes Recreational Resort and Golf Club (C), Sherbrooke Golf and Country Club (D), Cultural Center at Ponte Vedra (E), Ponte Vedra Golf Course (F), Shell Bluff Landing (G), Pointe Verdra Village Square (H), Saint Johns County Public Library System Ponte Vedra Beach Branch Library (I), Saint Johns County Fire Rescue Station 10 Ponte Vedra (J), Saint Johns County Fire Rescue Station 1 Palm Valley (K), Saint Johns County Sheriff's Office (L), Saint Johns County Fire Rescue Station 9 South Ponte Vedra (M). Display/hide their locations on the map
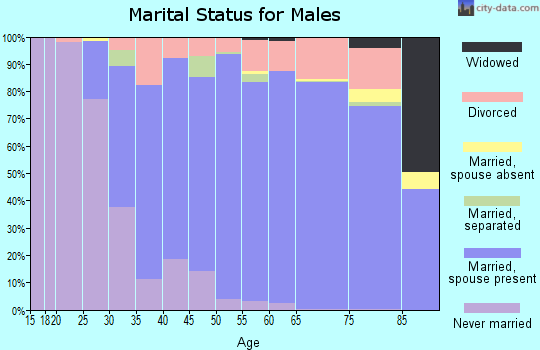
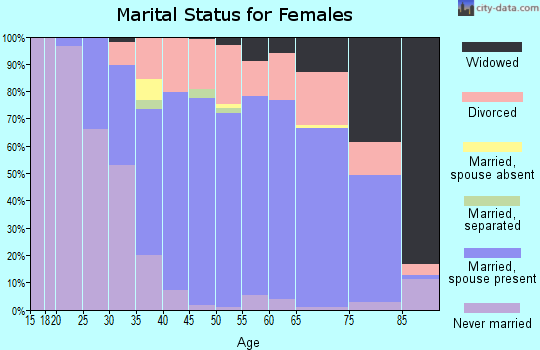
4,215 married couples with children.
755 single-parent households (240 men, 515 women).
92.5% of residents of 32082 zip code speak English at home.
3.3% of residents speak Spanish at home (88% very well, 6% well, 6% not well).
3.1% of residents speak other Indo-European language at home (94% very well, 4% well, 2% not well).
0.7% of residents speak Asian or Pacific Island language at home (70% very well, 27% well, 3% not well).
0.4% of residents speak other language at home (95% very well, 5% not well).
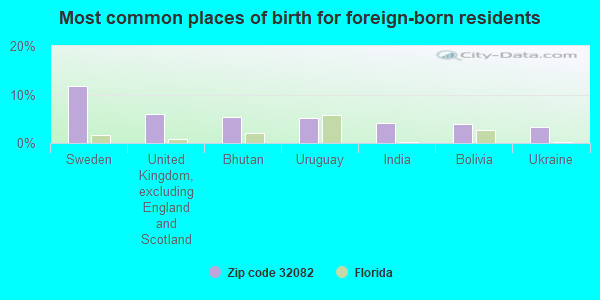
Foreign born population: 2,483 (8.4%) (76.9% of them are naturalized citizens)
This zip code:
8.4%
Whole state:
21.7%
12%Sweden
6%United Kingdom, excluding England and Scotland
5%Bhutan
5%Uruguay
4%India
4%Bolivia
3%Ukraine
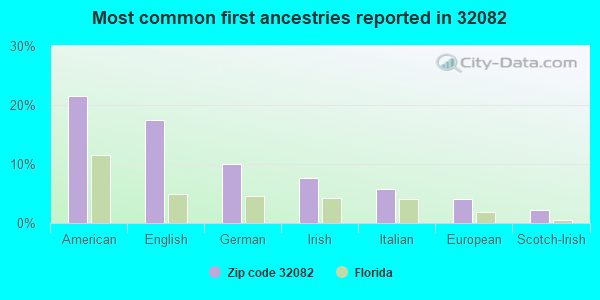
22%American
17%English
10%German
8%Irish
6%Italian
4%European
2%Scotch-Irish
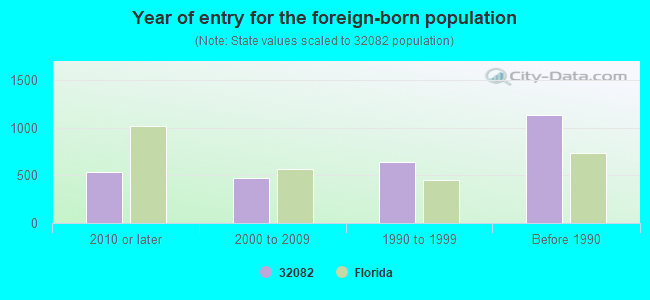
Year of entry for the foreign-born population
5362010 or later
4722000 to 2009
6361990 to 1999
1,135Before 1990
Major facilities with environmental interests located in this zip code:
MARSH LANDING WASTEWATER TREAM (166 MARSH COVE DR. in PONTE VEDRA BEACH, FL)
National Pollutant Discharge Elimination System NON-MAJOR (Tracking pollutant discharge elimination systems) - permit - ICIS-, ENFORCEMENT/COMPLIANCE ACTIVITY National Pollutant Discharge Elimination System NON-MAJOR (Tracking pollutant discharge elimination systems) - permit Business SIC classification: SEWERAGE SYSTEMS Alternative names: MARSH LANDING WET WEATHER DISH, MARSH LANDING WWTP, ST. JOHNS SERVICE COMPANY
PLAYERS CLUB SOUTH (5250 PALM VALLEY ROADTPC PARKI in PONTE VEDRA BEACH, FL)
National Pollutant Discharge Elimination System NON-MAJOR (Tracking pollutant discharge elimination systems) - permit - ICIS-, ENFORCEMENT/COMPLIANCE ACTIVITY Business SIC classification: SEWERAGE SYSTEMS Alternative names: PLAYERS CLUB WET WEATHER DISCH, ST. JOHNS SERVICE COMPANY
ALICE B. LANDRUM MIDDLE SCHOOL (230 LANDRUM LANE in PONTE VEDRA BEACH, FL)
(National Center for Education Statistics) - STATE ID-0311 Organizations: ST. JOHNS COUNTY SCHOOL DISTRICT (SCHOOL DISTRICT)
MARJORIE K. RAWLINGS-PONTE VEDRA/PALM VALLEY ELEME ( in PONTE VEDRA BEACH, FL)
(National Center for Education Statistics) - STATE ID-0351 Organizations: ST. JOHNS COUNTY SCHOOL DISTRICT (SCHOOL DISTRICT)
OCEAN PALMS ELEMENTARY SCHOOL (355 LANDRUM LANE in PONTE VEDRA BEACH, FL)
(National Center for Education Statistics) - STATE ID-0391 Organizations: ST. JOHNS COUNTY SCHOOL DISTRICT (SCHOOL DISTRICT)
HANDICRAFTS CLEANERS (330 A1A NORTH SUITE 215 in PONTE VEDRA BEACH, FL)
AIR MINOR (AIRS/AFS) (Resource Conservation and Recovery Act (tracking hazardous waste)) Business SIC classification: DRYCLEANING PLANTS, EXCEPT RUG CLEANING Organizations: WALID KORIAL (CONTACT/OWNER)
Alternative names: HANDICRAFT CLEANERS, HANDY CRAFT CLEANERS
PONTE VEDRA CUSTOM CLEANERS (152 HIGHWAY A1A in PONTE VEDRA BEACH, FL)
AIR MINOR (AIRS/AFS) (Resource Conservation and Recovery Act (tracking hazardous waste)) Business SIC classification: DRYCLEANING PLANTS, EXCEPT RUG CLEANING Organizations: KAY JONES (CONTACT/OWNER)
RED/JD INC (520 SAWGRASS VILLAGE DRIVE in PONTE VEDRA BEACH, FL)
AIR MINOR (AIRS/AFS) (Resource Conservation and Recovery Act (tracking hazardous waste)) Business SIC classification: DRYCLEANING PLANTS, EXCEPT RUG CLEANING Organizations: RONALD DAVIS, PRES (CONTACT/OWNER)
Alternative names: SAVELBERG CLEANERS
MEDITIERRA AT PONTE VEDRA (MICKLER ROAD in PALM VALLEY, FL)
National Pollutant Discharge Elimination System NON-MAJOR (Tracking pollutant discharge elimination systems) - permit Organizations: SALLY HALL (CONTACT/OWNER)
MICKLERS BEND (N/A in PONTE VEDRA BEACH, FL)
National Pollutant Discharge Elimination System NON-MAJOR (Tracking pollutant discharge elimination systems) - permit Organizations: DALE POLSTON (CONTACT/OWNER)
OCEAN GRANDE AT SERENATA PHASE (3171 S PONTE VEDRA BLVD in PONTE VEDRA BCH, FL)
National Pollutant Discharge Elimination System NON-MAJOR (Tracking pollutant discharge elimination systems) - permit Organizations: EARL BRIGHT (CONTACT/OWNER)
Alternative names: FLP ELECTRIC GENERATING
PAYASADA ESTATES (OLD PALM VALLEY RD in PONTE VEDRA, FL)
National Pollutant Discharge Elimination System NON-MAJOR (Tracking pollutant discharge elimination systems) - permit Organizations: RYAN SCHMITT (CONTACT/OWNER)
Alternative names: ALPHA GARY CORP-MECKLENBURG
SMOKERS EXPRESS # 6075 (158 A1A NORTH in PONTE VEDRA BEACH, FL)
National Pollutant Discharge Elimination System NON-MAJOR (Tracking pollutant discharge elimination systems) - permit Organizations: RENEE THOMAS (CONTACT/OWNER)
Housing units lacking complete plumbing facilities: 0.3% Housing units lacking complete kitchen facilities: 0.0%
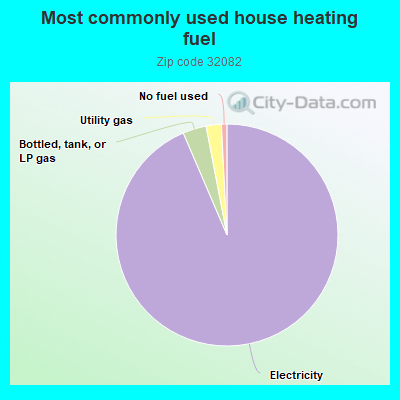
93.0%Electricity
3.4%Bottled, tank, or LP gas
2.2%Utility gas
0.8%No fuel used
Population in 1990: 14,727. Population change in the 1990s: +13,040 (+88.5%).
Place of birth for U.S.-born residents:
This state: 8,283
Northeast: 6,589
Midwest: 4,261
South: 6,126
West: 1,299
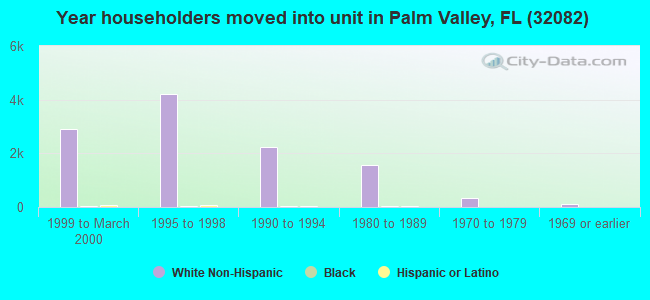
42% of the 32082 zip code residents lived in the same house 5 years ago. Out of people who lived in different houses, 25% lived in this county. Out of people who lived in different counties, 50% lived in Florida.
89% of the 32082 zip code residents lived in the same house 1 year ago. Out of people who lived in different houses, 39% moved from this county. Out of people who lived in different houses, 33% moved from different county within same state. Out of people who lived in different houses, 24% moved from different state. Out of people who lived in different houses, 5% moved from abroad.
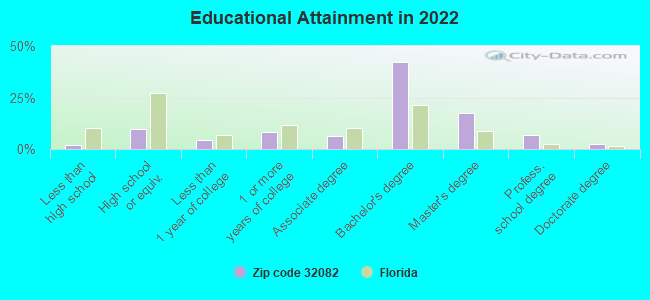
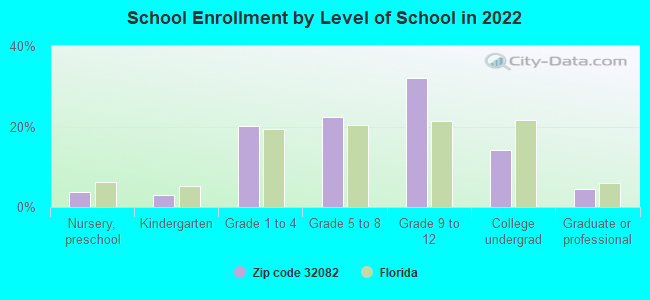
Private vs. public school enrollment:
Students in private schools in grades 1 to 8 (elementary and middle school): 566
Here:
23.8%
Florida:
15.8%
Students in private schools in grades 9 to 12 (high school): 136
Here:
7.7%
Florida:
12.9%
Students in private undergraduate colleges: 149
Here:
18.8%
Florida:
23.6%
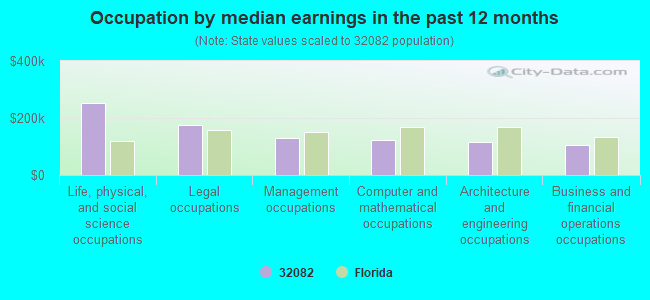
Occupation by median earnings in the past 12 months ($)
254,144Life, physical, and social science occupations
174,067Legal occupations
130,463Management occupations
121,335Computer and mathematical occupations
117,094Architecture and engineering occupations
106,957Business and financial operations occupations
Companies with biggest federal contracts located in this zip code:
GRUNDY MARINE CONSTRUCTION COM (2209 PARK PLACE in PONTE VEDRA BE, FL; small business) : $80,673,367 in 284 contractsfrom 1999 to 2006
Contracts for Construction of Structures and Facilities -- Other Non-Building Facilities, Construction of Structures and Facilities -- Miscellaneous Buildings, Construction of Structures and Facilities -- Other Conservation and Development Facilities, Construction of Structures and Facilities -- Electronic and Communications Facilities, and moreby Army, U.S. Army Corps of Engineers - civil program financing only, Employment and Training Administration, Air Force, and others Signed by year:2000: $1,892,493; 2001: $17,981,532; 2002: $9,665,496; 2003: $4,227,553; 2004: $28,755,809; 2005: $9,830,264; 2006: $4,771,521.
Biggest contracts:
$7,229,985 with Army for Construction of Structures and Facilities -- Other Non-Building Facilities. Signed on 2001-02-23. Completion date: 2002-06-01.
$4,669,672 with Army for Construction of Structures and Facilities -- Miscellaneous Buildings. Signed on 2001-02-09. Completion date: 2002-02-22.
$3,879,438 with Army for Construction of Structures and Facilities -- Other Conservation and Development Facilities. Signed on 2004-03-12. Completion date: 2003-09-30.
$3,879,438 with U.S. Army Corps of Engineers - civil program financing only for Construction of Structures and Facilities -- Other Conservation and Development Facilities. Signed on 2004-03-12. Completion date: 2003-09-30.
ROMINE, LESTER W (144 SOUTH BEND DR in PONTE VEDRA BE, FL; small business) : $429,584 in 3 contractsfrom 2004 to 2005
$202,467 with Navy for General Health Care Services. Signed on 2005-10-01. Completion date: 2006-09-30.
$195,437, same as above.Signed on 2004-12-23. Completion date: 2005-09-30.
$31,680, same as above.Signed on 2004-05-27. Completion date: 2004-09-30.
BOSTON M D , JILL D (333 CROSSROADS LAKES DR in PONTE VEDRA BE, FL; small business) : $406,257 in 4 contractsfrom 2004 to 2005
$189,738 with Navy for Pediatric Services. Signed on 2005-10-01. Completion date: 2006-09-30.
$185,832, same as above.Signed on 2004-12-23. Completion date: 2005-09-30.
$31,328, same as above.Signed on 2004-07-12. Completion date: 2004-09-30.
-$641, same as above.Signed on 2005-06-03. Completion date: 2005-09-30.
JOHN M JOYNER (137 MILL COVE LANE in PONTE VEDRA, FL; small business) : $217,990 in 4 contractsfrom 1999 to 2001
$76,128 with Navy for Dentistry Services. Signed on 2000-10-24. Completion date: 2001-09-30.
$75,036, same as above.Signed on 1999-10-01. Completion date: 2000-09-30.
$66,825, same as above.Signed on 2001-10-01. Completion date: 2001-09-30.
$1, same as above.Signed on 2000-10-01. Completion date: 2001-09-30.
STEVEN D MCCLINTOCK D D S (173 ROSCOE BOULEVARD NORTH in PONTE VEDRA BE, FL; small business) : $178,318 in 2 contractsfrom 1999 to 2000
$90,480 with Navy for Dentistry Services. Signed on 2000-10-25. Completion date: 2001-09-30.
$87,838, same as above.Signed on 1999-10-01. Completion date: 2000-09-30.
WILLIAM A BERGEN (1535 HARBOUR CLUB DR in PONTE VEDRA BE, FL; small business) : $103,184 in 9 contractsfrom 2002 to 2006
Contracts for Other Professional Services, Technical Writing Services, Other Education and Training Services by U.S. Army Corps of Engineers - civil program financing only, Army Signed by year:2000: $0; 2001: $0; 2002: $29,000; 2003: $0; 2004: $66,208; 2005: $1,215; 2006: $6,761.
Biggest contracts:
$29,000 with U.S. Army Corps of Engineers - civil program financing only for Other Professional Services. Signed on 2002-07-01. Completion date: 2003-03-31.
$27,550 with U.S. Army Corps of Engineers - civil program financing only for Technical Writing Services. Signed on 2004-06-04. Completion date: 2005-08-01.
$27,550 with Army for Technical Writing Services. Signed on 2004-06-04. Completion date: 2005-08-01.
$6,761 with Army for Other Education and Training Services. Taking place in TN. Signed on 2006-02-01. Completion date: 2006-07-21.
OMEGA TECH, INC (1 BARRACUDA PL in PONTE VEDRA BE, FL; small business)
$88,230 with Defense Logistics Agency for Semiconductor Devices and Associated Hardware. Signed on 2000-12-07. Completion date: 2001-02-05.
GLOBAL TEK SYSTEMS, INC (1 BARRACUDA PL in PONTE VEDRA BE, FL; small business) : $76,882 in 2 contractsin 2001
$46,900 with Defense Logistics Agency for Microcircuits, Electronic. Signed on 2001-05-22. Completion date: 2001-07-21.
$29,982, same as above.Signed on 2001-07-05. Completion date: 2001-09-03.
MARDESSA-K CORP (818 AIA NORTH, STE 207G in PONTE VEDRA BE, AZ; small business) : $44,302 in 2 contractsin 2002
$42,965 with Air Force for Maintenance, Repair or Alteration of Real Property -- Other Administrative Facilities and Service Buildings. Signed on 2002-09-27. Completion date: 2002-09-30.
$1,337, same as above.Signed on 2002-11-21. Completion date: 2002-11-25.
COMPUTER PRODUCTS INC (181 LAMP LIGHTER LN in PONTE VEDRA BE, FL; small business)
$44,252 with Air Force for ADP Supplies. Taking place in TX. Signed on 2005-09-02. Completion date: 2008-09-19.
Top industries in this zip code by the number of employees in 2005:
Accommodation and Food Services: Hotels (except Casino Hotels) and Motels (500-999 employees: 2 establishments, 100-249 employees: 1 establishment)
Professional, Scientific, and Technical Services: Other Accounting Services (500-999: 1, 20-49: 1, 1-4: 5)
Arts, Entertainment, and Recreation: Golf Courses and Country Clubs (100-249: 3, 20-49: 1, 5-9: 1)
Health Care and Social Assistance: Continuing Care Retirement Communities (250-499: 1, 100-249: 1)
Other Services (except Public Administration): Other Similar Organizations (except Business, Professional, Labor, and Political Organizations) (250-499: 1, 20-49: 3, 1-4: 1)
Other Services (except Public Administration): Religious Organizations (100-249: 1, 20-49: 1, 10-19: 1, 5-9: 3, 1-4: 6)
Health Care and Social Assistance: Offices of Physicians (except Mental Health Specialists) (20-49: 4, 10-19: 1, 5-9: 10, 1-4: 11)
2002 - 2018 National Fire Incident Reporting System (NFIRS) incidents
According to the data from the years 2002 - 2018 the average number of fires per year is 53. The highest number of reported fire incidents - 87 took place in 2004, and the least - 6 in 2009. The data has a rising trend.
When looking into fire subcategories, the most reports belonged to: Structure Fires (42.5%), and Outside Fires (39.3%).
Fire incident types reported to NFIRS in Zip Code 32082


 Nearest zip codes: 32081, 32095, 32256, 32250, 32224, 32258.


 According to the data from the years 2002 - 2018 the average number of fires per year is 53. The highest number of reported fire incidents - 87 took place in 2004, and the least - 6 in 2009. The data has a rising trend.
 When looking into fire subcategories, the most reports belonged to: Structure Fires (42.5%), and Outside Fires (39.3%).