Estimated zip code population in 2022: 20,789 Zip code population in 2010: 18,817 Zip code population in 2000: 20,224
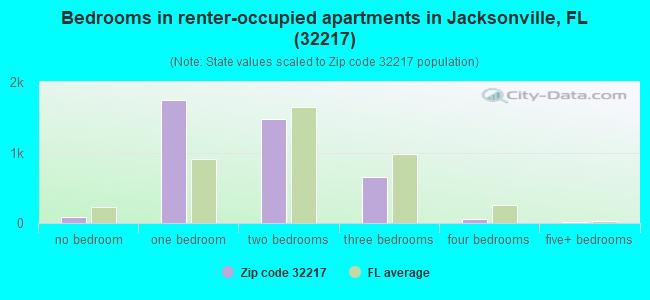
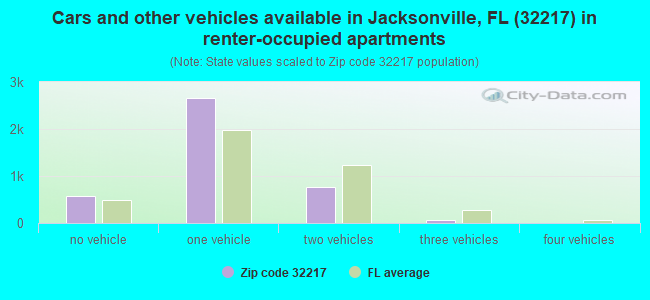
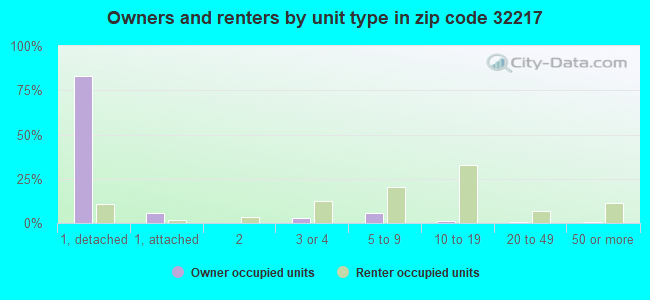
Houses and condos: 9,813 Renter-occupied apartments: 4,034
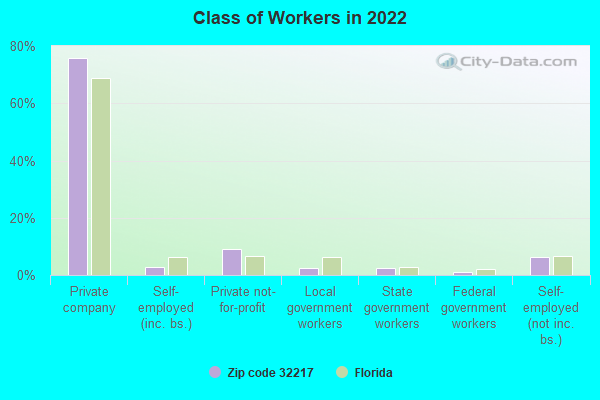
% of renters here:
43%
State:
33%
March 2022 cost of living index in zip code 32217: 89.1 (less than average, U.S. average is 100)
Land area: 5.3 sq. mi. Water area: 3.8 sq. mi.
Population density: 3,937 people per square mile
(average).
OSM Map
General Map
Google Map
MSN Map
OSM Map
General Map
Google Map
MSN Map
OSM Map
General Map
Google Map
MSN Map
OSM Map
General Map
Google Map
MSN Map
Please wait while loading the map...
Real estate property taxes paid for housing units in 2022:
This zip code:
0.6% ($2,117)
Florida:
0.7% ($2,529)
Median real estate property taxes paid for housing units with mortgages in 2022: $2,392 (0.7%) Median real estate property taxes paid for housing units with no mortgage in 2022: $1,802 (0.6%)
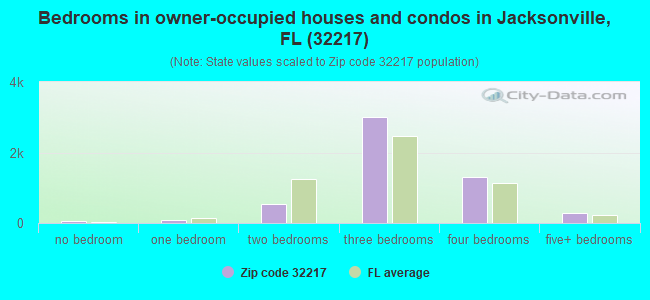
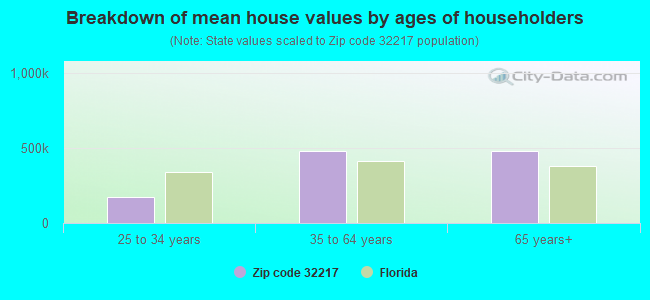
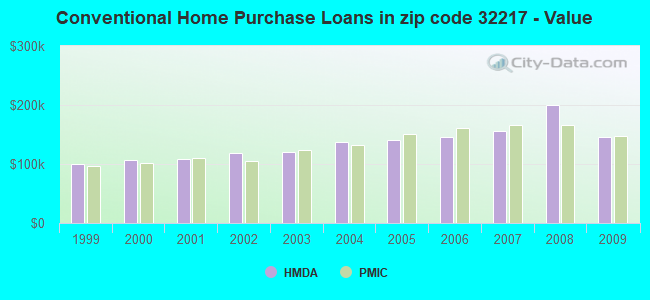
Estimated median house/condo value in 2022: $330,348
32217:
$330,348
Florida:
$354,100
According to our research of Florida and other state lists, there were 14 registered sex offenders living in 32217 zip code as of April 27, 2024. The ratio of all residents to sex offenders in zip code 32217 is 1,372 to 1. The ratio of registered sex offenders to all residents in this zip code is lower than the state average.
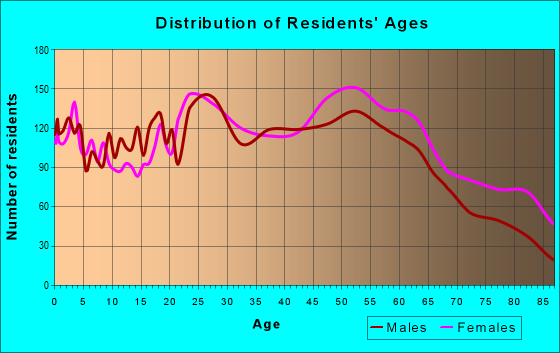
Median resident age:
This zip code:
37.4 years
Florida median age:
42.7 years
Average household size:
This zip code:
2.2 people
Florida:
2.5 people
Averages for the 2020 tax year for zip code 32217, filed in 2021:
Average Adjusted Gross Income (AGI) in 2020: $87,932 (Individual Income Tax Returns)
Here:
$87,932
State:
$82,200
Salary/wage: $61,948 (reported on 78.4% of returns)
Here:
$61,948
State:
$58,347
(% of AGI for various income ranges: 1258.2% for AGIs below $25k, 3836.1% for AGIs $25k-50k, 6789.8% for AGIs $50k-75k, 9666.5% for AGIs $75k-100k, 18743.9% for AGIs $100k-200k, 109314.7% for AGIs over 200k)
Taxable interest for individuals: $3,349 (reported on 30.5% of returns)
This zip code:
$3,349
Florida:
$4,272
(% of AGI for various income ranges: 17.0% for AGIs below $25k, 28.2% for AGIs $25k-50k, 71.6% for AGIs $50k-75k, 178.0% for AGIs $75k-100k, 322.5% for AGIs $100k-200k, 3940.0% for AGIs over 200k)
Ordinary dividends: $13,481 (reported on 21.3% of returns)
Here:
$13,481
State:
$15,863
(% of AGI for various income ranges: 31.3% for AGIs below $25k, 50.2% for AGIs $25k-50k, 167.9% for AGIs $50k-75k, 294.1% for AGIs $75k-100k, 873.2% for AGIs $100k-200k, 12760.7% for AGIs over 200k)
Net capital gain/loss in AGI: +$53,902 (reported on 18.4% of returns)
Here:
+$53,902
State:
+$62,983
(% of AGI for various income ranges: 8.6% for AGIs below $25k, 27.5% for AGIs $25k-50k, 96.5% for AGIs $50k-75k, 344.7% for AGIs $75k-100k, 1038.8% for AGIs $100k-200k, 60312.0% for AGIs over 200k)
Profit/loss from business: +$12,840 (reported on 19.5% of returns)
Here:
+$12,840
State:
+$9,719
(% of AGI for various income ranges: 218.4% for AGIs below $25k, 200.7% for AGIs $25k-50k, 203.4% for AGIs $50k-75k, 360.6% for AGIs $75k-100k, 830.5% for AGIs $100k-200k, 5027.3% for AGIs over 200k)
Taxable individual retirement arrangement distribution: $31,693 (reported on 9.6% of returns)
32217:
$31,693
Florida:
$24,823
(% of AGI for various income ranges: 48.8% for AGIs below $25k, 89.8% for AGIs $25k-50k, 238.9% for AGIs $50k-75k, 510.8% for AGIs $75k-100k, 1377.0% for AGIs $100k-200k, 9945.3% for AGIs over 200k)
Self-employed (Keogh) retirement plans: $18,925 (reported on 0.4% of returns)
32217:
$18,925
Florida:
$29,694
(% of AGI for various income ranges: 504.7% for AGIs over 200k)
Total itemized deductions: $46,667 (reported on 7.2% of returns)
Here:
$46,667
State:
$45,393
(% of AGI for various income ranges: 41.2% for AGIs below $25k, 125.0% for AGIs $25k-50k, 302.9% for AGIs $50k-75k, 432.2% for AGIs $75k-100k, 1077.5% for AGIs $100k-200k, 12716.0% for AGIs over 200k)
Charity contributions: $26,297 (reported on 6.1% of returns)
Here:
$26,297
State:
$20,178
(% of AGI for various income ranges: 3.8% for AGIs below $25k, 22.1% for AGIs $25k-50k, 48.5% for AGIs $50k-75k, 139.2% for AGIs $75k-100k, 316.8% for AGIs $100k-200k, 8382.7% for AGIs over 200k)
Taxes paid: $6,130 (reported on 7.1% of returns)
32217:
$6,130
State:
$6,967
(% of AGI for various income ranges: 5.5% for AGIs below $25k, 15.5% for AGIs $25k-50k, 40.4% for AGIs $50k-75k, 78.4% for AGIs $75k-100k, 191.1% for AGIs $100k-200k, 1377.3% for AGIs over 200k)
Earned income credit: $2,218 (reported on 17.7% of returns)
Here:
$2,218
State:
$2,306
(% of AGI for various income ranges: 113.8% for AGIs below $25k, 60.7% for AGIs $25k-50k)
Percentage of individuals using paid preparers for their 2020 taxes: 90.7%
Here:
91%
State:
92%
(% for various income ranges: 88.1% for AGIs below $25k, 93.2% for AGIs $25k-50k, 90.4% for AGIs $50k-75k, 91.5% for AGIs $75k-100k, 92.4% for AGIs $100k-200k, 91.4% for AGIs over 200k)
Averages for the 2012 tax year for zip code 32217, filed in 2013:
Average Adjusted Gross Income (AGI) in 2012: $67,708 (Individual Income Tax Returns)
Here:
$67,708
State:
$60,316
Salary/wage: $48,030 (reported on 80.9% of returns)
Here:
$48,030
State:
$45,277
(% of AGI for various income ranges: 76.9% for AGIs below $25k, 80.5% for AGIs $25k-50k, 72.1% for AGIs $50k-75k, 68.2% for AGIs $75k-100k, 64.9% for AGIs $100k-200k, 37.8% for AGIs over 200k)
Taxable interest for individuals: $3,547 (reported on 32.6% of returns)
This zip code:
$3,547
Florida:
$3,587
(% of AGI for various income ranges: 1.4% for AGIs below $25k, 1.1% for AGIs $25k-50k, 1.3% for AGIs $50k-75k, 1.4% for AGIs $75k-100k, 1.9% for AGIs $100k-200k, 2.1% for AGIs over 200k)
Ordinary dividends: $11,999 (reported on 22.5% of returns)
Here:
$11,999
State:
$12,831
(% of AGI for various income ranges: 2.1% for AGIs below $25k, 1.6% for AGIs $25k-50k, 3.0% for AGIs $50k-75k, 2.6% for AGIs $75k-100k, 4.8% for AGIs $100k-200k, 5.3% for AGIs over 200k)
Net capital gain/loss in AGI: +$28,358 (reported on 17.5% of returns)
Here:
+$28,358
State:
+$33,493
(% of AGI for various income ranges: 0.6% for AGIs $75k-100k, 2.3% for AGIs $100k-200k, 16.2% for AGIs over 200k)
Profit/loss from business: +$12,801 (reported on 16.0% of returns)
Here:
+$12,801
State:
+$10,012
(% of AGI for various income ranges: 8.2% for AGIs below $25k, 2.4% for AGIs $25k-50k, 1.9% for AGIs $50k-75k, 2.2% for AGIs $75k-100k, 2.7% for AGIs $100k-200k, 2.8% for AGIs over 200k)
Taxable individual retirement arrangement distribution: $24,531 (reported on 11.8% of returns)
32217:
$24,531
Florida:
$21,544
(% of AGI for various income ranges: 3.0% for AGIs below $25k, 2.6% for AGIs $25k-50k, 3.5% for AGIs $50k-75k, 5.1% for AGIs $75k-100k, 5.8% for AGIs $100k-200k, 4.4% for AGIs over 200k)
Self-employment retirement plans: $25,480 (reported on 0.5% of returns)
32217:
$25,480
Florida:
$20,611
(% of AGI for various income ranges: 0.5% for AGIs $50k-75k, 0.3% for AGIs over 200k)
Total itemized deductions: $23,677 (14% of AGI, reported on 25.7% of returns)
Here:
$23,677
State:
$25,533
Here:
14.2% of AGI
State:
18.0% of AGI
(% of AGI for various income ranges: 8.6% for AGIs below $25k, 9.9% for AGIs $25k-50k, 11.6% for AGIs $50k-75k, 9.9% for AGIs $75k-100k, 12.6% for AGIs $100k-200k, 6.5% for AGIs over 200k)
Charity contributions: $6,530 (reported on 21.5% of returns)
Here:
$6,530
State:
$5,698
(% of AGI for various income ranges: 0.9% for AGIs below $25k, 1.4% for AGIs $25k-50k, 1.8% for AGIs $50k-75k, 2.0% for AGIs $75k-100k, 2.9% for AGIs $100k-200k, 2.2% for AGIs over 200k)
Taxes paid: $5,547 (reported on 24.9% of returns)
32217:
$5,547
State:
$6,203
(% of AGI for various income ranges: 1.3% for AGIs below $25k, 1.6% for AGIs $25k-50k, 2.1% for AGIs $50k-75k, 2.0% for AGIs $75k-100k, 2.8% for AGIs $100k-200k, 2.0% for AGIs over 200k)
Earned income credit: $2,392 (reported on 22.6% of returns)
Here:
$2,392
State:
$2,372
(% of AGI for various income ranges: 7.9% for AGIs below $25k, 1.2% for AGIs $25k-50k)
Percentage of individuals using paid preparers for their 2012 taxes: 52.6%
Here:
53%
State:
54%
(% for various income ranges: 51.8% for AGIs below $25k, 48.7% for AGIs $25k-50k, 50.4% for AGIs $50k-75k, 50.0% for AGIs $75k-100k, 61.0% for AGIs $100k-200k, 79.5% for AGIs over 200k)
Averages for the 2004 tax year for zip code 32217, filed in 2005:
Average Adjusted Gross Income (AGI) in 2004: $62,069 (Individual Income Tax Returns)
Here:
$62,069
State:
$50,523
Salary/wage: $46,245 (reported on 82.8% of returns)
Here:
$46,245
State:
$39,563
(% of AGI for various income ranges: 96.3% for AGIs below $10k, 81.6% for AGIs $10k-25k, 81.9% for AGIs $25k-50k, 73.0% for AGIs $50k-75k, 71.2% for AGIs $75k-100k, 49.0% for AGIs over 100k)
Taxable interest for individuals: $4,172 (reported on 44.8% of returns)
This zip code:
$4,172
Florida:
$3,211
(% of AGI for various income ranges: 6.0% for AGIs below $10k, 2.4% for AGIs $10k-25k, 1.9% for AGIs $25k-50k, 2.6% for AGIs $50k-75k, 2.6% for AGIs $75k-100k, 3.5% for AGIs over 100k)
Taxable dividends: $7,947 (reported on 26.5% of returns)
Here:
$7,947
State:
$6,129
(% of AGI for various income ranges: 8.7% for AGIs below $10k, 1.8% for AGIs $10k-25k, 1.3% for AGIs $25k-50k, 2.3% for AGIs $50k-75k, 1.9% for AGIs $75k-100k, 4.5% for AGIs over 100k)
Net capital gain/loss: +$27,305 (reported on 22.3% of returns)
Here:
+$27,305
State:
+$27,205
(% of AGI for various income ranges: -1.4% for AGIs below $10k, 0.2% for AGIs $10k-25k, 0.3% for AGIs $25k-50k, 1.5% for AGIs $50k-75k, 2.3% for AGIs $75k-100k, 16.8% for AGIs over 100k)
Profit/loss from business: +$14,624 (reported on 13.3% of returns)
Here:
+$14,624
State:
+$10,634
(% of AGI for various income ranges: 8.2% for AGIs below $10k, 4.7% for AGIs $10k-25k, 2.6% for AGIs $25k-50k, 2.9% for AGIs $50k-75k, 2.9% for AGIs $75k-100k, 3.0% for AGIs over 100k)
IRA payment deduction: $3,153 (reported on 2.2% of returns)
32217:
$3,153
Florida:
$3,082
(% of AGI for various income ranges: 0.1% for AGIs $10k-25k, 0.2% for AGIs $25k-50k, 0.2% for AGIs $50k-75k, 0.2% for AGIs $75k-100k, 0.1% for AGIs over 100k)
Self-employed pension: $19,560 (reported on 0.8% of returns)
Here:
$19,560
Florida:
$15,857
(% of AGI for various income ranges: 0.1% for AGIs $10k-25k, 0.1% for AGIs $50k-75k, 0.4% for AGIs over 100k)
Total itemized deductions: $22,091 (17% of AGI, reported on 29.2% of returns)
Here:
$22,091
State:
$20,370
Here:
17.0% of AGI
State:
20.7% of AGI
(% of AGI for various income ranges: 14.4% for AGIs below $10k, 9.4% for AGIs $10k-25k, 10.7% for AGIs $25k-50k, 12.2% for AGIs $50k-75k, 11.7% for AGIs $75k-100k, 9.8% for AGIs over 100k)
Charity contributions deductions: $6,052 (5% of AGI, reported on 25.7% of returns)
Here:
$6,052
State:
$4,064
Here:
4.6% of AGI
State:
3.8% of AGI
(% of AGI for various income ranges: 0.7% for AGIs below $10k, 1.3% for AGIs $10k-25k, 1.7% for AGIs $25k-50k, 2.5% for AGIs $50k-75k, 2.5% for AGIs $75k-100k, 2.9% for AGIs over 100k)
Total tax: $13,345 (reported on 74.7% of returns)
32217:
$13,345
State:
$9,431
(% of AGI for various income ranges: 3.0% for AGIs below $10k, 4.0% for AGIs $10k-25k, 7.1% for AGIs $25k-50k, 9.8% for AGIs $50k-75k, 11.7% for AGIs $75k-100k, 22.3% for AGIs over 100k)
Earned income credit: $1,711 (reported on 17.7% of returns)
Here:
$1,711
State:
$1,808
Percentage of individuals using paid preparers for their 2004 taxes: 57.0%
Here:
57%
State:
60%
(% for various income ranges: 53.1% for AGIs below $10k, 57.4% for AGIs $10k-25k, 52.9% for AGIs $25k-50k, 57.5% for AGIs $50k-75k, 56.4% for AGIs $75k-100k, 72.5% for AGIs over 100k)
Likely homosexual households (counted as self-reported same-sex unmarried-partner households)
Lesbian couples: 0.0% of all households
Gay men: 0.5% of all households
Household received Food Stamps/SNAP in the past 12 months: 1,281 Household did not receive Food Stamps/SNAP in the past 12 months: 8,028
Women who had a birth in the past 12 months: 250 (235 now married, 24 unmarried) Women who did not have a birth in the past 12 months: 4,337 (2,139 now married, 2,198 unmarried)
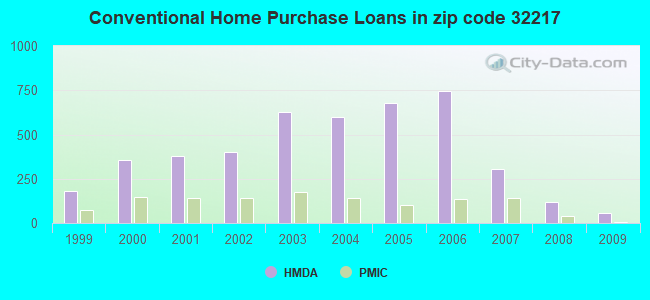
Housing units in zip code 32217 with a mortgage: 3,183 (156 second mortgage, 113 both second mortgage and home equity loan) Houses without a mortgage: 110
Median monthly owner costs for units with a mortgage: $1,641 Median monthly owner costs for units without a mortgage: $599
Residents with income below the poverty level in 2022:
This zip code:
13.9%
Whole state:
12.7%
Residents with income below 50% of the poverty level in 2022:
This zip code:
6.5%
Whole state:
6.6%
Median number of rooms in houses and condos:
Here:
6.5
State:
5.9
Median number of rooms in apartments:
Here:
3.7
State:
4.2
Notable locations in this zip code not listed on our city pages
Notable locations in zip code 32217: Heritage Ridge Golf Club (A), San Jose Country Club (B), Jacksonville Fire and Rescue Department Station 21 (C). Display/hide their locations on the map
Shopping Centers: University Mall (1), San Jose Plaza Shopping Center (2), James Road and 103rd Street Shopping Center (3), Cedar Hills Shopping Center (4), Orange Park Place Shopping Center (5). Display/hide their locations on the map
Churches in zip code 32217 include: San Jose Baptist Church (A), Wayman Chapel African Methodist Episcopal Church (B), Kingdom Hall of Jehovahs Witnesses (C), Word Life Church (D), Christ the Messiah Church (E), Charismatic Church (F), Lakewood United Methodist Church (G), Baymeadows Community Church (H), Baymeadows Baptist Church (I). Display/hide their locations on the map
In group quarters: 381 (-1 institutionalized population)
Size of family households: 2,485 2-persons, 1,594 3-persons, 750 4-persons, 387 5-persons, 100 6-persons, 5 7-or-more-persons
Size of nonfamily households: 3,260 1-person, 661 2-persons, 50 3-persons
2,696 married couples with children.
1,051 single-parent households (377 men, 674 women).
80.7% of residents of 32217 zip code speak English at home.
11.5% of residents speak Spanish at home (57% very well, 16% well, 16% not well, 11% not at all).
2.3% of residents speak other Indo-European language at home (51% very well, 25% well, 22% not well, 2% not at all).
1.4% of residents speak Asian or Pacific Island language at home (69% very well, 27% well, 4% not well).
4.0% of residents speak other language at home (74% very well, 26% well).
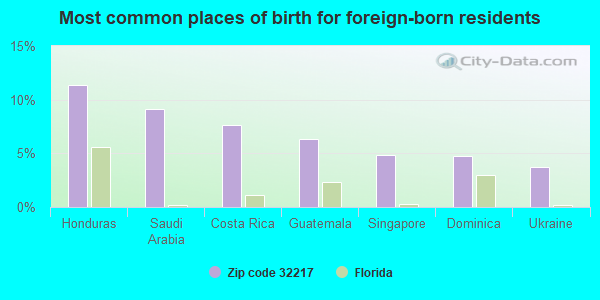
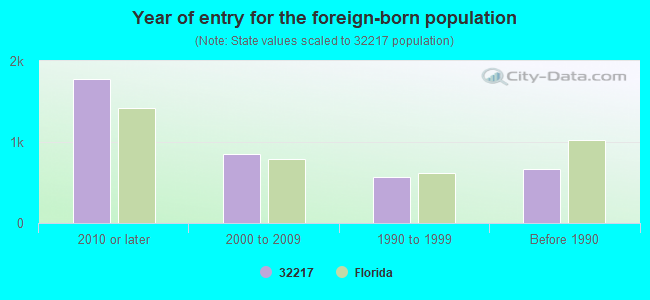
Foreign born population: 2,617 (12.6%) (56.9% of them are naturalized citizens)
Major facilities with environmental interests located in this zip code:
SAN JOSE WRF (7128 BALBOA ROAD in JACKSONVILLE, FL)
STATE MASTER (FDM) - WAFR-FL0023663, DOMESTIC WASTEWATER PROGRAM, WAFR-FLR05F518, NPDES STORMWATER PROGRAM, NPDES STORMWATER PERMIT National Pollutant Discharge Elimination System NON-MAJOR (Tracking pollutant discharge elimination systems) - permit Business SIC classification: SEWERAGE SYSTEMS Organizations: JEA, UNITED WATER FLORIDA, CADENHEAD ENVIRONMENTAL ENG SERVICE, INC, UNITED WATER FLORIDA, INC., PITMAN-HARTENSTEIN & ASSOCIATES, INC., JAX SUBURBAN UTL, JEA (CONTACT/APPLICANT)
, UNITED WATER FLORIDA, INC. (CONTACT/APPLICANT)
, CHRISTOPHER (CONTACT/APPLICANT)
, UNITED WATER FLORIDA (CONTACT/FACILITY)
, SUSAN HUGHES (CONTACT/OWNER)
, JEA (CONTACT/PERMIT)
, UNITED WATER FLORIDA, INC. (CONTACT/PERMIT)
Alternative names: SAN JOSE WWTF
SAN JUAN CLEANERS (6271 SAINT AUGUSTINE ROAD in JACKSONVILLE, FL)
AIR MINOR (AIRS/AFS) STATE MASTER (FDM) - CHAZ-FLR000015917, HAZARDOUS WASTE REGULATION PROGRAM Small Quantity Generators, between 100 kg and 1000 kg of hazardous waste/month (Resource Conservation and Recovery Act (tracking hazardous waste)) - notification Business SIC classification: DRYCLEANING PLANTS, EXCEPT RUG CLEANING Organizations: SHERRY ALICE, MGR (CONTACT/OWNER)
Alternative names: SHAMROCK CLEANERS, SWIFT CLEANERS INCORPORATED
1.99 CLEANERS (5111-13 BAYMEADOWS RD in JACKSONVILLE, FL)
STATE MASTER (FDM) - CHAZ-FLD982075939, HAZARDOUS WASTE REGULATION PROGRAM Small Quantity Generators, between 100 kg and 1000 kg of hazardous waste/month (Resource Conservation and Recovery Act (tracking hazardous waste)) Business SIC classification: DRYCLEANING PLANTS, EXCEPT RUG CLEANING Organizations: GLENN SEYMOUR, OWNER (CONTACT/OWNER)
Alternative names: EXTRA MILE DRYCLEANING
SOUTHERN UTILITIES SAN JOSE SEWAGE TREATMENT PLANT (7128 BALBOA ROAD in JACKSONVILLE, FL)
(Integrated Compliance Information System) - ICIS-04-1976-0008, FORMAL ENFORCEMENT ACTION National Pollutant Discharge Elimination System MAJOR (Tracking pollutant discharge elimination systems) - permit Business SIC classification: SEWERAGE SYSTEMS Organizations: PHILIP HEIL (CONTACT/OWNER)
Alternative names: JAX SUBURBAN UTIL-SAN JOSE, UNITED WATER FL - SAN JOSE STP
JIFFY LUBE #240 (2837 TOWNSEND RD in JACKSONVILLE, FL)
(Resource Conservation and Recovery Act (tracking hazardous waste)) Organizations: RANDY SCHHMITZ, GM (CONTACT/OWNER)
, MARTHA PENA (CONTACT/OWNER)
ALFRED I. DUPONT MIDDLE SCHOOL (2710 DUPONT AVE in JACKSONVILLE, FL)
(National Center for Education Statistics) - STATE ID-0661 Organizations: DUVAL COUNTY SCHOOL DISTRICT (SCHOOL DISTRICT)
KINGS TRAIL ELEMENTARY SCHOOL (7401 OLD KINGS RD S in JACKSONVILLE, FL)
(National Center for Education Statistics) - STATE ID-2031 Organizations: DUVAL COUNTY SCHOOL DISTRICT (SCHOOL DISTRICT)
CKF LAUNDRY SERVICE LLC (6005 POWERS AVENUE #110 in JACKSONVILLE, FL)
AIR MINOR (AIRS/AFS) (Resource Conservation and Recovery Act (tracking hazardous waste)) Business SIC classification: DRYCLEANING PLANTS, EXCEPT RUG CLEANING Organizations: JOHN BALDWIN (CONTACT/OWNER)
Alternative names: PELICAN CLEANERS INCORPORATED, PELICAN CLEANERS CEI 2001
P & L AUTOMOTIVE (6299-13 POWERS AVE in JACKSONVILLE, FL)
Small Quantity Generators, between 100 kg and 1000 kg of hazardous waste/month (Resource Conservation and Recovery Act (tracking hazardous waste)) - notification (Resource Conservation and Recovery Act (tracking hazardous waste)) Organizations: LENDER ESTEVEZ OWNER (CONTACT/OWNER)
, LEONARDO ESTEVEZ & PABLO (CONTACT/OWNER)
PROFESSIONAL CLEANERS (SAIF & LARA, INC) (6826 OLD KINGS ROAD SOUTH in JACKSONVILLE, FL)
AIR MINOR (AIRS/AFS) Small Quantity Generators, between 100 kg and 1000 kg of hazardous waste/month (Resource Conservation and Recovery Act (tracking hazardous waste)) Business SIC classification: DRYCLEANING PLANTS, EXCEPT RUG CLEANING Business NAICS classification: LINEN SUPPLY. Organizations: ASHOK R PATEL (CONTACT/OWNER)
Alternative names: PURVI INCORPORATED
A & B AUTOMOTIVE (6281 POWERS AVE in JACKSONVILLE, FL)
AAA AUTOMOTIVE (6034 RICHARD ST in JACKSONVILLE, FL)
(Resource Conservation and Recovery Act (tracking hazardous waste)) Business NAICS classification: GENERAL AUTOMOTIVE REPAIR. Organizations: NON NOTIFIER (CONTACT/OWNER)
CHURCHILL PARK (8777 SAN JOSE BLVD in JACKSONVILLE, FL)
National Pollutant Discharge Elimination System NON-MAJOR (Tracking pollutant discharge elimination systems) - permit Organizations: RANDY CRABTREE (CONTACT/OWNER)
Housing units lacking complete kitchen facilities: 0.4%
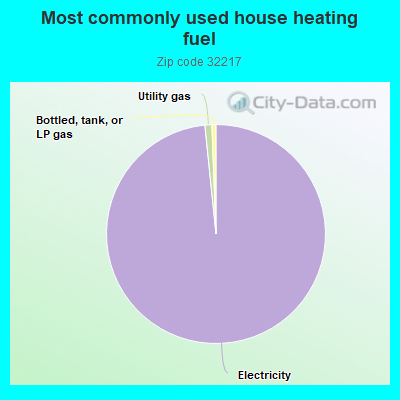
98.0%Electricity
1.0%Utility gas
0.6%Bottled, tank, or LP gas
Population in 1990: 19,356. Population change in the 1990s: +868 (+4.5%).
Place of birth for U.S.-born residents:
This state: 8,562
Northeast: 2,698
Midwest: 1,590
South: 3,335
West: 783
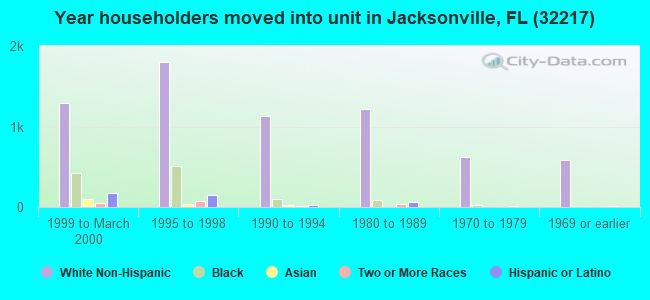
53% of the 32217 zip code residents lived in the same house 5 years ago. Out of people who lived in different houses, 64% lived in this county. Out of people who lived in different counties, 50% lived in Florida.
86% of the 32217 zip code residents lived in the same house 1 year ago. Out of people who lived in different houses, 49% moved from this county. Out of people who lived in different houses, 21% moved from different county within same state. Out of people who lived in different houses, 19% moved from different state. Out of people who lived in different houses, 9% moved from abroad.
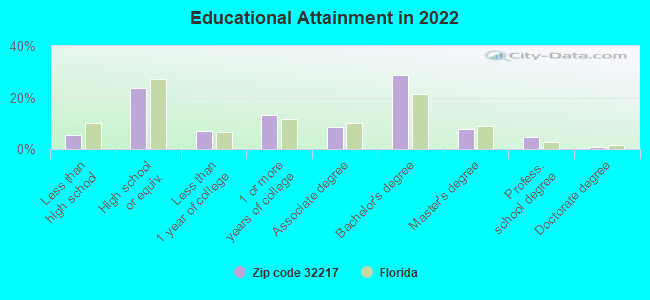
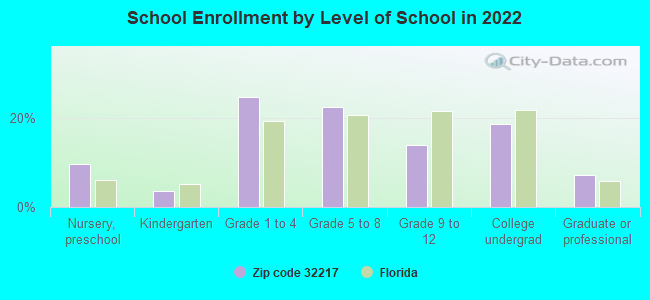
Private vs. public school enrollment:
Students in private schools in grades 1 to 8 (elementary and middle school): 512
Here:
27.1%
Florida:
15.8%
Students in private schools in grades 9 to 12 (high school): 147
Here:
26.2%
Florida:
12.9%
Students in private undergraduate colleges: 158
Here:
21.2%
Florida:
23.6%
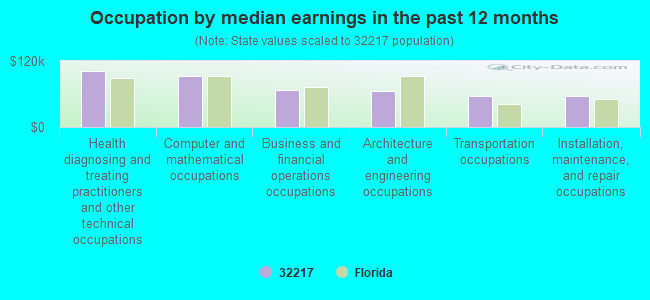
Occupation by median earnings in the past 12 months ($)
102,491Health diagnosing and treating practitioners and other technical occupations
93,302Computer and mathematical occupations
68,064Business and financial operations occupations
65,613Architecture and engineering occupations
56,346Transportation occupations
55,786Installation, maintenance, and repair occupations
Companies with federal contracts located in this zip code (JACKSONVILLE, FL):
PRICE CONTRACTING, INC (6299-5 POWERS AVE; small business) : $3,756,837 in 3 contractsfrom 2001 to 2003
$3,684,014 with Navy for Maintenance, Repair or Alteration of Real Property -- Other Conservation and Development Facilities. Signed on 2001-04-02. Completion date: 2003-10-09.
$52,333, same as above.Signed on 2003-06-27. Completion date: 2003-10-09.
$20,490, same as above.Signed on 2003-03-31. Completion date: 2003-10-09.
BENSON, HARRY CURTIS MD (3643 CATHEDRAL OAKS PL N; small business) : $458,240 in 3 contractsfrom 2004 to 2005
$214,240 with Navy for Internal Medicine Services. Signed on 2005-10-01. Completion date: 2006-09-30.
$208,800, same as above.Signed on 2004-12-23. Completion date: 2005-09-30.
$35,200, same as above.Signed on 2004-05-26. Completion date: 2004-09-30.
ADVANCED UNDERGROUND IMAGING, (5991 CHESTER AVE SUITE 104; small business) : $225,525 in 3 contractsin 2003
$207,025 with Navy for Other Utilities. Signed on 2003-06-03. Completion date: 2004-06-11.
$18,500, same as above.Signed on 2003-09-25. Completion date: 2003-12-29.
$0, same as above.Signed on 2003-05-30. Completion date: 2003-06-11.
THE SY-KLONE COMPANY (6593 POWERS AVENUE SUITE) : $207,872 in 2 contractsin 2004
$207,872 with Navy for Air Purification Equipment. Signed on 2004-02-17. Completion date: 2004-03-11.
$0, same as above.Signed on 2004-02-17. Completion date: 2004-03-11.
S & S METAL & PLASTICS INC (3740 MORTON ST; small business)
$36,000 with Navy for Miscellaneous Electrical and Electronic Components. Signed on 2003-08-14. Completion date: 2003-10-15.
STONE MOUNTAIN TECHNOLOGIES, I (6120-10 POWERS AVE #149; small business)
$27,577 with Defense Logistics Agency for Connectors, Electrical. Taking place in SC. Signed on 2004-04-22. Completion date: 2004-05-22.
GREAT SOUTHERNSALES INC (6593-3 POWERS AVE; small business) : $18,405 in 2 contractsin 2005
$10,545 with Navy for Cutlery and Flatware. Taking place in CA. Signed on 2005-07-13. Completion date: 2005-08-03.
$7,860 with Navy for Food Cooking, Baking, and Serving Equipment. Signed on 2005-05-03. Completion date: 2005-05-06.
THE SHERWIN-WILLIAMS CO (6487 POWERS AVE)
$5,181 with Army for Paints, Dopes, Varnishes, and Related Products. Signed on 2004-03-31. Completion date: 2004-04-06.
Top industries in this zip code by the number of employees in 2005:
2007 - 2018 National Fire Incident Reporting System (NFIRS) incidents
Based on the data from the years 2007 - 2018 the average number of fires per year is 55. The highest number of fires - 114 took place in 2007, and the least - 20 in 2016. The data has a dropping trend.
When looking into fire subcategories, the most incidents belonged to: Outside Fires (45.4%), and Structure Fires (30.4%).
Fire incident types reported to NFIRS in Zip Code 32217


 Nearest zip codes: 32212, 32257, 32207, 32216, 32223, 32202.
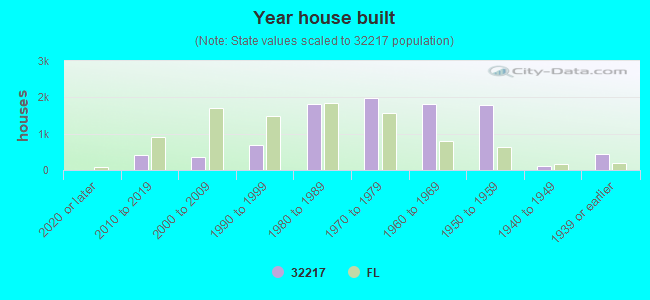


 Based on the data from the years 2007 - 2018 the average number of fires per year is 55. The highest number of fires - 114 took place in 2007, and the least - 20 in 2016. The data has a dropping trend.
 When looking into fire subcategories, the most incidents belonged to: Outside Fires (45.4%), and Structure Fires (30.4%).