Estimated zip code population in 2022: 6,933 Zip code population in 2010: 7,037 Zip code population in 2000: 7,235
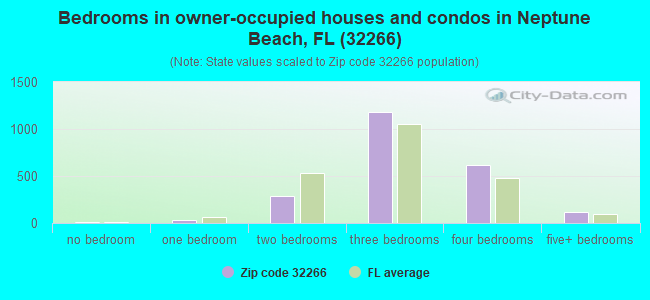
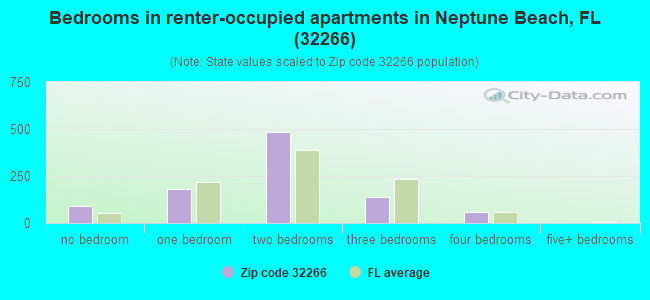
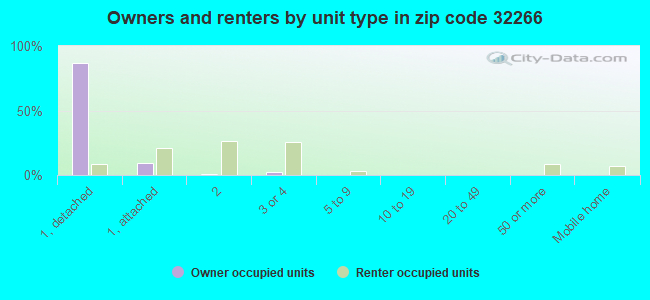
Houses and condos: 3,592 Renter-occupied apartments: 948
% of renters here:
30%
State:
33%
March 2022 cost of living index in zip code 32266: 90.8 (less than average, U.S. average is 100)
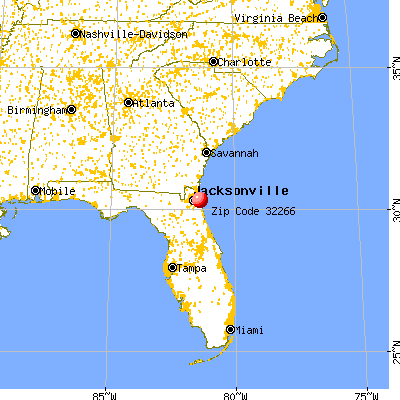
Land area: 2.3 sq. mi. Water area: 0.6 sq. mi.
Population density: 2,973 people per square mile
(average).
OSM Map
General Map
Google Map
MSN Map
OSM Map
General Map
Google Map
MSN Map
OSM Map
General Map
Google Map
MSN Map
OSM Map
General Map
Google Map
MSN Map
Please wait while loading the map...
Real estate property taxes paid for housing units in 2022:
This zip code:
0.6% ($3,903)
Florida:
0.7% ($2,529)
Median real estate property taxes paid for housing units with mortgages in 2022: $4,241 (0.6%) Median real estate property taxes paid for housing units with no mortgage in 2022: $3,527 (0.5%)
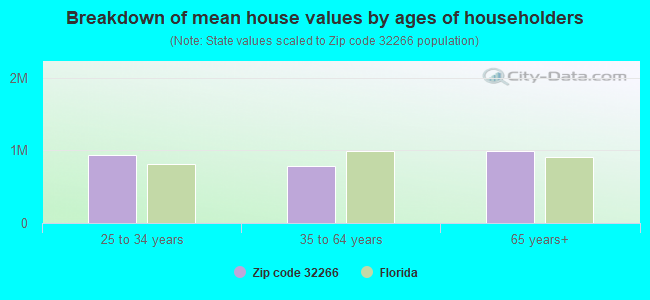
Estimated median house/condo value in 2022: $677,783
32266:
$677,783
Florida:
$354,100
According to our research of Florida and other state lists, there was 1 registered sex offender living in 32266 zip code as of April 27, 2024. The ratio of all residents to sex offenders in zip code 32266 is 6,914 to 1. The ratio of registered sex offenders to all residents in this zip code is much lower than the state average.
Median resident age:
This zip code:
44.7 years
Florida median age:
42.7 years
Average household size:
This zip code:
2.2 people
Florida:
2.5 people
Averages for the 2020 tax year for zip code 32266, filed in 2021:
Average Adjusted Gross Income (AGI) in 2020: $140,304 (Individual Income Tax Returns)
Here:
$140,304
State:
$82,200
Salary/wage: $93,679 (reported on 80.4% of returns)
Here:
$93,679
State:
$58,347
(% of AGI for various income ranges: 1192.8% for AGIs below $25k, 3784.5% for AGIs $25k-50k, 6595.4% for AGIs $50k-75k, 9803.5% for AGIs $75k-100k, 18923.8% for AGIs $100k-200k, 87411.2% for AGIs over 200k)
Taxable interest for individuals: $2,161 (reported on 43.4% of returns)
This zip code:
$2,161
Florida:
$4,272
(% of AGI for various income ranges: 29.0% for AGIs below $25k, 43.4% for AGIs $25k-50k, 77.7% for AGIs $50k-75k, 130.4% for AGIs $75k-100k, 198.8% for AGIs $100k-200k, 1138.1% for AGIs over 200k)
Ordinary dividends: $8,969 (reported on 32.8% of returns)
Here:
$8,969
State:
$15,863
(% of AGI for various income ranges: 66.2% for AGIs below $25k, 110.0% for AGIs $25k-50k, 168.0% for AGIs $50k-75k, 302.7% for AGIs $75k-100k, 586.8% for AGIs $100k-200k, 4180.6% for AGIs over 200k)
Net capital gain/loss in AGI: +$34,326 (reported on 30.2% of returns)
Here:
+$34,326
State:
+$62,983
(% of AGI for various income ranges: 56.3% for AGIs below $25k, 49.2% for AGIs $25k-50k, 150.9% for AGIs $50k-75k, 165.0% for AGIs $75k-100k, 1066.0% for AGIs $100k-200k, 21463.8% for AGIs over 200k)
Profit/loss from business: +$18,975 (reported on 17.6% of returns)
Here:
+$18,975
State:
+$9,719
(% of AGI for various income ranges: 135.5% for AGIs below $25k, 224.0% for AGIs $25k-50k, 407.4% for AGIs $50k-75k, 266.9% for AGIs $75k-100k, 1027.2% for AGIs $100k-200k, 2921.2% for AGIs over 200k)
Taxable individual retirement arrangement distribution: $23,441 (reported on 11.9% of returns)
32266:
$23,441
Florida:
$24,823
(% of AGI for various income ranges: 71.2% for AGIs below $25k, 168.1% for AGIs $25k-50k, 302.3% for AGIs $50k-75k, 567.7% for AGIs $75k-100k, 932.8% for AGIs $100k-200k, 2000.0% for AGIs over 200k)
Self-employed (Keogh) retirement plans: $19,067 (reported on 0.8% of returns)
32266:
$19,067
Florida:
$29,694
(% of AGI for various income ranges: 143.0% for AGIs $100k-200k)
Total itemized deductions: $43,138 (reported on 12.4% of returns)
Here:
$43,138
State:
$45,393
(% of AGI for various income ranges: 247.7% for AGIs $25k-50k, 307.4% for AGIs $50k-75k, 521.9% for AGIs $75k-100k, 1112.2% for AGIs $100k-200k, 7819.4% for AGIs over 200k)
Charity contributions: $21,651 (reported on 10.1% of returns)
Here:
$21,651
State:
$20,178
(% of AGI for various income ranges: 14.5% for AGIs $25k-50k, 36.9% for AGIs $50k-75k, 76.5% for AGIs $75k-100k, 236.2% for AGIs $100k-200k, 4433.8% for AGIs over 200k)
Taxes paid: $7,526 (reported on 12.1% of returns)
32266:
$7,526
State:
$6,967
(% of AGI for various income ranges: 51.5% for AGIs $25k-50k, 62.9% for AGIs $50k-75k, 116.5% for AGIs $75k-100k, 224.3% for AGIs $100k-200k, 1152.5% for AGIs over 200k)
Earned income credit: $1,437 (reported on 7.0% of returns)
Here:
$1,437
State:
$2,306
(% of AGI for various income ranges: 47.2% for AGIs below $25k, 19.8% for AGIs $25k-50k)
Percentage of individuals using paid preparers for their 2020 taxes: 91.5%
Here:
91%
State:
92%
(% for various income ranges: 89.8% for AGIs below $25k, 91.8% for AGIs $25k-50k, 92.6% for AGIs $50k-75k, 90.7% for AGIs $75k-100k, 91.4% for AGIs $100k-200k, 93.8% for AGIs over 200k)
Averages for the 2012 tax year for zip code 32266, filed in 2013:
Average Adjusted Gross Income (AGI) in 2012: $77,701 (Individual Income Tax Returns)
Here:
$77,701
State:
$60,316
Salary/wage: $60,226 (reported on 83.4% of returns)
Here:
$60,226
State:
$45,277
(% of AGI for various income ranges: 74.1% for AGIs below $25k, 81.8% for AGIs $25k-50k, 74.1% for AGIs $50k-75k, 67.8% for AGIs $75k-100k, 73.3% for AGIs $100k-200k, 48.6% for AGIs over 200k)
Taxable interest for individuals: $1,740 (reported on 40.7% of returns)
This zip code:
$1,740
Florida:
$3,587
(% of AGI for various income ranges: 1.5% for AGIs below $25k, 0.6% for AGIs $25k-50k, 0.8% for AGIs $50k-75k, 0.8% for AGIs $75k-100k, 0.6% for AGIs $100k-200k, 1.2% for AGIs over 200k)
Ordinary dividends: $5,094 (reported on 26.4% of returns)
Here:
$5,094
State:
$12,831
(% of AGI for various income ranges: 3.0% for AGIs below $25k, 1.6% for AGIs $25k-50k, 1.5% for AGIs $50k-75k, 2.4% for AGIs $75k-100k, 1.6% for AGIs $100k-200k, 1.6% for AGIs over 200k)
Net capital gain/loss in AGI: +$18,705 (reported on 19.2% of returns)
Here:
+$18,705
State:
+$33,493
(% of AGI for various income ranges: 0.2% for AGIs $50k-75k, 0.5% for AGIs $75k-100k, 1.2% for AGIs $100k-200k, 11.5% for AGIs over 200k)
Profit/loss from business: +$11,280 (reported on 15.3% of returns)
Here:
+$11,280
State:
+$10,012
(% of AGI for various income ranges: 8.3% for AGIs below $25k, 2.3% for AGIs $25k-50k, 2.0% for AGIs $50k-75k, 2.2% for AGIs $75k-100k, 2.0% for AGIs $100k-200k, 1.6% for AGIs over 200k)
Taxable individual retirement arrangement distribution: $17,633 (reported on 11.7% of returns)
32266:
$17,633
Florida:
$21,544
(% of AGI for various income ranges: 2.5% for AGIs below $25k, 2.4% for AGIs $25k-50k, 3.2% for AGIs $50k-75k, 4.0% for AGIs $75k-100k, 3.9% for AGIs $100k-200k, 1.3% for AGIs over 200k)
Total itemized deductions: $26,002 (18% of AGI, reported on 31.6% of returns)
Here:
$26,002
State:
$25,533
Here:
17.8% of AGI
State:
18.0% of AGI
(% of AGI for various income ranges: 11.0% for AGIs below $25k, 8.0% for AGIs $25k-50k, 11.5% for AGIs $50k-75k, 12.2% for AGIs $75k-100k, 12.1% for AGIs $100k-200k, 9.5% for AGIs over 200k)
Charity contributions: $4,263 (reported on 26.7% of returns)
Here:
$4,263
State:
$5,698
(% of AGI for various income ranges: 0.8% for AGIs below $25k, 0.9% for AGIs $25k-50k, 1.4% for AGIs $50k-75k, 1.5% for AGIs $75k-100k, 1.6% for AGIs $100k-200k, 1.6% for AGIs over 200k)
Taxes paid: $5,909 (reported on 31.1% of returns)
32266:
$5,909
State:
$6,203
(% of AGI for various income ranges: 1.8% for AGIs below $25k, 1.8% for AGIs $25k-50k, 2.3% for AGIs $50k-75k, 2.7% for AGIs $75k-100k, 2.8% for AGIs $100k-200k, 2.2% for AGIs over 200k)
Earned income credit: $1,513 (reported on 9.8% of returns)
Here:
$1,513
State:
$2,372
(% of AGI for various income ranges: 3.0% for AGIs below $25k, 0.4% for AGIs $25k-50k)
Percentage of individuals using paid preparers for their 2012 taxes: 47.4%
Here:
47%
State:
54%
(% for various income ranges: 41.6% for AGIs below $25k, 40.4% for AGIs $25k-50k, 47.5% for AGIs $50k-75k, 52.6% for AGIs $75k-100k, 58.5% for AGIs $100k-200k, 72.7% for AGIs over 200k)
Averages for the 2004 tax year for zip code 32266, filed in 2005:
Average Adjusted Gross Income (AGI) in 2004: $54,930 (Individual Income Tax Returns)
Here:
$54,930
State:
$50,523
Salary/wage: $45,627 (reported on 85.0% of returns)
Here:
$45,627
State:
$39,563
(% of AGI for various income ranges: 171.2% for AGIs below $10k, 76.9% for AGIs $10k-25k, 80.3% for AGIs $25k-50k, 76.8% for AGIs $50k-75k, 76.9% for AGIs $75k-100k, 61.0% for AGIs over 100k)
Taxable interest for individuals: $1,622 (reported on 50.1% of returns)
This zip code:
$1,622
Florida:
$3,211
(% of AGI for various income ranges: 8.7% for AGIs below $10k, 2.0% for AGIs $10k-25k, 1.4% for AGIs $25k-50k, 1.6% for AGIs $50k-75k, 1.5% for AGIs $75k-100k, 1.3% for AGIs over 100k)
Taxable dividends: $3,047 (reported on 29.4% of returns)
Here:
$3,047
State:
$6,129
(% of AGI for various income ranges: 5.4% for AGIs below $10k, 1.4% for AGIs $10k-25k, 1.6% for AGIs $25k-50k, 1.4% for AGIs $50k-75k, 0.9% for AGIs $75k-100k, 1.9% for AGIs over 100k)
Net capital gain/loss: +$18,928 (reported on 24.5% of returns)
Here:
+$18,928
State:
+$27,205
(% of AGI for various income ranges: -0.1% for AGIs below $10k, 0.7% for AGIs $10k-25k, 0.5% for AGIs $25k-50k, 0.4% for AGIs $50k-75k, 2.3% for AGIs $75k-100k, 16.5% for AGIs over 100k)
Profit/loss from business: +$11,616 (reported on 13.6% of returns)
Here:
+$11,616
State:
+$10,634
(% of AGI for various income ranges: 8.2% for AGIs below $10k, 5.4% for AGIs $10k-25k, 1.8% for AGIs $25k-50k, 2.0% for AGIs $50k-75k, 2.5% for AGIs $75k-100k, 3.2% for AGIs over 100k)
IRA payment deduction: $3,118 (reported on 3.3% of returns)
32266:
$3,118
Florida:
$3,082
(% of AGI for various income ranges: 0.4% for AGIs $10k-25k, 0.3% for AGIs $25k-50k, 0.3% for AGIs $50k-75k, 0.3% for AGIs $75k-100k, 0.1% for AGIs over 100k)
Self-employed pension: $11,348 (reported on 0.6% of returns)
Here:
$11,348
Florida:
$15,857
Total itemized deductions: $19,521 (20% of AGI, reported on 36.1% of returns)
Here:
$19,521
State:
$20,370
Here:
20.1% of AGI
State:
20.7% of AGI
(% of AGI for various income ranges: 24.5% for AGIs below $10k, 10.6% for AGIs $10k-25k, 13.1% for AGIs $25k-50k, 15.5% for AGIs $50k-75k, 13.4% for AGIs $75k-100k, 11.9% for AGIs over 100k)
Charity contributions deductions: $3,756 (4% of AGI, reported on 31.7% of returns)
Here:
$3,756
State:
$4,064
Here:
3.7% of AGI
State:
3.8% of AGI
(% of AGI for various income ranges: 0.8% for AGIs below $10k, 0.8% for AGIs $10k-25k, 1.4% for AGIs $25k-50k, 1.8% for AGIs $50k-75k, 2.3% for AGIs $75k-100k, 2.7% for AGIs over 100k)
Total tax: $9,085 (reported on 80.7% of returns)
32266:
$9,085
State:
$9,431
(% of AGI for various income ranges: 3.8% for AGIs below $10k, 5.0% for AGIs $10k-25k, 8.0% for AGIs $25k-50k, 10.1% for AGIs $50k-75k, 11.9% for AGIs $75k-100k, 17.8% for AGIs over 100k)
Earned income credit: $1,177 (reported on 9.2% of returns)
Here:
$1,177
State:
$1,808
Percentage of individuals using paid preparers for their 2004 taxes: 51.8%
Here:
52%
State:
60%
(% for various income ranges: 44.6% for AGIs below $10k, 49.5% for AGIs $10k-25k, 49.3% for AGIs $25k-50k, 58.4% for AGIs $50k-75k, 52.3% for AGIs $75k-100k, 62.4% for AGIs over 100k)
Household received Food Stamps/SNAP in the past 12 months: 34 Household did not receive Food Stamps/SNAP in the past 12 months: 3,180
Women who had a birth in the past 12 months: 97 (102 now married, 0 unmarried) Women who did not have a birth in the past 12 months: 1,531 (744 now married, 787 unmarried)
Housing units in zip code 32266 with a mortgage: 1,338 (211 second mortgage, 174 both second mortgage and home equity loan) Houses without a mortgage: 11
Median monthly owner costs for units with a mortgage: $2,263 Median monthly owner costs for units without a mortgage: $787
Residents with income below the poverty level in 2022:
This zip code:
2.2%
Whole state:
12.7%
Residents with income below 50% of the poverty level in 2022:
This zip code:
0.7%
Whole state:
6.6%
Median number of rooms in houses and condos:
Here:
6.6
State:
5.9
Median number of rooms in apartments:
Here:
4.2
State:
4.2
Notable locations in this zip code not listed on our city pages
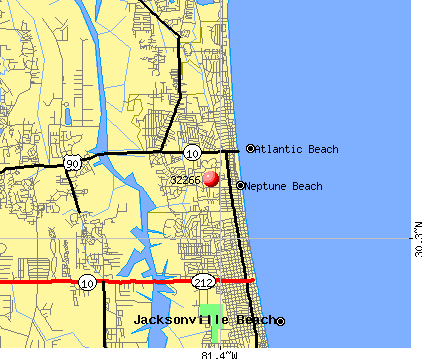
Notable locations in zip code 32266: Pennan Plaza (A), Neptune Beach Plaza (B), Beaches Regional Library (C), Neptune Beach Police Department (D). Display/hide their locations on the map
Churches in zip code 32266 include: The Church of Jesus Christ of Latter Day Saints (A), Eastside Church of Christ (B), Neptune Baptist Church (C), First Missionary Baptist Church (D), Christ Church (E). Display/hide their locations on the map
781 married couples with children.
210 single-parent households (41 men, 169 women).
93.6% of residents of 32266 zip code speak English at home.
4.8% of residents speak Spanish at home (76% very well, 3% well, 21% not well).
0.5% of residents speak other Indo-European language at home (97% very well, 3% well).
0.4% of residents speak other language at home (100% very well).
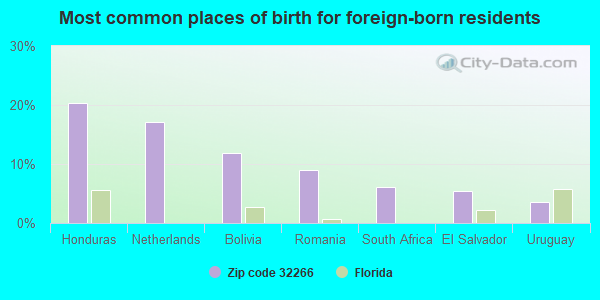
Foreign born population: 315 (4.5%) (52.5% of them are naturalized citizens)
This zip code:
4.5%
Whole state:
21.7%
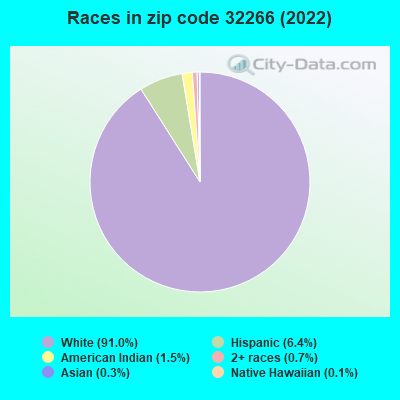
20%Honduras
17%Netherlands
12%Bolivia
9%Romania
6%South Africa
5%El Salvador
4%Uruguay
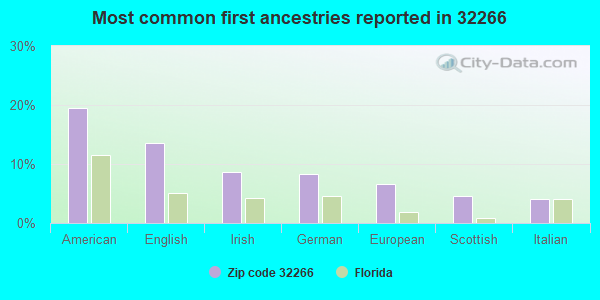
19%American
14%English
9%Irish
8%German
7%European
5%Scottish
4%Italian
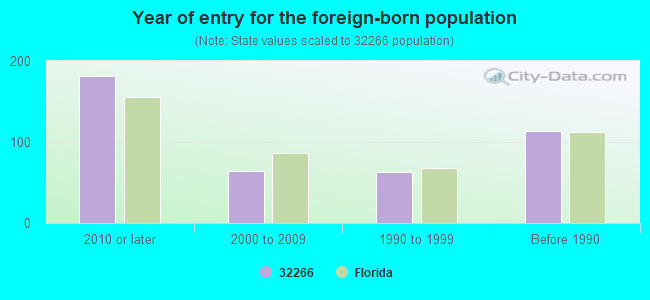
Year of entry for the foreign-born population
1812010 or later
642000 to 2009
631990 to 1999
114Before 1990
Facilities with environmental interests located in this zip code:
NEPTUNE BEACH ELEMENTARY SCHOOL (1515 FLORIDA BLVD in NEPTUNE BEACH, FL)
(Geographic Names Information System) (National Center for Education Statistics) - STATE ID-2461 Organizations: DUVAL COUNTY SCHOOL DISTRICT (SCHOOL DISTRICT)
NEPTUNE BEACH WASTE WATER TREATMENT PLANT (2010 FOREST AVENUE in NEPTUNE BEACH, FL)
(Integrated Compliance Information System) - ICIS-04-1988-0055, FORMAL ENFORCEMENT ACTION National Pollutant Discharge Elimination System MAJOR (Tracking pollutant discharge elimination systems) - permit Business SIC classification: SEWERAGE SYSTEMS Organizations: RICHARD LINN (CONTACT/OWNER)
Alternative names: 2010 FOREST AVE, NEPTUNE BEACH WWTP
GEOMETRIC SUPPLY CO (810 3RD ST in NEPTUNE BEACH, FL)
(Integrated Compliance Information System) - ICIS-04-1998-0293, FORMAL ENFORCEMENT ACTION Business SIC classification: BOAT BUILDING AND REPAIRING
NEPTUNE BEACH WWTP (STRICKLAND RD & FORREST AVE in NEPTUNE BEACH, FL)
(Integrated Compliance Information System) - ICIS-04-1991-0059, FORMAL ENFORCEMENT ACTION
ATLANTIC & SAN PABLO RETAIL CE (ATLANTIC BOULEVARD in JACKSONVILLE, FL)
National Pollutant Discharge Elimination System NON-MAJOR (Tracking pollutant discharge elimination systems) - permit National Pollutant Discharge Elimination System NON-MAJOR (Tracking pollutant discharge elimination systems) - permit Alternative names: ROSEN SAN PABLO LLC
1ST COAST MARINE INC (2100 FLORIDA BLVD in NEPTUNE BEACH, FL)
(Resource Conservation and Recovery Act (tracking hazardous waste)) Business NAICS classification: BOAT DEALERS. Organizations: CLIFFORD SQUIRES, OWNER (CONTACT/OWNER)
8TH STREET OUTFALL (HOPKINS CR (PENMAN RD/NEPTUNE LN in NEPTUNE BCH, FL)
National Pollutant Discharge Elimination System NON-MAJOR (Tracking pollutant discharge elimination systems) - permit Organizations: PATRICK CALLAWAY (CONTACT/OWNER)
ATLANTIC BEACH CHEVRON (720 ATLANTIC BLVD in NEPTUNE BEACH, FL)
(Resource Conservation and Recovery Act (tracking hazardous waste)) Organizations: FLEISHER MARK (CONTACT/OWNER)
OCEAN CLEANERS OF NEPTUNE BEACH INC (1549 ATLANTIC BOULEVARD in NEPTUNE BEACH, FL)
AIR MINOR (AIRS/AFS) Business SIC classification: DRYCLEANING PLANTS, EXCEPT RUG CLEANING
K MART AUTOMOTIVE (500 ATLANTIC BLVD in NEPTUNE BEACH, FL)
Small Quantity Generators, between 100 kg and 1000 kg of hazardous waste/month (Resource Conservation and Recovery Act (tracking hazardous waste)) - notification Organizations: HAGEN POPE, SERVICE MGR (CONTACT/OWNER)
PENSKE AUTO CENTER (500 ATLANTIC BOULEVARD #1 in NEPTUNE BEACH, FL)
Small Quantity Generators, between 100 kg and 1000 kg of hazardous waste/month (Resource Conservation and Recovery Act (tracking hazardous waste)) - notification Organizations: DAVID TATUM, MGR SPEC PROJ (CONTACT/OWNER)
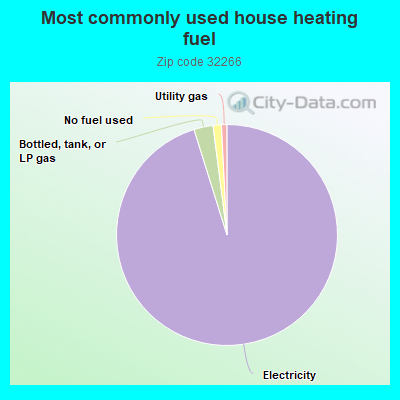
94.8%Electricity
2.8%Bottled, tank, or LP gas
1.2%No fuel used
0.8%Utility gas
Population in 1990: 6,816. Population change in the 1990s: +419 (+6.1%).
Place of birth for U.S.-born residents:
This state: 2,219
Northeast: 1,432
Midwest: 1,032
South: 1,443
West: 370
54% of the 32266 zip code residents lived in the same house 5 years ago. Out of people who lived in different houses, 52% lived in this county. Out of people who lived in different counties, 50% lived in Florida.
96% of the 32266 zip code residents lived in the same house 1 year ago. Out of people who lived in different houses, 64% moved from this county. Out of people who lived in different houses, 36% moved from different state. Out of people who lived in different houses, 5% moved from abroad.
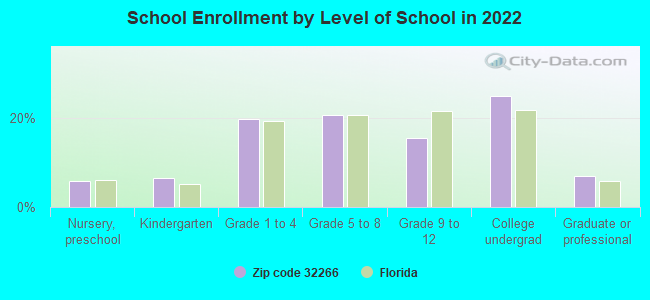
Private vs. public school enrollment:
Students in private schools in grades 1 to 8 (elementary and middle school): 51
Here:
10.2%
Florida:
15.8%
Students in private schools in grades 9 to 12 (high school):
Here:
0.0%
Florida:
12.9%
Students in private undergraduate colleges: 27
Here:
9.0%
Florida:
23.6%
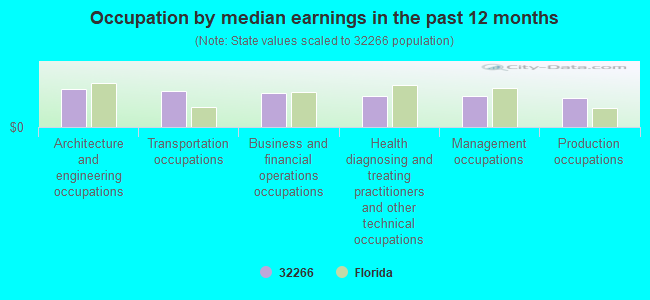
Occupation by median earnings in the past 12 months ($)
112,530Architecture and engineering occupations
105,505Transportation occupations
99,219Business and financial operations occupations
91,652Health diagnosing and treating practitioners and other technical occupations
91,476Management occupations
83,426Production occupations
Companies with federal contracts located in this zip code:
SURFACE TECHNOLOGIES CORPORATI (2275 ATLANTIC BLVD in NEPTUNE BEACH, FL; small business) : $83,890,369 in 1382 contractsfrom 1999 to 2006
Contracts for Maintenance, Repair and Rebuilding of Equipment -- Ships, Small Craft, Pontoons, and Floating Docks, Non-nuclear Ship Repair (West) Ship repair (including overhauls and conversions) performed on. non-nuclear propelled and nonpropelled ships west of the 108th meridian, Miscellaneous Ship and Marine Equipment, Non-nuclear Ship Repair (East) Ship repair (including overhauls and conversions) performed on non-nuclear propelled and nonpropelled ships east of the 108th meridian, and moreby Navy, Federal Supply Service, U.S. Coast Guard, United States Coast Guard (disused code: now 7008), and others Signed by year:2000: $16,005,637; 2001: $10,002,192; 2002: $13,862,109; 2003: $11,638,817; 2004: $8,655,369; 2005: $11,660,125; 2006: $3,896,943.
Biggest contracts:
$4,499,500 with Navy for Maintenance, Repair and Rebuilding of Equipment -- Ships, Small Craft, Pontoons, and Floating Docks. Taking place in VA. Signed on 2000-09-19. Completion date: 2001-09-20.
$4,499,500, same as above.Signed on 1999-12-14. Completion date: 2000-12-13.
$3,398,276 with Navy for Non-nuclear Ship Repair (West) Ship repair (including overhauls and conversions) performed on. non-nuclear propelled and nonpropelled ships west of the 108th meridian. Taking place in CA. Signed on 2002-04-25. Completion date: 2004-05-06.
$2,147,000 with Navy for Maintenance, Repair and Rebuilding of Equipment -- Ships, Small Craft, Pontoons, and Floating Docks. Taking place in VA. Signed on 1999-10-30. Completion date: 1999-11-24.
TRI GLOBAL (1467 ATLANTIC BLVD in JACKSONVILLE, FL; small business)
$36,932 with Defense Logistics Agency for Electrical and Electronic assemblies, Boards, Cards, and Associated Hardware. Signed on 2002-04-27. Completion date: 2003-01-17.
JOHN M MILLER (106 MYRA ST in NEPTUNE BEACH, FL; small business)
$10,338 with Navy for Miscellaneous Items. Taking place in RI. Signed on 2005-08-02. Completion date: 2006-05-26.
GEOMETRIC MARINE SERVICES INC (302 THIRD ST, SUITE 7 in NEPTUNE BEACH, FL; small business)
$7,256 with Navy for Valves, Nonpowered. Signed on 2004-11-18. Completion date: 2004-11-24.
NEMESIS HOTEL MANAGEMENT LLC (1401 ATLANTIC BLVD in NEPTUNE BEACH, FL; small business)
$5,594 with Navy for Lodging - Hotel/Motel. Signed on 2004-07-23. Completion date: 2004-07-26.
Top industries in this zip code by the number of employees in 2005:
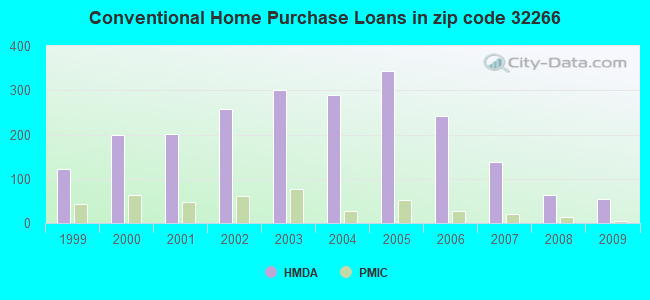
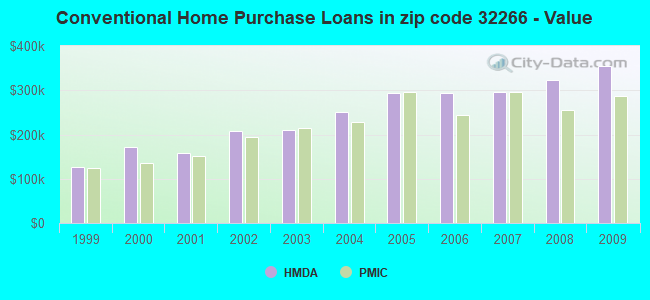
Detailed PMIC statistics for the following Tracts:0140.00
2003 - 2018 National Fire Incident Reporting System (NFIRS) incidents
According to the data from the years 2003 - 2018 the average number of fire incidents per year is 7. The highest number of fire incidents - 15 took place in 2007, and the least - 0 in 2006. The data has a rising trend.
When looking into fire subcategories, the most reports belonged to: Structure Fires (45.3%), and Outside Fires (37.6%).
Fire incident types reported to NFIRS in Zip Code 32266


 Nearest zip codes: 32250, 32233, 32227, 32228, 32224, 32225.


 According to the data from the years 2003 - 2018 the average number of fire incidents per year is 7. The highest number of fire incidents - 15 took place in 2007, and the least - 0 in 2006. The data has a rising trend.
 When looking into fire subcategories, the most reports belonged to: Structure Fires (45.3%), and Outside Fires (37.6%).