Averages for the 2020 tax year for zip code 32227, filed in 2021:
Average Adjusted Gross Income (AGI) in 2020: $54,773 (Individual Income Tax Returns)
Here:
$54,773
State:
$82,200
Salary/wage: $49,896 (reported on 96.6% of returns)
Here:
$49,896
State:
$58,347
(% of AGI for various income ranges: 1361.0% for AGIs below $25k, 3988.0% for AGIs $25k-50k, 6150.0% for AGIs $50k-75k, 9002.0% for AGIs $75k-100k, 16520.0% for AGIs $100k-200k)
Taxable interest for individuals: $300 (reported on 16.9% of returns)
This zip code:
$300
Florida:
$4,272
(% of AGI for various income ranges: 1.5% for AGIs $25k-50k, 9.2% for AGIs $50k-75k, 37.5% for AGIs $100k-200k)
Ordinary dividends: $675 (reported on 6.8% of returns)
Here:
$675
State:
$15,863
(% of AGI for various income ranges: 20.8% for AGIs $50k-75k)
Net capital gain/loss in AGI: +$2,800 (reported on 8.5% of returns)
Here:
+$2,800
State:
+$62,983
(% of AGI for various income ranges: 23.5% for AGIs $25k-50k, 186.0% for AGIs $75k-100k)
Profit/loss from business: +$2,050 (reported on 10.2% of returns)
Here:
+$2,050
State:
+$9,719
(% of AGI for various income ranges: 31.0% for AGIs below $25k, 70.8% for AGIs $50k-75k)
Earned income credit: $2,415 (reported on 33.9% of returns)
Here:
$2,415
State:
$2,306
(% of AGI for various income ranges: 108.0% for AGIs below $25k, 180.5% for AGIs $25k-50k, 10.8% for AGIs $50k-75k)
Percentage of individuals using paid preparers for their 2020 taxes: 100.0%
Here:
100%
State:
92%
(% for various income ranges: 100.0% for AGIs below $25k, 100.0% for AGIs $25k-50k, 100.0% for AGIs $50k-75k, 100.0% for AGIs $75k-100k, 100.0% for AGIs $100k-200k)
Averages for the 2012 tax year for zip code 32227, filed in 2013:
Average Adjusted Gross Income (AGI) in 2012: $38,159 (Individual Income Tax Returns)
Here:
$38,159
State:
$60,316
Salary/wage: $37,281 (reported on 98.3% of returns)
Here:
$37,281
State:
$45,277
(% of AGI for various income ranges: 97.9% for AGIs below $25k, 97.5% for AGIs $25k-50k, 94.6% for AGIs $50k-75k, 93.4% for AGIs $75k-100k)
Taxable interest for individuals: $144 (reported on 15.5% of returns)
This zip code:
$144
Florida:
$3,587
(% of AGI for various income ranges: )
Ordinary dividends: $400 (reported on 5.2% of returns)
Here:
$400
State:
$12,831
Total itemized deductions: $20,367 (25% of AGI, reported on 5.2% of returns)
Here:
$20,367
State:
$25,533
Here:
25.5% of AGI
State:
18.0% of AGI
Charity contributions: $2,800 (reported on 3.4% of returns)
Here:
$2,800
State:
$5,698
Taxes paid: $4,100 (reported on 5.2% of returns)
32227:
$4,100
State:
$6,203
Earned income credit: $2,913 (reported on 51.7% of returns)
Here:
$2,913
State:
$2,372
(% of AGI for various income ranges: 14.9% for AGIs below $25k, 4.3% for AGIs $25k-50k)
Percentage of individuals using paid preparers for their 2012 taxes: 34.5%
Here:
34%
State:
54%
(% for various income ranges: 38.1% for AGIs below $25k, 36.0% for AGIs $25k-50k, 42.9% for AGIs $50k-75k)
Averages for the 2004 tax year for zip code 32227, filed in 2005:
Average Adjusted Gross Income (AGI) in 2004: $29,229 (Individual Income Tax Returns)
Here:
$29,229
State:
$50,523
Salary/wage: $29,283 (reported on 99.7% of returns)
Here:
$29,283
State:
$39,563
(% of AGI for various income ranges: 101.8% for AGIs below $10k, 102.1% for AGIs $10k-25k, 99.3% for AGIs $25k-50k, 99.7% for AGIs $50k-75k, 97.4% for AGIs $75k-100k)
Taxable interest for individuals: $214 (reported on 16.6% of returns)
This zip code:
$214
Florida:
$3,211
(% of AGI for various income ranges: 0.0% for AGIs $10k-25k, 0.1% for AGIs $25k-50k, 0.3% for AGIs $50k-75k, 0.0% for AGIs $75k-100k)
Taxable dividends: $302 (reported on 6.1% of returns)
Here:
$302
State:
$6,129
Net capital gain/loss: +$105 (reported on 2.7% of returns)
Here:
+$105
State:
+$27,205
Profit/loss from business: +$806 (reported on 4.4% of returns)
Here:
+$806
State:
+$10,634
Total itemized deductions: $11,389 (28% of AGI, reported on 2.5% of returns)
Here:
$11,389
State:
$20,370
Here:
27.7% of AGI
State:
20.7% of AGI
Charity contributions deductions: $1,846 (4% of AGI, reported on 1.8% of returns)
Here:
$1,846
State:
$4,064
Here:
4.4% of AGI
State:
3.8% of AGI
Total tax: $2,414 (reported on 35.6% of returns)
32227:
$2,414
State:
$9,431
(% of AGI for various income ranges: 0.7% for AGIs below $10k, 0.9% for AGIs $10k-25k, 1.2% for AGIs $25k-50k, 5.6% for AGIs $50k-75k, 11.0% for AGIs $75k-100k)
Earned income credit: $2,318 (reported on 53.0% of returns)
Here:
$2,318
State:
$1,808
Percentage of individuals using paid preparers for their 2004 taxes: 67.0%
Here:
67%
State:
60%
(% for various income ranges: 63.9% for AGIs below $10k, 71.0% for AGIs $10k-25k, 66.8% for AGIs $25k-50k, 60.9% for AGIs $50k-75k, 47.8% for AGIs $75k-100k)
Household received Food Stamps/SNAP in the past 12 months: 28 Household did not receive Food Stamps/SNAP in the past 12 months: 566
Women who had a birth in the past 12 months: 105 (110 now married, 0 unmarried) Women who did not have a birth in the past 12 months: 633 (372 now married, 262 unmarried)
Residents with income below the poverty level in 2022:
This zip code:
6.0%
Whole state:
12.7%
Residents with income below 50% of the poverty level in 2022:
This zip code:
0.7%
Whole state:
6.6%
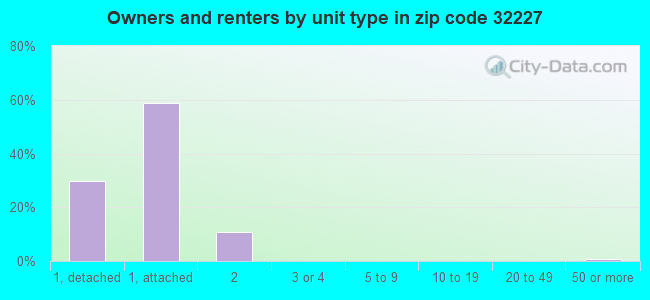
Median number of rooms in apartments:
Here:
6.0
State:
4.2
Notable locations in this zip code not listed on our city pages
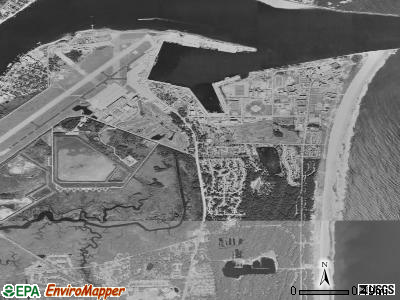
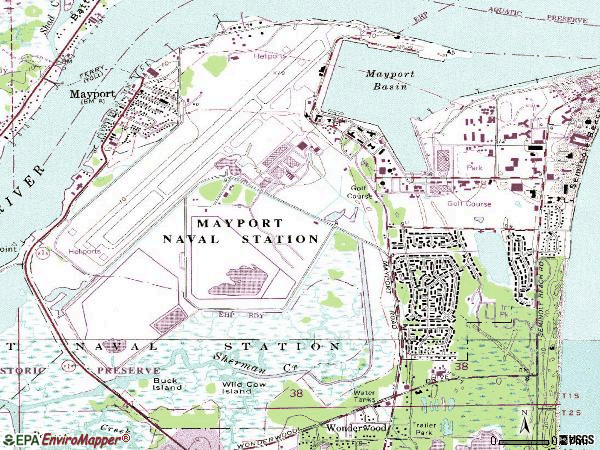
Notable locations in zip code 32227: Mayport Basin Range Front Light (A), Saint Johns Light (B), Navy Fuel Pier Light (C), Naval Station Mayport Firefighting School (D), Naval Station Mayport Fire Prevention and Training (E). Display/hide their locations on the map
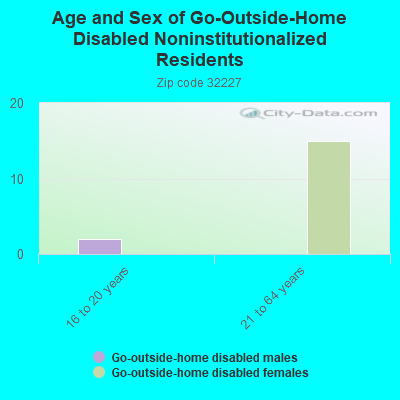
In group quarters: 1,444 (-1 institutionalized population)
Size of family households: 152 2-persons, 125 3-persons, 168 4-persons, 90 5-persons, 37 6-persons, 4 7-or-more-persons
Size of nonfamily households: 5 1-person, 5 2-persons
799 married couples with children.
125 single-parent households (125 women).
87.2% of residents of 32227 zip code speak English at home.
8.9% of residents speak Spanish at home (100% very well).
0.1% of residents speak other Indo-European language at home (100% very well).
2.3% of residents speak Asian or Pacific Island language at home (82% very well, 18% well).
0.1% of residents speak other language at home (100% very well).
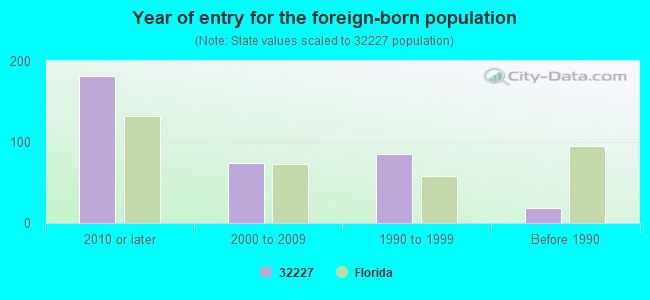
Foreign born population: 97 (2.7%) (89.0% of them are naturalized citizens)
Facilities with environmental interests located in this zip code:
OIL SPILL (ATLANTIC MARINE, INC.) (NAVAL STATION, MAYPORT C PIER in MAYPORT, FL)
(Integrated Compliance Information System) - ICIS-04-2004-5061, FORMAL ENFORCEMENT ACTION
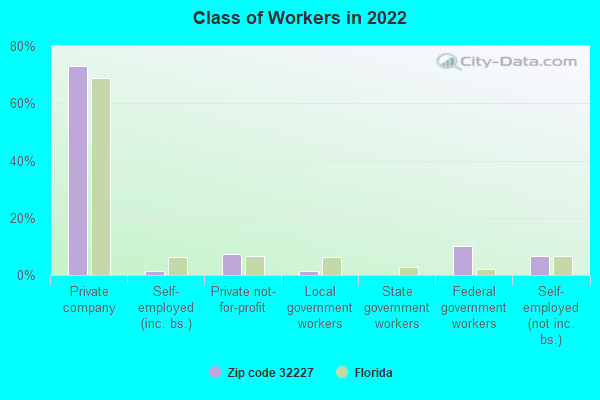
AMSEC LLC (MAYPORT NAVAL BASE in JACKSONVILLE, FL)
(Resource Conservation and Recovery Act (tracking hazardous waste)) Organizations: US NAVY (CONTACT/OWNER)
LOCKHEED MARTIN SERVICES GROUP (NAVAL STATION MAYPORT in JACKSONVILLE, FL)
Small Quantity Generators, between 100 kg and 1000 kg of hazardous waste/month (Resource Conservation and Recovery Act (tracking hazardous waste)) Organizations: US GOVERNMENT (CONTACT/OWNER)
ATLANTIC MARINE, INC. (BAILEY AVE. in MAYPORT, FL)
CRITERIA AND HAZARDOUS AIR POLLUTANT INVENTORY (Inventory of air pollution sources) Business SIC classification: REPAIR SHOPS AND RELATED SERVICES
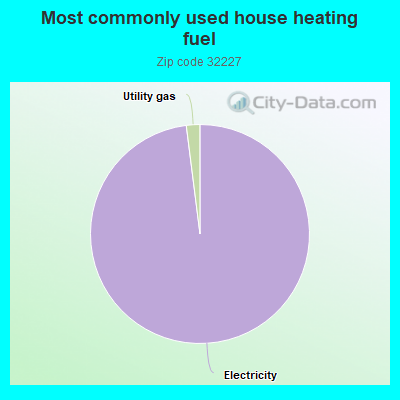
98.2%Electricity
2.0%Utility gas
Population in 1990: 9,055.
Place of birth for U.S.-born residents:
This state: 602
Northeast: 377
Midwest: 679
South: 1,137
West: 461
16% of the 32227 zip code residents lived in the same house 5 years ago. Out of people who lived in different houses, 14% lived in this county. Out of people who lived in different counties, 50% lived in Florida.
64% of the 32227 zip code residents lived in the same house 1 year ago. Out of people who lived in different houses, 47% moved from this county. Out of people who lived in different houses, 1% moved from different county within same state. Out of people who lived in different houses, 38% moved from different state. Out of people who lived in different houses, 10% moved from abroad.
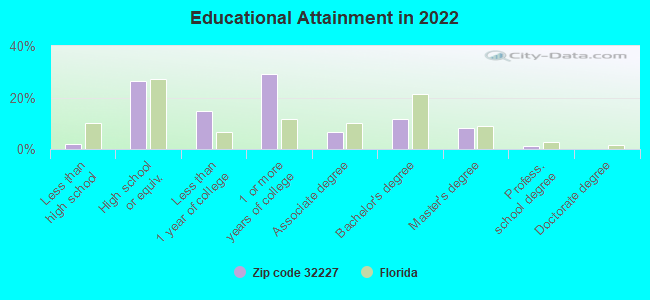
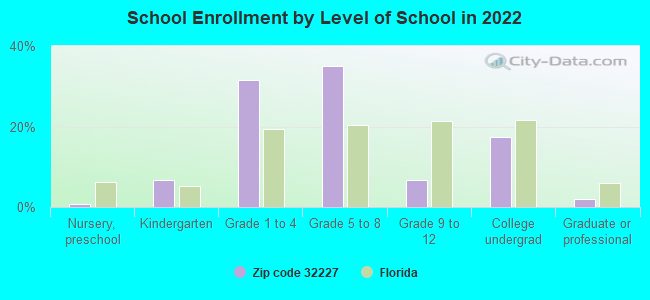
Private vs. public school enrollment:
Students in private schools in grades 1 to 8 (elementary and middle school): 21
Here:
3.7%
Florida:
15.8%
Students in private schools in grades 9 to 12 (high school):
Here:
0.0%
Florida:
12.9%
Students in private undergraduate colleges: 31
Here:
21.0%
Florida:
23.6%
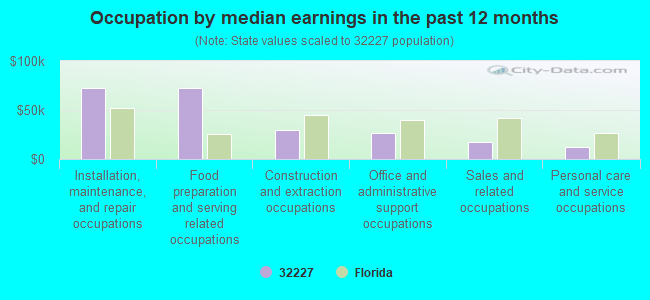
Occupation by median earnings in the past 12 months ($)
72,439Installation, maintenance, and repair occupations
71,941Food preparation and serving related occupations
29,459Construction and extraction occupations
26,474Office and administrative support occupations
17,401Sales and related occupations
12,654Personal care and service occupations
Companies with federal contracts located in this zip code:
DIANNA ANDREWS (602 B OZBOURN AVE in MAYPORT, FL; small business) : $7,250 in 4 contractsfrom 2004 to 2005
$10,450 with Navy for Chaplain Services. Signed on 2004-10-21. Completion date: 2005-09-30.
$0 with Navy for Education Services. Signed on 2004-09-24. Completion date: 2004-09-30.
-$350, same as above.Signed on 2004-09-24. Completion date: 2004-09-30.
-$2,850 with Navy for Chaplain Services. Signed on 2005-05-25. Completion date: 2005-09-30.
Top industries in this zip code by the number of employees in 2005:
Other Services (except Public Administration): General Automotive Repair (5-9 employees: 1 establishment)
Health Care and Social Assistance: Medical Laboratories (1-4: 1)
People in group quarters in 2010:
514 people in military barracks and dormitories (nondisciplinary)
People in group quarters in 2000:
2,634 people in military ships
331 people in military barracks, etc.
Home Mortgage Disclosure Act Aggregated Statistics For Year 2009 (Based on 2 partial tracts)
A) FHA, FSA/RHS & VA Home Purchase Loans
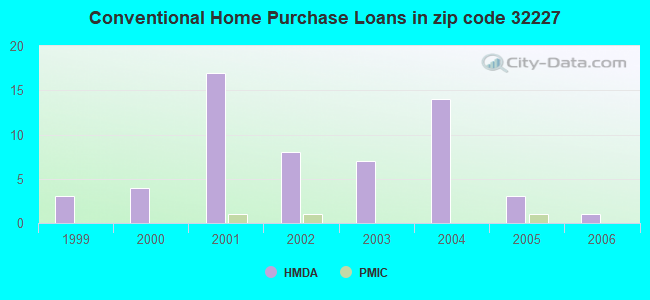
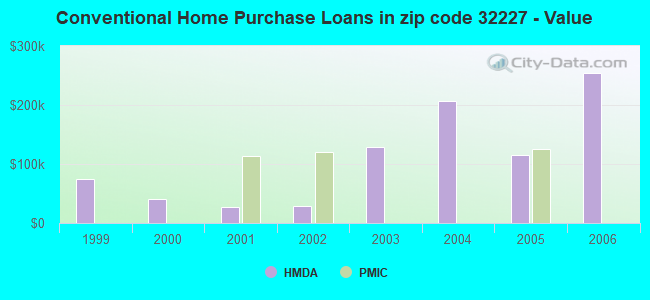
B) Conventional Home Purchase Loans
C) Refinancings
G) Loans On Manufactured Home Dwelling (A B C & D)
Number
Average Value
Number
Average Value
Number
Average Value
Number
Average Value
LOANS ORIGINATED
1
$332,590
0
$0
3
$83,610
0
$0
APPLICATIONS APPROVED, NOT ACCEPTED
1
$234,200
0
$0
1
$525,220
0
$0
APPLICATIONS DENIED
0
$0
1
$34,650
1
$608,370
1
$34,650
APPLICATIONS WITHDRAWN
0
$0
0
$0
0
$0
0
$0
FILES CLOSED FOR INCOMPLETENESS
0
$0
0
$0
0
$0
0
$0
Aggregated Statistics For Year 2008 (Based on 2 partial tracts)
A) FHA, FSA/RHS & VA Home Purchase Loans
B) Conventional Home Purchase Loans
C) Refinancings
D) Home Improvement Loans
Number
Average Value
Number
Average Value
Number
Average Value
Number
Average Value
LOANS ORIGINATED
1
$230,040
0
$0
0
$0
3
$25,867
APPLICATIONS APPROVED, NOT ACCEPTED
0
$0
0
$0
0
$0
0
$0
APPLICATIONS DENIED
0
$0
0
$0
1
$40,190
1
$27,720
APPLICATIONS WITHDRAWN
1
$230,040
3
$146,893
4
$120,910
0
$0
FILES CLOSED FOR INCOMPLETENESS
0
$0
0
$0
0
$0
0
$0
Aggregated Statistics For Year 2007 (Based on 2 partial tracts)
A) FHA, FSA/RHS & VA Home Purchase Loans
B) Conventional Home Purchase Loans
C) Refinancings
D) Home Improvement Loans
G) Loans On Manufactured Home Dwelling (A B C & D)
Number
Average Value
Number
Average Value
Number
Average Value
Number
Average Value
Number
Average Value
LOANS ORIGINATED
0
$0
0
$0
4
$124,030
1
$133,040
0
$0
APPLICATIONS APPROVED, NOT ACCEPTED
0
$0
0
$0
1
$110,860
0
$0
0
$0
APPLICATIONS DENIED
1
$300,720
3
$165,833
6
$252,908
4
$160,060
1
$90,080
APPLICATIONS WITHDRAWN
0
$0
1
$415,740
1
$207,870
3
$58,203
0
$0
FILES CLOSED FOR INCOMPLETENESS
0
$0
1
$249,440
0
$0
0
$0
0
$0
Aggregated Statistics For Year 2006 (Based on 2 partial tracts)
B) Conventional Home Purchase Loans
C) Refinancings
D) Home Improvement Loans
F) Non-occupant Loans on < 5 Family Dwellings (A B C & D)
G) Loans On Manufactured Home Dwelling (A B C & D)
Number
Average Value
Number
Average Value
Number
Average Value
Number
Average Value
Number
Average Value
LOANS ORIGINATED
1
$254,990
6
$152,438
3
$79,453
1
$72,060
0
$0
APPLICATIONS APPROVED, NOT ACCEPTED
1
$55,430
1
$277,160
0
$0
0
$0
1
$55,430
APPLICATIONS DENIED
11
$66,393
10
$227,271
6
$21,712
10
$156,734
3
$43,423
APPLICATIONS WITHDRAWN
3
$98,853
3
$41,573
0
$0
1
$51,270
0
$0
FILES CLOSED FOR INCOMPLETENESS
1
$131,650
1
$91,460
0
$0
0
$0
0
$0
Aggregated Statistics For Year 2005 (Based on 2 partial tracts)
A) FHA, FSA/RHS & VA Home Purchase Loans
B) Conventional Home Purchase Loans
C) Refinancings
D) Home Improvement Loans
F) Non-occupant Loans on < 5 Family Dwellings (A B C & D)
G) Loans On Manufactured Home Dwelling (A B C & D)
Number
Average Value
Number
Average Value
Number
Average Value
Number
Average Value
Number
Average Value
Number
Average Value
LOANS ORIGINATED
0
$0
3
$115,483
4
$64,092
1
$4,160
3
$42,960
0
$0
APPLICATIONS APPROVED, NOT ACCEPTED
0
$0
7
$90,077
1
$151,050
0
$0
1
$216,180
3
$22,173
APPLICATIONS DENIED
0
$0
7
$60,777
6
$64,670
0
$0
1
$9,700
3
$51,737
APPLICATIONS WITHDRAWN
1
$148,280
3
$176,920
4
$195,745
4
$163,525
1
$101,160
1
$148,280
FILES CLOSED FOR INCOMPLETENESS
0
$0
4
$117,448
0
$0
0
$0
0
$0
0
$0
Aggregated Statistics For Year 2004 (Based on 2 partial tracts)
A) FHA, FSA/RHS & VA Home Purchase Loans
B) Conventional Home Purchase Loans
C) Refinancings
D) Home Improvement Loans
F) Non-occupant Loans on < 5 Family Dwellings (A B C & D)
G) Loans On Manufactured Home Dwelling (A B C & D)
Number
Average Value
Number
Average Value
Number
Average Value
Number
Average Value
Number
Average Value
Number
Average Value
LOANS ORIGINATED
0
$0
14
$207,375
8
$115,021
1
$4,160
3
$45,270
3
$64,210
APPLICATIONS APPROVED, NOT ACCEPTED
0
$0
1
$62,360
1
$138,580
0
$0
1
$138,580
1
$62,360
APPLICATIONS DENIED
4
$160,060
8
$85,400
7
$74,636
3
$26,330
3
$104,397
4
$22,172
APPLICATIONS WITHDRAWN
1
$196,780
14
$175,898
3
$90,540
0
$0
3
$67,443
0
$0
FILES CLOSED FOR INCOMPLETENESS
0
$0
3
$34,183
0
$0
1
$27,720
0
$0
0
$0
Aggregated Statistics For Year 2003 (Based on 2 partial tracts)
A) FHA, FSA/RHS & VA Home Purchase Loans
B) Conventional Home Purchase Loans
C) Refinancings
D) Home Improvement Loans
F) Non-occupant Loans on < 5 Family Dwellings (A B C & D)
Number
Average Value
Number
Average Value
Number
Average Value
Number
Average Value
Number
Average Value
LOANS ORIGINATED
0
$0
7
$128,483
15
$66,057
3
$13,857
3
$39,263
APPLICATIONS APPROVED, NOT ACCEPTED
0
$0
3
$41,113
1
$145,510
0
$0
0
$0
APPLICATIONS DENIED
1
$185,700
8
$69,810
3
$54,970
3
$2,310
1
$4,160
APPLICATIONS WITHDRAWN
1
$295,180
6
$152,900
12
$71,138
1
$5,540
4
$58,202
FILES CLOSED FOR INCOMPLETENESS
0
$0
0
$0
3
$125,183
0
$0
1
$76,220
Aggregated Statistics For Year 2002 (Based on 2 partial tracts)
B) Conventional Home Purchase Loans
C) Refinancings
D) Home Improvement Loans
Number
Average Value
Number
Average Value
Number
Average Value
LOANS ORIGINATED
8
$29,101
4
$56,818
4
$16,630
APPLICATIONS APPROVED, NOT ACCEPTED
10
$25,637
3
$49,890
0
$0
APPLICATIONS DENIED
10
$74,972
8
$57,164
4
$6,930
APPLICATIONS WITHDRAWN
1
$155,210
8
$50,062
0
$0
FILES CLOSED FOR INCOMPLETENESS
1
$187,080
4
$59,242
0
$0
Aggregated Statistics For Year 2001 (Based on 2 partial tracts)
A) FHA, FSA/RHS & VA Home Purchase Loans
B) Conventional Home Purchase Loans
C) Refinancings
D) Home Improvement Loans
E) Loans on Dwellings For 5+ Families
Number
Average Value
Number
Average Value
Number
Average Value
Number
Average Value
Number
Average Value
LOANS ORIGINATED
1
$171,840
17
$26,819
4
$118,485
1
$2,770
1
$2,189,560
APPLICATIONS APPROVED, NOT ACCEPTED
0
$0
10
$28,825
1
$59,590
0
$0
0
$0
APPLICATIONS DENIED
3
$104,860
25
$30,100
7
$32,467
6
$22,635
0
$0
APPLICATIONS WITHDRAWN
3
$111,327
4
$106,012
6
$71,600
0
$0
0
$0
FILES CLOSED FOR INCOMPLETENESS
0
$0
0
$0
3
$278,083
0
$0
0
$0
Aggregated Statistics For Year 2000 (Based on 2 partial tracts)
A) FHA, FSA/RHS & VA Home Purchase Loans
B) Conventional Home Purchase Loans
C) Refinancings
D) Home Improvement Loans
F) Non-occupant Loans on < 5 Family Dwellings (A B C & D)
Number
Average Value
Number
Average Value
Number
Average Value
Number
Average Value
Number
Average Value
LOANS ORIGINATED
1
$189,850
4
$40,188
3
$42,497
7
$12,076
3
$24,943
APPLICATIONS APPROVED, NOT ACCEPTED
3
$61,437
0
$0
3
$33,260
0
$0
0
$0
APPLICATIONS DENIED
0
$0
8
$40,535
3
$100,700
1
$29,100
3
$58,203
APPLICATIONS WITHDRAWN
1
$146,890
1
$38,800
4
$112,942
1
$11,090
0
$0
FILES CLOSED FOR INCOMPLETENESS
0
$0
1
$105,320
3
$24,483
0
$0
0
$0
Aggregated Statistics For Year 1999 (Based on 1 partial tract)
A) FHA, FSA/RHS & VA Home Purchase Loans
B) Conventional Home Purchase Loans
C) Refinancings
D) Home Improvement Loans
F) Non-occupant Loans on < 5 Family Dwellings (A B C & D)
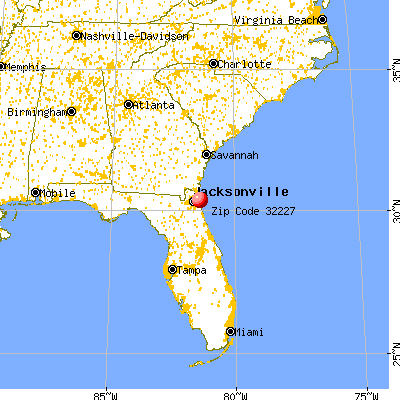


 Nearest zip codes: 32228, 32233, 32266, 32225, 32250, 32224.