Estimated zip code population in 2022: 33,153 Zip code population in 2010: 31,869 Zip code population in 2000: 28,450
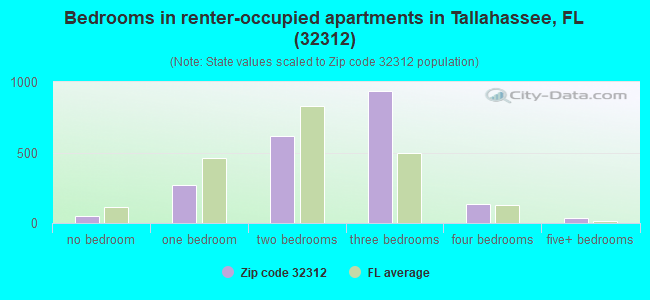
Houses and condos: 13,592 Renter-occupied apartments: 2,074
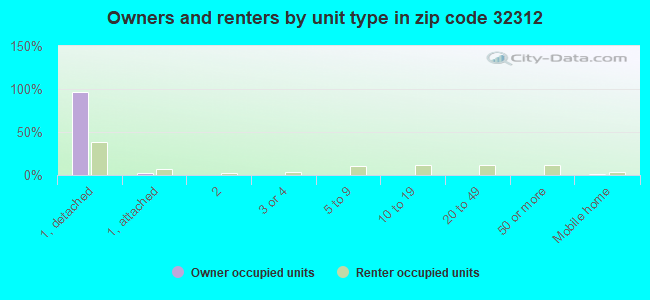
% of renters here:
16%
State:
33%
March 2022 cost of living index in zip code 32312: 89.2 (less than average, U.S. average is 100)
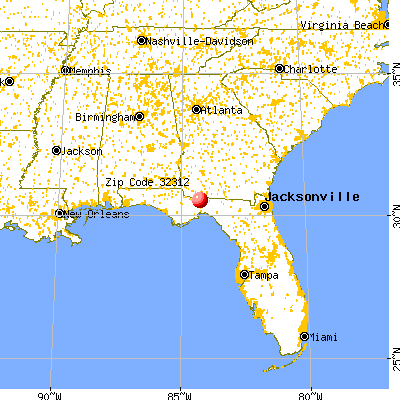
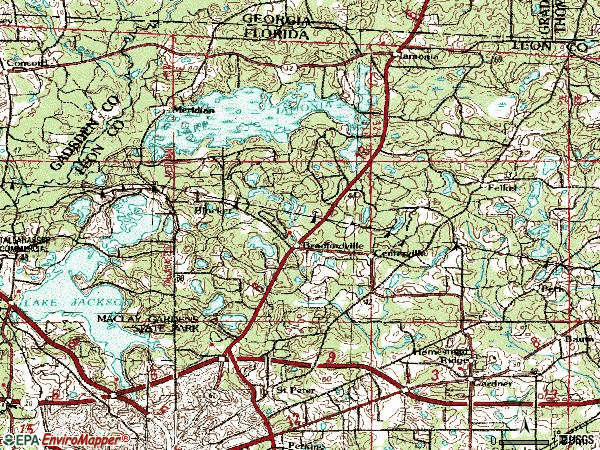
Land area: 104.3 sq. mi. Water area: 17.5 sq. mi.
Population density: 318 people per square mile
(very low).
OSM Map
General Map
Google Map
MSN Map
OSM Map
General Map
Google Map
MSN Map
OSM Map
General Map
Google Map
MSN Map
OSM Map
General Map
Google Map
MSN Map
Please wait while loading the map...
Real estate property taxes paid for housing units in 2022:
This zip code:
0.8% ($3,512)
Florida:
0.7% ($2,529)
Median real estate property taxes paid for housing units with mortgages in 2022: $3,713 (0.8%) Median real estate property taxes paid for housing units with no mortgage in 2022: $3,160 (0.7%)
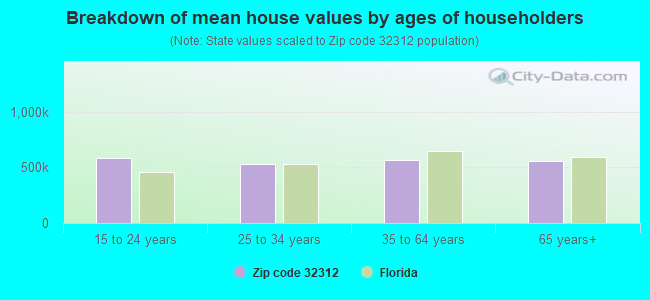
Estimated median house/condo value in 2022: $457,834
32312:
$457,834
Florida:
$354,100
According to our research of Florida and other state lists, there were 24 registered sex offenders living in 32312 zip code as of April 27, 2024. The ratio of all residents to sex offenders in zip code 32312 is 1,352 to 1. The ratio of registered sex offenders to all residents in this zip code is lower than the state average.
Median resident age:
This zip code:
43.4 years
Florida median age:
42.7 years
Average household size:
This zip code:
2.5 people
Florida:
2.5 people
Averages for the 2020 tax year for zip code 32312, filed in 2021:
Average Adjusted Gross Income (AGI) in 2020: $137,252 (Individual Income Tax Returns)
Here:
$137,252
State:
$82,200
Salary/wage: $98,240 (reported on 77.1% of returns)
Here:
$98,240
State:
$58,347
(% of AGI for various income ranges: 1244.7% for AGIs below $25k, 3601.1% for AGIs $25k-50k, 6155.5% for AGIs $50k-75k, 9230.2% for AGIs $75k-100k, 19089.0% for AGIs $100k-200k, 93474.2% for AGIs over 200k)
Taxable interest for individuals: $2,863 (reported on 43.9% of returns)
This zip code:
$2,863
Florida:
$4,272
(% of AGI for various income ranges: 23.5% for AGIs below $25k, 43.5% for AGIs $25k-50k, 83.8% for AGIs $50k-75k, 112.6% for AGIs $75k-100k, 223.3% for AGIs $100k-200k, 1987.3% for AGIs over 200k)
Ordinary dividends: $10,114 (reported on 35.1% of returns)
Here:
$10,114
State:
$15,863
(% of AGI for various income ranges: 47.8% for AGIs below $25k, 92.7% for AGIs $25k-50k, 230.4% for AGIs $50k-75k, 264.0% for AGIs $75k-100k, 733.4% for AGIs $100k-200k, 5576.6% for AGIs over 200k)
Net capital gain/loss in AGI: +$30,431 (reported on 32.4% of returns)
Here:
+$30,431
State:
+$62,983
(% of AGI for various income ranges: 37.2% for AGIs below $25k, 74.4% for AGIs $25k-50k, 183.5% for AGIs $50k-75k, 287.5% for AGIs $75k-100k, 834.4% for AGIs $100k-200k, 21878.4% for AGIs over 200k)
Profit/loss from business: +$23,599 (reported on 20.9% of returns)
Here:
+$23,599
State:
+$9,719
(% of AGI for various income ranges: 112.8% for AGIs below $25k, 211.3% for AGIs $25k-50k, 299.8% for AGIs $50k-75k, 473.6% for AGIs $75k-100k, 860.6% for AGIs $100k-200k, 7663.1% for AGIs over 200k)
Taxable individual retirement arrangement distribution: $24,717 (reported on 12.6% of returns)
32312:
$24,717
Florida:
$24,823
(% of AGI for various income ranges: 69.4% for AGIs below $25k, 136.5% for AGIs $25k-50k, 295.4% for AGIs $50k-75k, 490.0% for AGIs $75k-100k, 951.9% for AGIs $100k-200k, 3045.2% for AGIs over 200k)
Self-employed (Keogh) retirement plans: $28,283 (reported on 1.4% of returns)
32312:
$28,283
Florida:
$29,694
(% of AGI for various income ranges: 54.1% for AGIs $100k-200k, 847.2% for AGIs over 200k)
Total itemized deductions: $46,729 (reported on 12.9% of returns)
Here:
$46,729
State:
$45,393
(% of AGI for various income ranges: 76.0% for AGIs below $25k, 176.9% for AGIs $25k-50k, 401.2% for AGIs $50k-75k, 577.5% for AGIs $75k-100k, 1116.3% for AGIs $100k-200k, 9565.8% for AGIs over 200k)
Charity contributions: $25,356 (reported on 11.1% of returns)
Here:
$25,356
State:
$20,178
(% of AGI for various income ranges: 5.0% for AGIs below $25k, 39.1% for AGIs $25k-50k, 82.1% for AGIs $50k-75k, 139.1% for AGIs $75k-100k, 338.1% for AGIs $100k-200k, 5729.7% for AGIs over 200k)
Taxes paid: $7,085 (reported on 12.8% of returns)
32312:
$7,085
State:
$6,967
(% of AGI for various income ranges: 10.9% for AGIs below $25k, 25.2% for AGIs $25k-50k, 65.5% for AGIs $50k-75k, 105.8% for AGIs $75k-100k, 224.9% for AGIs $100k-200k, 1221.1% for AGIs over 200k)
Earned income credit: $2,073 (reported on 7.7% of returns)
Here:
$2,073
State:
$2,306
(% of AGI for various income ranges: 65.4% for AGIs below $25k, 50.7% for AGIs $25k-50k)
Percentage of individuals using paid preparers for their 2020 taxes: 90.9%
Here:
91%
State:
92%
(% for various income ranges: 90.8% for AGIs below $25k, 91.0% for AGIs $25k-50k, 91.5% for AGIs $50k-75k, 89.8% for AGIs $75k-100k, 90.6% for AGIs $100k-200k, 91.8% for AGIs over 200k)
Averages for the 2012 tax year for zip code 32312, filed in 2013:
Average Adjusted Gross Income (AGI) in 2012: $100,369 (Individual Income Tax Returns)
Here:
$100,369
State:
$60,316
Salary/wage: $77,662 (reported on 81.9% of returns)
Here:
$77,662
State:
$45,277
(% of AGI for various income ranges: 75.7% for AGIs below $25k, 74.7% for AGIs $25k-50k, 70.8% for AGIs $50k-75k, 71.2% for AGIs $75k-100k, 71.4% for AGIs $100k-200k, 52.3% for AGIs over 200k)
Taxable interest for individuals: $2,522 (reported on 45.6% of returns)
This zip code:
$2,522
Florida:
$3,587
(% of AGI for various income ranges: 1.8% for AGIs below $25k, 1.1% for AGIs $25k-50k, 1.2% for AGIs $50k-75k, 0.8% for AGIs $75k-100k, 0.9% for AGIs $100k-200k, 1.3% for AGIs over 200k)
Ordinary dividends: $8,314 (reported on 33.7% of returns)
Here:
$8,314
State:
$12,831
(% of AGI for various income ranges: 4.7% for AGIs below $25k, 2.8% for AGIs $25k-50k, 1.9% for AGIs $50k-75k, 1.8% for AGIs $75k-100k, 2.0% for AGIs $100k-200k, 3.6% for AGIs over 200k)
Net capital gain/loss in AGI: +$17,370 (reported on 28.3% of returns)
Here:
+$17,370
State:
+$33,493
(% of AGI for various income ranges: 1.1% for AGIs below $25k, 0.7% for AGIs $25k-50k, 0.5% for AGIs $50k-75k, 0.8% for AGIs $75k-100k, 1.4% for AGIs $100k-200k, 9.8% for AGIs over 200k)
Profit/loss from business: +$19,868 (reported on 20.1% of returns)
Here:
+$19,868
State:
+$10,012
(% of AGI for various income ranges: 6.8% for AGIs below $25k, 2.9% for AGIs $25k-50k, 2.8% for AGIs $50k-75k, 2.5% for AGIs $75k-100k, 3.9% for AGIs $100k-200k, 4.5% for AGIs over 200k)
Taxable individual retirement arrangement distribution: $20,744 (reported on 13.1% of returns)
32312:
$20,744
Florida:
$21,544
(% of AGI for various income ranges: 2.9% for AGIs below $25k, 3.0% for AGIs $25k-50k, 3.0% for AGIs $50k-75k, 3.6% for AGIs $75k-100k, 3.1% for AGIs $100k-200k, 2.1% for AGIs over 200k)
Self-employment retirement plans: $19,800 (reported on 1.6% of returns)
32312:
$19,800
Florida:
$20,611
(% of AGI for various income ranges: 0.3% for AGIs $50k-75k, 0.3% for AGIs $100k-200k, 0.5% for AGIs over 200k)
Total itemized deductions: $26,067 (16% of AGI, reported on 45.1% of returns)
Here:
$26,067
State:
$25,533
Here:
15.5% of AGI
State:
18.0% of AGI
(% of AGI for various income ranges: 14.8% for AGIs below $25k, 14.2% for AGIs $25k-50k, 14.7% for AGIs $50k-75k, 13.5% for AGIs $75k-100k, 13.1% for AGIs $100k-200k, 9.3% for AGIs over 200k)
Charity contributions: $7,010 (reported on 39.0% of returns)
Here:
$7,010
State:
$5,698
(% of AGI for various income ranges: 1.0% for AGIs below $25k, 2.0% for AGIs $25k-50k, 2.3% for AGIs $50k-75k, 2.3% for AGIs $75k-100k, 2.5% for AGIs $100k-200k, 3.2% for AGIs over 200k)
Taxes paid: $6,299 (reported on 44.5% of returns)
32312:
$6,299
State:
$6,203
(% of AGI for various income ranges: 2.3% for AGIs below $25k, 2.6% for AGIs $25k-50k, 3.2% for AGIs $50k-75k, 3.2% for AGIs $75k-100k, 3.4% for AGIs $100k-200k, 2.3% for AGIs over 200k)
Earned income credit: $1,940 (reported on 9.3% of returns)
Here:
$1,940
State:
$2,372
(% of AGI for various income ranges: 4.3% for AGIs below $25k, 0.7% for AGIs $25k-50k)
Percentage of individuals using paid preparers for their 2012 taxes: 46.8%
Here:
47%
State:
54%
(% for various income ranges: 41.2% for AGIs below $25k, 41.7% for AGIs $25k-50k, 44.9% for AGIs $50k-75k, 43.4% for AGIs $75k-100k, 49.8% for AGIs $100k-200k, 74.3% for AGIs over 200k)
Averages for the 2004 tax year for zip code 32312, filed in 2005:
Average Adjusted Gross Income (AGI) in 2004: $91,529 (Individual Income Tax Returns)
Here:
$91,529
State:
$50,523
Salary/wage: $69,506 (reported on 84.0% of returns)
Here:
$69,506
State:
$39,563
(% of AGI for various income ranges: 157.7% for AGIs below $10k, 74.2% for AGIs $10k-25k, 77.2% for AGIs $25k-50k, 77.8% for AGIs $50k-75k, 77.5% for AGIs $75k-100k, 57.1% for AGIs over 100k)
Taxable interest for individuals: $2,565 (reported on 58.2% of returns)
This zip code:
$2,565
Florida:
$3,211
(% of AGI for various income ranges: 13.9% for AGIs below $10k, 3.8% for AGIs $10k-25k, 2.0% for AGIs $25k-50k, 1.5% for AGIs $50k-75k, 1.4% for AGIs $75k-100k, 1.5% for AGIs over 100k)
Taxable dividends: $5,476 (reported on 40.1% of returns)
Here:
$5,476
State:
$6,129
(% of AGI for various income ranges: 12.9% for AGIs below $10k, 2.9% for AGIs $10k-25k, 2.0% for AGIs $25k-50k, 1.4% for AGIs $50k-75k, 1.8% for AGIs $75k-100k, 2.6% for AGIs over 100k)
Net capital gain/loss: +$29,062 (reported on 34.2% of returns)
Here:
+$29,062
State:
+$27,205
(% of AGI for various income ranges: -0.1% for AGIs below $10k, 1.0% for AGIs $10k-25k, 1.1% for AGIs $25k-50k, 1.4% for AGIs $50k-75k, 2.0% for AGIs $75k-100k, 15.1% for AGIs over 100k)
Profit/loss from business: +$22,778 (reported on 18.5% of returns)
Here:
+$22,778
State:
+$10,634
(% of AGI for various income ranges: 6.4% for AGIs below $10k, 5.0% for AGIs $10k-25k, 3.6% for AGIs $25k-50k, 3.5% for AGIs $50k-75k, 3.5% for AGIs $75k-100k, 5.0% for AGIs over 100k)
IRA payment deduction: $3,170 (reported on 3.1% of returns)
32312:
$3,170
Florida:
$3,082
(% of AGI for various income ranges: 0.4% for AGIs below $10k, 0.2% for AGIs $10k-25k, 0.3% for AGIs $25k-50k, 0.2% for AGIs $50k-75k, 0.2% for AGIs $75k-100k, 0.1% for AGIs over 100k)
Self-employed pension: $16,725 (reported on 2.3% of returns)
Here:
$16,725
Florida:
$15,857
(% of AGI for various income ranges: 0.2% for AGIs $25k-50k, 0.0% for AGIs $50k-75k, 0.2% for AGIs $75k-100k, 0.6% for AGIs over 100k)
Total itemized deductions: $22,392 (16% of AGI, reported on 50.4% of returns)
Here:
$22,392
State:
$20,370
Here:
16.1% of AGI
State:
20.7% of AGI
(% of AGI for various income ranges: 20.9% for AGIs below $10k, 21.2% for AGIs $10k-25k, 16.5% for AGIs $25k-50k, 16.3% for AGIs $50k-75k, 15.8% for AGIs $75k-100k, 10.4% for AGIs over 100k)
Charity contributions deductions: $6,248 (4% of AGI, reported on 45.6% of returns)
Here:
$6,248
State:
$4,064
Here:
4.3% of AGI
State:
3.8% of AGI
(% of AGI for various income ranges: 0.8% for AGIs below $10k, 1.7% for AGIs $10k-25k, 2.2% for AGIs $25k-50k, 2.5% for AGIs $50k-75k, 2.6% for AGIs $75k-100k, 3.4% for AGIs over 100k)
Total tax: $18,425 (reported on 83.1% of returns)
32312:
$18,425
State:
$9,431
(% of AGI for various income ranges: 4.8% for AGIs below $10k, 4.7% for AGIs $10k-25k, 7.2% for AGIs $25k-50k, 9.0% for AGIs $50k-75k, 10.4% for AGIs $75k-100k, 20.3% for AGIs over 100k)
Earned income credit: $1,450 (reported on 6.4% of returns)
Here:
$1,450
State:
$1,808
Percentage of individuals using paid preparers for their 2004 taxes: 49.2%
Here:
49%
State:
60%
(% for various income ranges: 42.7% for AGIs below $10k, 49.9% for AGIs $10k-25k, 47.7% for AGIs $25k-50k, 43.9% for AGIs $50k-75k, 45.0% for AGIs $75k-100k, 59.4% for AGIs over 100k)
Likely homosexual households (counted as self-reported same-sex unmarried-partner households)
Lesbian couples: 0.0% of all households
Gay men: 0.0% of all households
Household received Food Stamps/SNAP in the past 12 months: 525 Household did not receive Food Stamps/SNAP in the past 12 months: 12,657
Women who had a birth in the past 12 months: 450 (347 now married, 110 unmarried) Women who did not have a birth in the past 12 months: 6,505 (3,557 now married, 2,951 unmarried)
Housing units in zip code 32312 with a mortgage: 6,931 (773 second mortgage, 26 home equity loan, 676 both second mortgage and home equity loan) Houses without a mortgage: 246
Median monthly owner costs for units with a mortgage: $2,171 Median monthly owner costs for units without a mortgage: $687
Residents with income below the poverty level in 2022:
This zip code:
6.3%
Whole state:
12.7%
Residents with income below 50% of the poverty level in 2022:
This zip code:
3.5%
Whole state:
6.6%
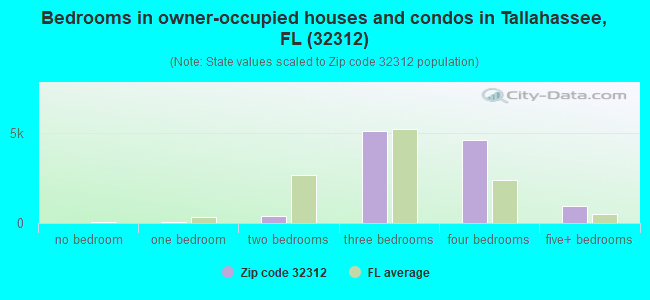
Median number of rooms in houses and condos:
Here:
7.2
State:
5.9
Median number of rooms in apartments:
Here:
4.9
State:
4.2
Notable locations in this zip code not listed on our city pages
Notable locations in zip code 32312: Timberlane Shops on the Square (A), Bull Headley Public Landing (B), The Village Center (C), Millers Public Landing (D), Lake Iamonia Volunteer Fire Department and Emergency Medical Services (E), Tallahassee City Fire Department Station 15 (F). Display/hide their locations on the map
Churches in zip code 32312 include: Betholonia Church (A), Popular Spring Church (B), Temple Church (C), Brown-Bethel Church (D), Saint Clements Chapel (E), Episcopal Church of the Advent (F), Saint Mathews Church (G), Elizabeth Popular Spring Primitive Baptist Church (H), New Hope Church (I). Display/hide their locations on the map
Cemeteries: Bell Cemetery (1), Lester Cemetery (2), Van Brunt Cemetery (3), Roselawn Cemetery (4), Mitchell Cemetery (5), Meadowwood Memorial Park (6), Lamonia Cemetery (7). Display/hide their locations on the map
Lakes: Buck Pond (A), Lake Monkey Business (B), Moore Pond (C), Lake Hall (D), Boat Pond (E), Pine Hill Lake (F), Bradford Pond (G), Spring Pond (H). Display/hide their locations on the map
Parks in zip code 32312 include: Killearn Gardens State Park (1), Alfred B Maclay Gardens State Park (2), Forestmeadows Park (3), Elinor Knapp-Phipps Park (4). Display/hide their locations on the map
In group quarters: 101 (-1 institutionalized population)
Size of family households: 4,634 2-persons, 2,256 3-persons, 2,162 4-persons, 694 5-persons, 139 6-persons, 100 7-or-more-persons
Size of nonfamily households: 2,773 1-person, 273 2-persons, 13 3-persons
6,388 married couples with children.
1,426 single-parent households (451 men, 975 women).
89.4% of residents of 32312 zip code speak English at home.
2.6% of residents speak Spanish at home (67% very well, 24% well, 5% not well, 4% not at all).
2.5% of residents speak other Indo-European language at home (77% very well, 19% well, 3% not well, 2% not at all).
4.2% of residents speak Asian or Pacific Island language at home (63% very well, 23% well, 6% not well, 8% not at all).
0.9% of residents speak other language at home (100% very well).
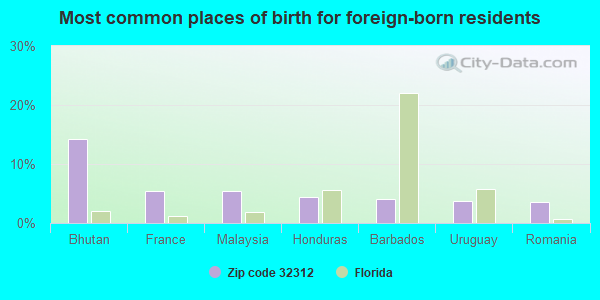
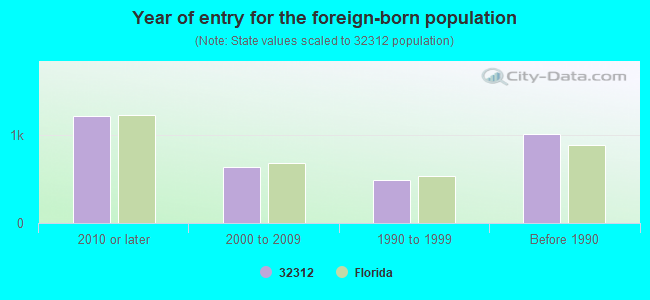
Foreign born population: 3,041 (9.2%) (63.3% of them are naturalized citizens)
Major facilities with environmental interests located in this zip code:
KILLEARN LAKES ELEMENTARY SCHOOL (8037 DEER LAKE DRIVE EAST in TALLAHASSEE, FL)
(Geographic Names Information System) (National Center for Education Statistics) - STATE ID-0481 Organizations: LEON COUNTY SCHOOL DISTRICT (SCHOOL DISTRICT)
GILCHRIST ELEMENTARY SCHOOL (1301 TIMBERLANE RD in TALLAHASSEE, FL)
(Geographic Names Information System) (National Center for Education Statistics) - STATE ID-0381 Organizations: LEON COUNTY SCHOOL DISTRICT (SCHOOL DISTRICT)
HAWKS RISE ELEMENTARY SCHOOL (205 MEADOW RIDGE RD in TALLAHASSEE, FL)
(National Center for Education Statistics) - STATE ID-1131 Organizations: LEON COUNTY SCHOOL DISTRICT (SCHOOL DISTRICT)
LAWTON CHILES HIGH SCHOOL (7200 LAWTON CHILES LANE in TALLAHASSEE, FL)
(National Center for Education Statistics) - STATE ID-1141 Organizations: LEON COUNTY SCHOOL DISTRICT (SCHOOL DISTRICT)
DEERLAKE MIDDLE SCHOOL (9902 DEER LAKE ROAD WEST in TALLAHASSEE, FL)
(National Center for Education Statistics) - STATE ID-0531 Organizations: LEON COUNTY SCHOOL DISTRICT (SCHOOL DISTRICT)
SEALEY ELEMENTARY SCHOOL (2815 ALLEN RD in TALLAHASSEE, FL)
(National Center for Education Statistics) - STATE ID-0431 Organizations: LEON COUNTY SCHOOL DISTRICT (SCHOOL DISTRICT)
O'BRIEN'S SHAMROCK CLEANERS (3501 SOUTH MACLAY BOULEVARD in TALLAHASSEE, FL)
AIR MINOR (AIRS/AFS) (Resource Conservation and Recovery Act (tracking hazardous waste)) Business SIC classification: DRYCLEANING PLANTS, EXCEPT RUG CLEANING Organizations: BRETT O`BRIEN (CONTACT/OWNER)
MACLAY ROAD REALIGNMENT (MACLAY ROAD in TALLAHASSEE, FL)
National Pollutant Discharge Elimination System NON-MAJOR (Tracking pollutant discharge elimination systems) - permit Organizations: JON LICH (CONTACT/OWNER)
OX BOTTOM SUBDIVISION UNITS 5 (SOUTH END OF OX BOW CIRCLE in TALLAHASSEE, FL)
National Pollutant Discharge Elimination System NON-MAJOR (Tracking pollutant discharge elimination systems) - permit Organizations: ROBERT CAMPBELL (CONTACT/OWNER)
SABLE CHASE (N. OF BANNERMAN, BETWEEN TEKES in TALLAHASSEE, FL)
National Pollutant Discharge Elimination System NON-MAJOR (Tracking pollutant discharge elimination systems) - permit Organizations: MEHRDAD GHAVZINI (CONTACT/OWNER)
SERPICO ~ MINI-WAREHOUSE & RES (THOMASVILLE ROAD, SOUTH OF MIL in TALLAHASSEE, FL)
National Pollutant Discharge Elimination System NON-MAJOR (Tracking pollutant discharge elimination systems) - permit Organizations: JOSEPH SERPICO (CONTACT/OWNER)
HIDDEN POND SUBDIVISION ( in TALLAHASSEE, FL)
National Pollutant Discharge Elimination System NON-MAJOR (Tracking pollutant discharge elimination systems) - permit Organizations: DANNY BROWN (CONTACT/OWNER)
National Pollutant Discharge Elimination System NON-MAJOR (Tracking pollutant discharge elimination systems) - permit Organizations: BYRON BLOCK (CONTACT/OWNER)
Housing units lacking complete plumbing facilities: 0.7% Housing units lacking complete kitchen facilities: 0.8%
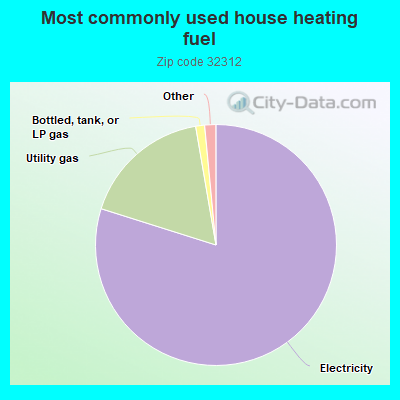
79.8%Electricity
17.4%Utility gas
1.2%Bottled, tank, or LP gas
0.7%No fuel used
0.6%Wood
Population in 1990: 17,743. Population change in the 1990s: +10,707 (+60.3%).
Place of birth for U.S.-born residents:
This state: 16,286
Northeast: 3,533
Midwest: 2,934
South: 5,989
West: 855
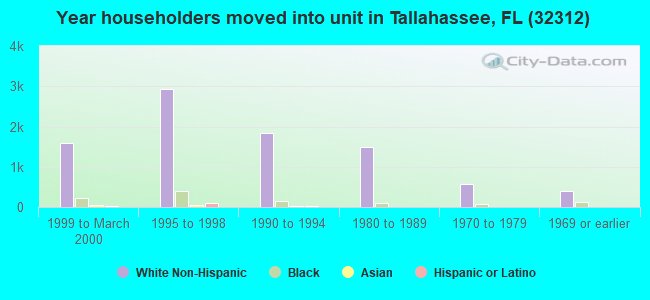
53% of the 32312 zip code residents lived in the same house 5 years ago. Out of people who lived in different houses, 55% lived in this county. Out of people who lived in different counties, 50% lived in Florida.
91% of the 32312 zip code residents lived in the same house 1 year ago. Out of people who lived in different houses, 62% moved from this county. Out of people who lived in different houses, 13% moved from different county within same state. Out of people who lived in different houses, 13% moved from different state. Out of people who lived in different houses, 9% moved from abroad.
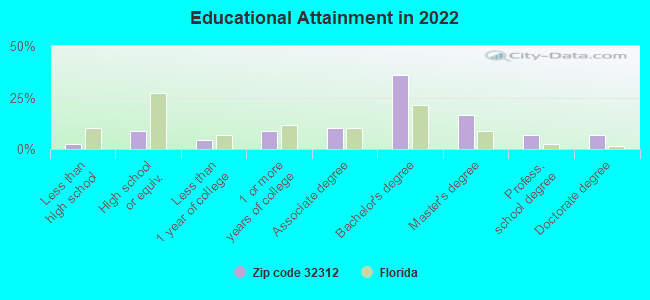
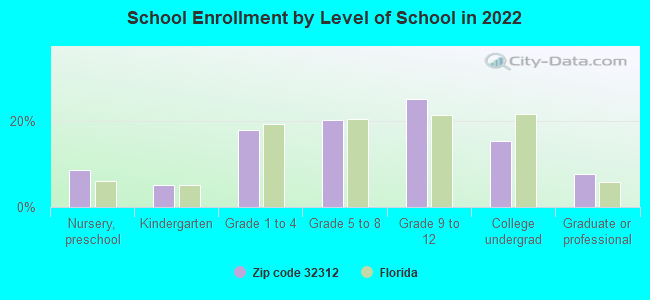
Private vs. public school enrollment:
Students in private schools in grades 1 to 8 (elementary and middle school): 635
Here:
18.6%
Florida:
15.8%
Students in private schools in grades 9 to 12 (high school): 323
Here:
14.4%
Florida:
12.9%
Students in private undergraduate colleges: 111
Here:
8.3%
Florida:
23.6%
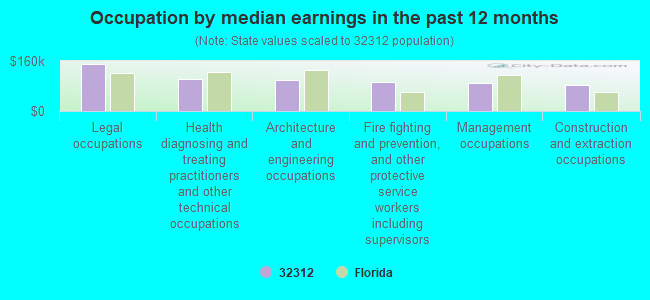
Occupation by median earnings in the past 12 months ($)
149,809Legal occupations
101,642Health diagnosing and treating practitioners and other technical occupations
98,165Architecture and engineering occupations
93,460Fire fighting and prevention, and other protective service workers including supervisors
88,384Management occupations
83,196Construction and extraction occupations
Companies with federal contracts located in this zip code (TALLAHASSEE, FL):
INTEGRATED DESIGN TOOLS INC (208 ROSEHILL DR; small business) 2 employees, $110000 revenue. : $496,000 in 8 contractsfrom 2000 to 2002
Contracts for Optical Instruments, Test Equipment, Components and Accessories, ADP Input/Output and Storage Devices, Photographic Equipment and Accessories, Technical Representation Services -- Miscellaneous, and moreby NASA Signed by year:2000: $271,000; 2001: $35,000; 2002: $190,000; 2003: $0; 2004: $0; 2005: $0; 2006: $0.
Biggest contracts:
$197,000 with NASA for Optical Instruments, Test Equipment, Components and Accessories. Signed on 2000-05-15. Completion date: 2000-07-15.
$91,000 with NASA for ADP Input/Output and Storage Devices. Signed on 2002-06-15. Completion date: 2002-06-15.
$56,000 with NASA for Photographic Equipment and Accessories. Signed on 2002-06-15. Completion date: 2002-07-15.
$43,000 with NASA for Technical Representation Services -- Miscellaneous. Signed on 2002-09-15. Completion date: 2002-12-15.
PIETRODANGELO PRODUCTION GROUP (406 TIMBERLANE ROAD; small business) : $336,105 in 2 contractsin 2004
$256,025 with Navy for Other Education and Training Services. Taking place in RI. Signed on 2004-09-28. Completion date: 2005-09-26.
$80,080 with Navy for AIDS Training. Taking place in RI. Signed on 2004-07-27. Completion date: 2004-11-27.
MC RAE & COMPANY INC (1401 MACLAY COMMERCE DR; small business)
$5,520 with Army for Tuition, Registration, and Membership Fees. Taking place in KY. Signed on 2004-03-25. Completion date: 2004-03-25.
PREMIER HEALTH & FITNESS CENTE (3521 MACLAY BLVD S) : $432 in 2 contractsin 2005
$216 with U.S. Army Corps of Engineers - civil program financing only for Other Medical Services. Signed on 2005-01-21. Completion date: 2005-12-31.
$216 with Army for Other Medical Services. Signed on 2005-01-21. Completion date: 2005-12-31.
Top industries in this zip code by the number of employees in 2005:
2002 - 2018 National Fire Incident Reporting System (NFIRS) incidents
According to the data from the years 2002 - 2018 the average number of fire incidents per year is 128. The highest number of fire incidents - 248 took place in 2011, and the least - 0 in 2004. The data has a rising trend.
When looking into fire subcategories, the most reports belonged to: Outside Fires (54.4%), and Structure Fires (27.7%).
Fire incident types reported to NFIRS in Zip Code 32312


 Nearest zip codes: 32308, 32309, 32303, 32317, 32399, 32301.
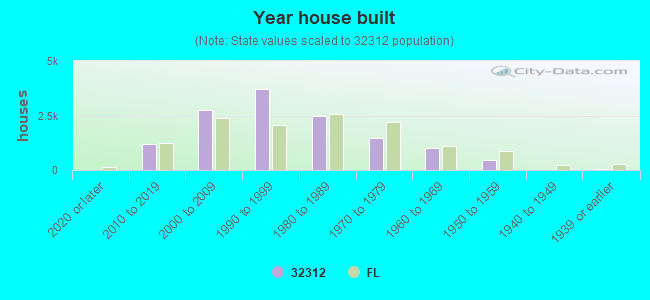


 According to the data from the years 2002 - 2018 the average number of fire incidents per year is 128. The highest number of fire incidents - 248 took place in 2011, and the least - 0 in 2004. The data has a rising trend.
 When looking into fire subcategories, the most reports belonged to: Outside Fires (54.4%), and Structure Fires (27.7%).