Estimated zip code population in 2022: 23,777 Zip code population in 2010: 21,586 Zip code population in 2000: 45,117
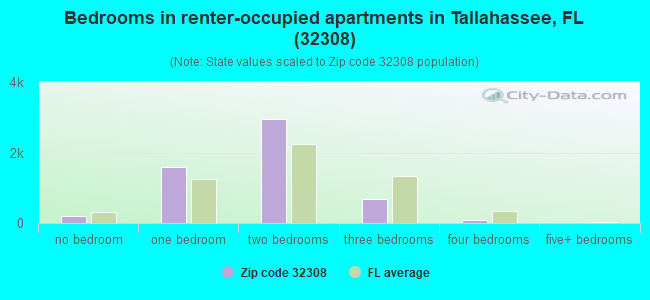
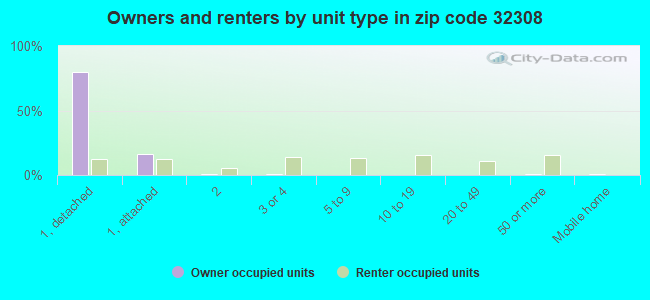
Houses and condos: 12,284 Renter-occupied apartments: 5,496
% of renters here:
47%
State:
33%
March 2022 cost of living index in zip code 32308: 89.3 (less than average, U.S. average is 100)
Land area: 14.8 sq. mi. Water area: 0.2 sq. mi.
Population density: 1,611 people per square mile
(low).
OSM Map
General Map
Google Map
MSN Map
OSM Map
General Map
Google Map
MSN Map
OSM Map
General Map
Google Map
MSN Map
OSM Map
General Map
Google Map
MSN Map
Please wait while loading the map...
Real estate property taxes paid for housing units in 2022:
This zip code:
0.8% ($2,595)
Florida:
0.7% ($2,529)
Median real estate property taxes paid for housing units with mortgages in 2022: $2,583 (0.8%) Median real estate property taxes paid for housing units with no mortgage in 2022: $2,610 (0.7%)
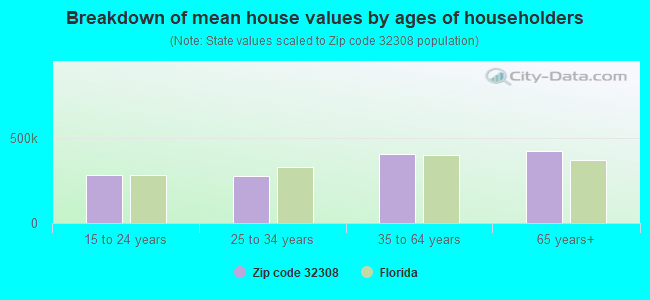
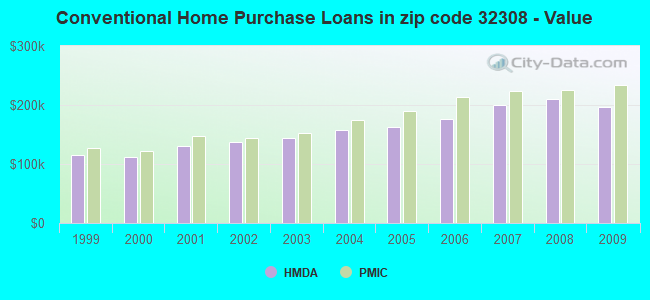
Estimated median house/condo value in 2022: $339,073
32308:
$339,073
Florida:
$354,100
According to our research of Florida and other state lists, there were 28 registered sex offenders living in 32308 zip code as of April 26, 2024. The ratio of all residents to sex offenders in zip code 32308 is 843 to 1. The ratio of registered sex offenders to all residents in this zip code is lower than the state average.
Median resident age:
This zip code:
43.3 years
Florida median age:
42.7 years
Average household size:
This zip code:
1.9 people
Florida:
2.5 people
Averages for the 2020 tax year for zip code 32308, filed in 2021:
Average Adjusted Gross Income (AGI) in 2020: $91,748 (Individual Income Tax Returns)
Here:
$91,748
State:
$82,200
Salary/wage: $63,946 (reported on 75.7% of returns)
Here:
$63,946
State:
$58,347
(% of AGI for various income ranges: 1267.6% for AGIs below $25k, 3727.0% for AGIs $25k-50k, 6444.3% for AGIs $50k-75k, 8649.2% for AGIs $75k-100k, 17020.0% for AGIs $100k-200k, 76331.0% for AGIs over 200k)
Taxable interest for individuals: $2,772 (reported on 35.7% of returns)
This zip code:
$2,772
Florida:
$4,272
(% of AGI for various income ranges: 16.7% for AGIs below $25k, 27.7% for AGIs $25k-50k, 65.5% for AGIs $50k-75k, 117.6% for AGIs $75k-100k, 290.1% for AGIs $100k-200k, 3061.0% for AGIs over 200k)
Ordinary dividends: $10,747 (reported on 26.8% of returns)
Here:
$10,747
State:
$15,863
(% of AGI for various income ranges: 33.9% for AGIs below $25k, 63.7% for AGIs $25k-50k, 166.6% for AGIs $50k-75k, 342.4% for AGIs $75k-100k, 866.6% for AGIs $100k-200k, 9349.5% for AGIs over 200k)
Net capital gain/loss in AGI: +$24,634 (reported on 23.9% of returns)
Here:
+$24,634
State:
+$62,983
(% of AGI for various income ranges: 12.6% for AGIs below $25k, 33.3% for AGIs $25k-50k, 146.1% for AGIs $50k-75k, 230.9% for AGIs $75k-100k, 881.4% for AGIs $100k-200k, 27622.9% for AGIs over 200k)
Profit/loss from business: +$16,190 (reported on 17.0% of returns)
Here:
+$16,190
State:
+$9,719
(% of AGI for various income ranges: 104.8% for AGIs below $25k, 82.4% for AGIs $25k-50k, 187.8% for AGIs $50k-75k, 301.9% for AGIs $75k-100k, 652.1% for AGIs $100k-200k, 8608.1% for AGIs over 200k)
Taxable individual retirement arrangement distribution: $21,710 (reported on 11.8% of returns)
32308:
$21,710
Florida:
$24,823
(% of AGI for various income ranges: 53.6% for AGIs below $25k, 96.2% for AGIs $25k-50k, 187.6% for AGIs $50k-75k, 449.6% for AGIs $75k-100k, 1126.1% for AGIs $100k-200k, 5257.6% for AGIs over 200k)
Self-employed (Keogh) retirement plans: $27,057 (reported on 0.6% of returns)
32308:
$27,057
Florida:
$29,694
(% of AGI for various income ranges: 901.9% for AGIs over 200k)
Total itemized deductions: $39,774 (reported on 9.6% of returns)
Here:
$39,774
State:
$45,393
(% of AGI for various income ranges: 56.2% for AGIs below $25k, 150.8% for AGIs $25k-50k, 378.6% for AGIs $50k-75k, 723.4% for AGIs $75k-100k, 1263.0% for AGIs $100k-200k, 8980.5% for AGIs over 200k)
Charity contributions: $17,025 (reported on 8.2% of returns)
Here:
$17,025
State:
$20,178
(% of AGI for various income ranges: 3.6% for AGIs below $25k, 29.7% for AGIs $25k-50k, 92.3% for AGIs $50k-75k, 157.8% for AGIs $75k-100k, 422.0% for AGIs $100k-200k, 4648.6% for AGIs over 200k)
Taxes paid: $5,860 (reported on 9.3% of returns)
32308:
$5,860
State:
$6,967
(% of AGI for various income ranges: 4.9% for AGIs below $25k, 17.7% for AGIs $25k-50k, 56.0% for AGIs $50k-75k, 111.8% for AGIs $75k-100k, 194.0% for AGIs $100k-200k, 1270.5% for AGIs over 200k)
Earned income credit: $2,127 (reported on 11.9% of returns)
Here:
$2,127
State:
$2,306
(% of AGI for various income ranges: 86.1% for AGIs below $25k, 45.3% for AGIs $25k-50k)
Percentage of individuals using paid preparers for their 2020 taxes: 90.9%
Here:
91%
State:
92%
(% for various income ranges: 90.7% for AGIs below $25k, 92.3% for AGIs $25k-50k, 91.7% for AGIs $50k-75k, 89.2% for AGIs $75k-100k, 88.4% for AGIs $100k-200k, 92.4% for AGIs over 200k)
Averages for the 2012 tax year for zip code 32308, filed in 2013:
Average Adjusted Gross Income (AGI) in 2012: $66,120 (Individual Income Tax Returns)
Here:
$66,120
State:
$60,316
Salary/wage: $51,806 (reported on 79.9% of returns)
Here:
$51,806
State:
$45,277
(% of AGI for various income ranges: 77.5% for AGIs below $25k, 80.2% for AGIs $25k-50k, 69.8% for AGIs $50k-75k, 65.4% for AGIs $75k-100k, 63.5% for AGIs $100k-200k, 45.5% for AGIs over 200k)
Taxable interest for individuals: $2,312 (reported on 37.3% of returns)
This zip code:
$2,312
Florida:
$3,587
(% of AGI for various income ranges: 1.0% for AGIs below $25k, 0.9% for AGIs $25k-50k, 1.0% for AGIs $50k-75k, 1.1% for AGIs $75k-100k, 1.2% for AGIs $100k-200k, 1.9% for AGIs over 200k)
Ordinary dividends: $8,719 (reported on 24.7% of returns)
Here:
$8,719
State:
$12,831
(% of AGI for various income ranges: 3.0% for AGIs below $25k, 1.6% for AGIs $25k-50k, 1.9% for AGIs $50k-75k, 2.4% for AGIs $75k-100k, 2.8% for AGIs $100k-200k, 5.5% for AGIs over 200k)
Net capital gain/loss in AGI: +$13,312 (reported on 20.1% of returns)
Here:
+$13,312
State:
+$33,493
(% of AGI for various income ranges: 0.2% for AGIs $25k-50k, 0.3% for AGIs $50k-75k, 0.9% for AGIs $75k-100k, 2.3% for AGIs $100k-200k, 11.3% for AGIs over 200k)
Profit/loss from business: +$17,672 (reported on 15.4% of returns)
Here:
+$17,672
State:
+$10,012
(% of AGI for various income ranges: 5.3% for AGIs below $25k, 2.4% for AGIs $25k-50k, 2.2% for AGIs $50k-75k, 2.7% for AGIs $75k-100k, 3.8% for AGIs $100k-200k, 6.4% for AGIs over 200k)
Taxable individual retirement arrangement distribution: $18,666 (reported on 12.0% of returns)
32308:
$18,666
Florida:
$21,544
(% of AGI for various income ranges: 2.3% for AGIs below $25k, 1.8% for AGIs $25k-50k, 2.6% for AGIs $50k-75k, 3.1% for AGIs $75k-100k, 3.9% for AGIs $100k-200k, 4.4% for AGIs over 200k)
Self-employment retirement plans: $18,955 (reported on 1.0% of returns)
32308:
$18,955
Florida:
$20,611
(% of AGI for various income ranges: 0.3% for AGIs below $25k, 0.3% for AGIs $100k-200k, 0.7% for AGIs over 200k)
Total itemized deductions: $23,372 (19% of AGI, reported on 30.2% of returns)
Here:
$23,372
State:
$25,533
Here:
18.6% of AGI
State:
18.0% of AGI
(% of AGI for various income ranges: 9.7% for AGIs below $25k, 9.7% for AGIs $25k-50k, 11.9% for AGIs $50k-75k, 11.7% for AGIs $75k-100k, 11.8% for AGIs $100k-200k, 9.4% for AGIs over 200k)
Charity contributions: $6,215 (reported on 25.7% of returns)
Here:
$6,215
State:
$5,698
(% of AGI for various income ranges: 0.9% for AGIs below $25k, 1.5% for AGIs $25k-50k, 2.1% for AGIs $50k-75k, 2.7% for AGIs $75k-100k, 2.9% for AGIs $100k-200k, 2.8% for AGIs over 200k)
Taxes paid: $4,807 (reported on 29.4% of returns)
32308:
$4,807
State:
$6,203
(% of AGI for various income ranges: 1.0% for AGIs below $25k, 1.4% for AGIs $25k-50k, 2.2% for AGIs $50k-75k, 2.2% for AGIs $75k-100k, 2.6% for AGIs $100k-200k, 2.3% for AGIs over 200k)
Earned income credit: $2,132 (reported on 15.7% of returns)
Here:
$2,132
State:
$2,372
(% of AGI for various income ranges: 5.8% for AGIs below $25k, 0.8% for AGIs $25k-50k)
Percentage of individuals using paid preparers for their 2012 taxes: 42.5%
Here:
42%
State:
54%
(% for various income ranges: 39.1% for AGIs below $25k, 34.5% for AGIs $25k-50k, 42.3% for AGIs $50k-75k, 44.7% for AGIs $75k-100k, 53.6% for AGIs $100k-200k, 79.6% for AGIs over 200k)
Averages for the 2004 tax year for zip code 32308, filed in 2005:
Average Adjusted Gross Income (AGI) in 2004: $65,276 (Individual Income Tax Returns)
Here:
$65,276
State:
$50,523
Salary/wage: $51,302 (reported on 81.6% of returns)
Here:
$51,302
State:
$39,563
(% of AGI for various income ranges: 111.8% for AGIs below $10k, 76.8% for AGIs $10k-25k, 80.0% for AGIs $25k-50k, 75.8% for AGIs $50k-75k, 71.7% for AGIs $75k-100k, 53.3% for AGIs over 100k)
Taxable interest for individuals: $2,474 (reported on 51.2% of returns)
This zip code:
$2,474
Florida:
$3,211
(% of AGI for various income ranges: 5.7% for AGIs below $10k, 2.8% for AGIs $10k-25k, 1.6% for AGIs $25k-50k, 1.7% for AGIs $50k-75k, 1.9% for AGIs $75k-100k, 2.0% for AGIs over 100k)
Taxable dividends: $5,163 (reported on 31.4% of returns)
Here:
$5,163
State:
$6,129
(% of AGI for various income ranges: 7.1% for AGIs below $10k, 2.1% for AGIs $10k-25k, 1.7% for AGIs $25k-50k, 1.7% for AGIs $50k-75k, 2.1% for AGIs $75k-100k, 3.0% for AGIs over 100k)
Net capital gain/loss: +$23,391 (reported on 25.6% of returns)
Here:
+$23,391
State:
+$27,205
(% of AGI for various income ranges: -2.5% for AGIs below $10k, 0.3% for AGIs $10k-25k, 0.6% for AGIs $25k-50k, 1.0% for AGIs $50k-75k, 2.0% for AGIs $75k-100k, 16.2% for AGIs over 100k)
Profit/loss from business: +$19,626 (reported on 15.1% of returns)
Here:
+$19,626
State:
+$10,634
(% of AGI for various income ranges: 6.6% for AGIs below $10k, 3.0% for AGIs $10k-25k, 2.5% for AGIs $25k-50k, 3.0% for AGIs $50k-75k, 4.4% for AGIs $75k-100k, 5.6% for AGIs over 100k)
IRA payment deduction: $3,150 (reported on 2.7% of returns)
32308:
$3,150
Florida:
$3,082
(% of AGI for various income ranges: 0.3% for AGIs below $10k, 0.1% for AGIs $10k-25k, 0.2% for AGIs $25k-50k, 0.2% for AGIs $50k-75k, 0.1% for AGIs $75k-100k, 0.1% for AGIs over 100k)
Self-employed pension: $14,711 (reported on 1.5% of returns)
Here:
$14,711
Florida:
$15,857
(% of AGI for various income ranges: 0.1% for AGIs $25k-50k, 0.1% for AGIs $50k-75k, 0.3% for AGIs $75k-100k, 0.5% for AGIs over 100k)
Total itemized deductions: $19,407 (17% of AGI, reported on 36.6% of returns)
Here:
$19,407
State:
$20,370
Here:
17.1% of AGI
State:
20.7% of AGI
(% of AGI for various income ranges: 17.4% for AGIs below $10k, 9.8% for AGIs $10k-25k, 11.7% for AGIs $25k-50k, 12.6% for AGIs $50k-75k, 12.9% for AGIs $75k-100k, 9.7% for AGIs over 100k)
Charity contributions deductions: $5,692 (5% of AGI, reported on 32.5% of returns)
Here:
$5,692
State:
$4,064
Here:
4.8% of AGI
State:
3.8% of AGI
(% of AGI for various income ranges: 1.2% for AGIs below $10k, 1.2% for AGIs $10k-25k, 1.9% for AGIs $25k-50k, 2.5% for AGIs $50k-75k, 3.1% for AGIs $75k-100k, 3.3% for AGIs over 100k)
Total tax: $12,184 (reported on 81.2% of returns)
32308:
$12,184
State:
$9,431
(% of AGI for various income ranges: 3.7% for AGIs below $10k, 4.1% for AGIs $10k-25k, 7.9% for AGIs $25k-50k, 10.6% for AGIs $50k-75k, 11.9% for AGIs $75k-100k, 20.2% for AGIs over 100k)
Earned income credit: $1,658 (reported on 10.9% of returns)
Here:
$1,658
State:
$1,808
Percentage of individuals using paid preparers for their 2004 taxes: 47.0%
Here:
47%
State:
60%
(% for various income ranges: 41.4% for AGIs below $10k, 49.8% for AGIs $10k-25k, 42.3% for AGIs $25k-50k, 43.2% for AGIs $50k-75k, 43.9% for AGIs $75k-100k, 62.5% for AGIs over 100k)
Likely homosexual households (counted as self-reported same-sex unmarried-partner households)
Lesbian couples: 0.0% of all households
Gay men: 0.4% of all households
Household received Food Stamps/SNAP in the past 12 months: 439 Household did not receive Food Stamps/SNAP in the past 12 months: 11,265
Women who had a birth in the past 12 months: 101 (103 now married, 2 unmarried) Women who did not have a birth in the past 12 months: 5,417 (1,978 now married, 3,438 unmarried)
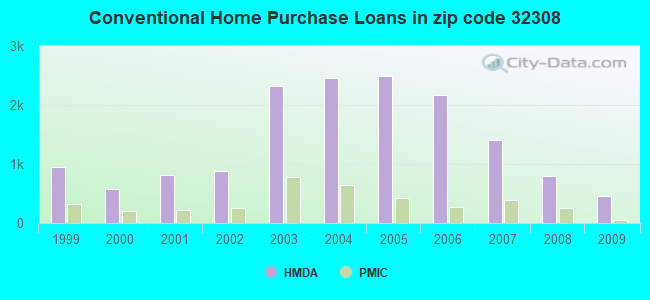
Housing units in zip code 32308 with a mortgage: 3,818 (341 second mortgage, 11 home equity loan, 231 both second mortgage and home equity loan) Houses without a mortgage: 150
Median monthly owner costs for units with a mortgage: $1,689 Median monthly owner costs for units without a mortgage: $608
Residents with income below the poverty level in 2022:
This zip code:
9.7%
Whole state:
12.7%
Residents with income below 50% of the poverty level in 2022:
This zip code:
6.6%
Whole state:
6.6%
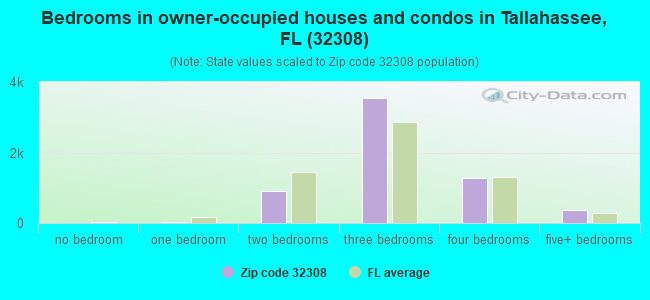
Median number of rooms in houses and condos:
Here:
6.4
State:
5.9
Median number of rooms in apartments:
Here:
3.8
State:
4.2
Notable locations in this zip code not listed on our city pages
Notable locations in zip code 32308: Capital Center (A), Capitol Plaza (B), Miracle Plaza (C), Killearn Center (D), Register Junction (E), Select Specialty Hospital (F), Lifenet Tallahassee (G), Leon County Emergency Medical Services (H), Tallahassee City Fire Department Station 9 (I). Display/hide their locations on the map
Churches in zip code 32308 include: Calvary Church (A), Episcopal Church Holy Comforter (B), New Zion Church (C), First Church of Nazarene (D), Grace Lutheran Church (E), Catholic Church of Blessed Sacrament (F), Greek Orthodox Church Holy Mother of God (G), Immanuel Baptist Church (H), Mount Olive Church (I). Display/hide their locations on the map
2,694 married couples with children.
1,205 single-parent households (193 men, 1,012 women).
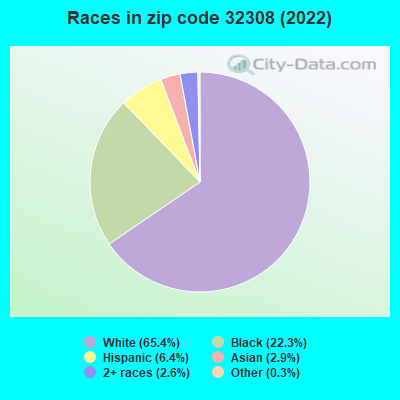
90.2% of residents of 32308 zip code speak English at home.
4.1% of residents speak Spanish at home (61% very well, 31% well, 4% not well, 3% not at all).
2.7% of residents speak other Indo-European language at home (85% very well, 10% well, 5% not well).
2.0% of residents speak Asian or Pacific Island language at home (61% very well, 39% well).
0.6% of residents speak other language at home (100% very well).
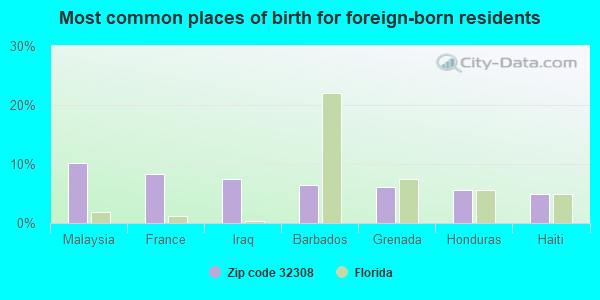
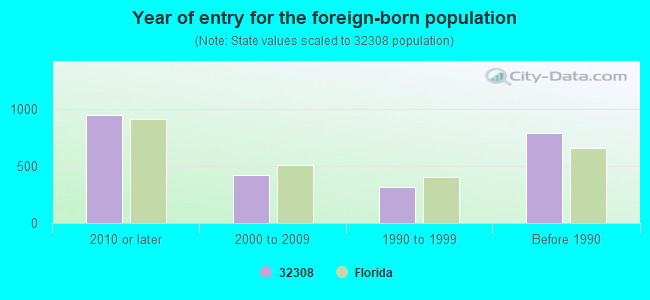
Foreign born population: 1,911 (8.0%) (56.1% of them are naturalized citizens)
Major facilities with environmental interests located in this zip code:
PROCTOR GM (3122 MAHAN DRIVE in TALLAHASSEE, FL)
STATE MASTER (FDM) - CHAZ-FLD981859762, HAZARDOUS WASTE REGULATION PROGRAM (Resource Conservation and Recovery Act (tracking hazardous waste)) Business SIC classification: AUTOMOTIVE DEALERS Organizations: WEAVER JIM (CONTACT/OWNER)
Alternative names: PROCTOR & PROCTOR INC
LEON HIGH SCHOOL (550 E TENNESSEE ST in TALLAHASSEE, FL)
(Geographic Names Information System) (National Center for Education Statistics) - STATE ID-0021 Organizations: LEON COUNTY SCHOOL DISTRICT (SCHOOL DISTRICT)
KATE SULLIVAN ELEMENTARY SCHOOL (927 MICCOSUKEE RD in TALLAHASSEE, FL)
(National Center for Education Statistics) - STATE ID-0031 Organizations: LEON COUNTY SCHOOL DISTRICT (SCHOOL DISTRICT)
CONCORD CUSTOM CLEANERS (2910 KERRY FOREST PKWY in TALLAHASSEE, FL)
AIR MINOR (AIRS/AFS) (Resource Conservation and Recovery Act (tracking hazardous waste)) Business SIC classification: DRYCLEANING PLANTS, EXCEPT RUG CLEANING Organizations: JOHN SCHACHT, DEALER (CONTACT/OWNER)
Alternative names: CONCORD CUSTOM CLEANERS #6019
PREAKNESS POINT (3003 THOMASVILLE ROAD in TALLAHASSEE, FL)
National Pollutant Discharge Elimination System NON-MAJOR (Tracking pollutant discharge elimination systems) - permit Organizations: CARLTON DEAN (CONTACT/OWNER)
MARLIN OFFICE FACILITY (3974 NORTH MONROE ST. in TALLAHASSEE, FL)
National Pollutant Discharge Elimination System NON-MAJOR (Tracking pollutant discharge elimination systems) - permit Organizations: THOMAS BALDWIN (CONTACT/OWNER)
SOUTHEASTERN DERMATOLOGY MEDIC (2040 FLEISCHMANN RD. in TALLAHASSEE, FL)
National Pollutant Discharge Elimination System NON-MAJOR (Tracking pollutant discharge elimination systems) - permit Organizations: CHERYL POOLE (CONTACT/OWNER)
SHAMROCK SOUTH OFFICES (SHAMROCK SOUTH & CAGNEY DR. in TALLAHASSEE, FL)
National Pollutant Discharge Elimination System NON-MAJOR (Tracking pollutant discharge elimination systems) - permit Organizations: CHERYL POOLE (CONTACT/OWNER)
RENCOHT CORPORATION (3185C CAPITAL CIRCLE NORTHEAST in TALLAHASSEE, FL)
AIR MINOR (AIRS/AFS) Small Quantity Generators, between 100 kg and 1000 kg of hazardous waste/month (Resource Conservation and Recovery Act (tracking hazardous waste)) Business SIC classification: DRYCLEANING PLANTS, EXCEPT RUG CLEANING Organizations: COTHREN RANDALL (CONTACT/OWNER)
Alternative names: CLS PRINTING, EAGLE CLEANERS
HERMITAGE OFFICES (HERMITAGE BLVD. in TALLAHASSEE, FL)
National Pollutant Discharge Elimination System NON-MAJOR (Tracking pollutant discharge elimination systems) - permit Organizations: CHERYL POOLE (CONTACT/OWNER)
ALEXIS CAPITAL COMMERCE CENTER (1725 CAPITAL CIR NE in TALLAHASSEE, FL)
National Pollutant Discharge Elimination System NON-MAJOR (Tracking pollutant discharge elimination systems) - permit Organizations: HAROLD PALMER (CONTACT/OWNER)
AMOCO SERVICE STATION #60219 (3539 THOMASVILLE RD in TALLAHASSEE, FL)
(Resource Conservation and Recovery Act (tracking hazardous waste)) Organizations: JT ULT ENT, DEALER (CONTACT/OWNER)
APALACHEE PARKWAY REGIONAL PAR (7550 APALACHEE PKWY in TALLAHASSEE, FL)
National Pollutant Discharge Elimination System NON-MAJOR (Tracking pollutant discharge elimination systems) - permit Organizations: TOMMY STRICKLAND (CONTACT/OWNER)
Housing units lacking complete kitchen facilities: 2.0%
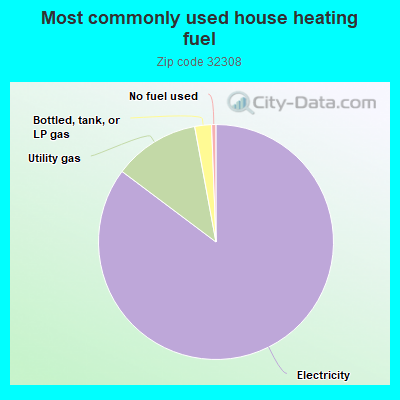
85.0%Electricity
11.8%Utility gas
2.3%Bottled, tank, or LP gas
0.6%No fuel used
Population in 1990: 34,857. Population change in the 1990s: +10,260 (+29.4%).
Place of birth for U.S.-born residents:
This state: 11,611
Northeast: 2,014
Midwest: 2,012
South: 4,448
West: 1,098
48% of the 32308 zip code residents lived in the same house 5 years ago. Out of people who lived in different houses, 53% lived in this county. Out of people who lived in different counties, 50% lived in Florida.
81% of the 32308 zip code residents lived in the same house 1 year ago. Out of people who lived in different houses, 56% moved from this county. Out of people who lived in different houses, 16% moved from different county within same state. Out of people who lived in different houses, 18% moved from different state. Out of people who lived in different houses, 4% moved from abroad.
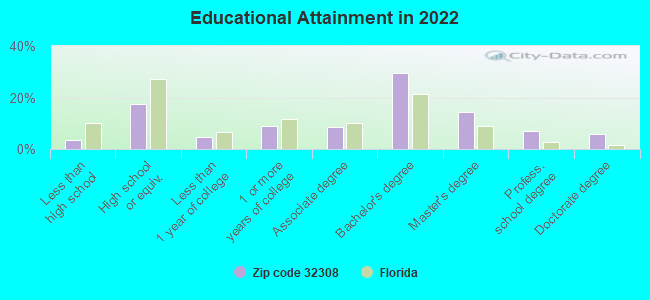
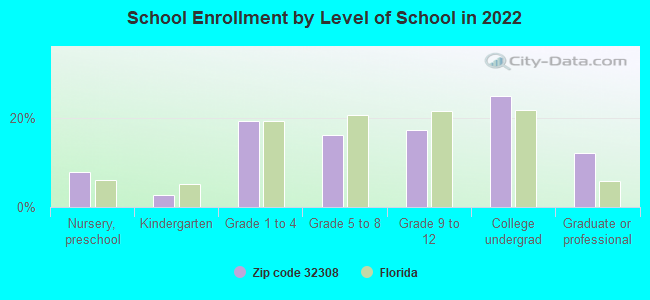
Private vs. public school enrollment:
Students in private schools in grades 1 to 8 (elementary and middle school): 517
Here:
27.9%
Florida:
15.8%
Students in private schools in grades 9 to 12 (high school): 108
Here:
12.0%
Florida:
12.9%
Students in private undergraduate colleges: 73
Here:
5.8%
Florida:
23.6%
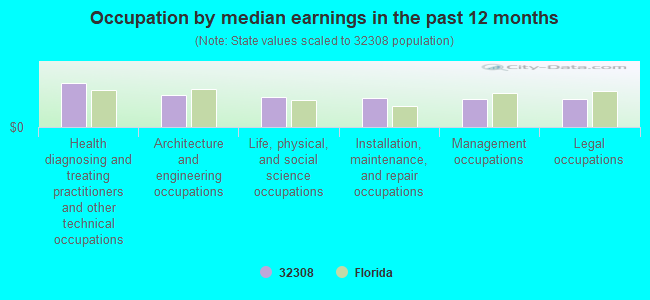
Occupation by median earnings in the past 12 months ($)
119,285Health diagnosing and treating practitioners and other technical occupations
87,791Architecture and engineering occupations
81,918Life, physical, and social science occupations
77,551Installation, maintenance, and repair occupations
76,776Management occupations
76,765Legal occupations
Companies with biggest federal contracts located in this zip code (TALLAHASSEE, FL):
ACISS SYSTEMS INC (2419 FLEISCHMANN RD STE 1; small business) : $683,885 in 2 contractsin 2004
$482,400 with Army for ADP Software. Signed on 2004-06-14. Completion date: 2007-01-27.
$201,485, same as above.Signed on 2004-01-28. Completion date: 2007-01-27.
ONE BOCA PLACE, INC. (1801 HERITG BLVD STE 100; small business) : $490,821 in 46 contractsfrom 2002 to 2006
Contracts for Lease or Rental of Facilities -- Office Buildings by Public Buildings Service Signed by year:2000: $0; 2001: $0; 2002: $8,314; 2003: $204,511; 2004: $31,671; 2005: $138,245; 2006: $108,080.
Biggest contracts:
$31,775 with Public Buildings Service for Lease or Rental of Facilities -- Office Buildings. Signed on 2003-09-15. Completion date: 2003-09-15.
$31,775, same as above.Signed on 2003-06-15. Completion date: 2003-06-15.
$10,808, same as above.Signed on 2006-07-01. Completion date: 2006-09-30.
$10,808, same as above.Signed on 2006-07-01. Completion date: 2006-09-30.
SATELLITE DATACOM SYSTEMS INC (3522 CASTLEBAR CIR; small business)
$146,152 with Army for Industrial Size Reduction Machinery. Signed on 2000-08-01. Completion date: 2000-09-28.
EDUCATIONAL LEARNING SYSTEMS, (2874 REMINGTON GREEN CIRCL) : $52,909 in 4 contractsfrom 2004 to 2005
$25,735 with Army for Education -- Management and Support (R&D). Taking place in GA. Signed on 2005-08-24. Completion date: 2005-08-31.
$20,455 with Army for ADP Software. Taking place in GA. Signed on 2004-07-22. Completion date: 2004-08-23.
$6,219 with Army for Education -- Management and Support (R&D). Taking place in GA. Signed on 2005-08-25. Completion date: 2005-09-16.
$500 with Army for ADP Software. Taking place in GA. Signed on 2004-07-30. Completion date: 2004-08-23.
TURTLE KING TRAILERS, INC (1708 CAPITAL CIRCLE NE)
$49,699 with Air Force for Lease or Rental of Equipment -- Ground Effect Vehicles, Motor Vehicles, Trailers, and Cycles. Signed on 2001-04-02. Completion date: 2001-03-20.
ESPOSITO NURSERY INC (2748 CAPITAL CIRCLE N E; small business) : $20,635 in 5 contractsfrom 2002 to 2005
Contracts for Landscaping/Groundskeeping Services by Navy Signed by year:2000: $0; 2001: $0; 2002: $4,905; 2003: $4,905; 2004: $4,905; 2005: $5,920; 2006: $0.
Biggest contracts:
$5,920 with Navy for Landscaping/Groundskeeping Services. Signed on 2005-03-17. Completion date: 2006-03-27.
$4,905, same as above.Signed on 2004-03-05. Completion date: 2005-03-26.
$4,905, same as above.Signed on 2003-03-17. Completion date: 2004-03-26.
$4,905, same as above.Signed on 2002-03-18. Completion date: 2003-03-26.
PROFESSIONAL BUILDING MAINTENA (2804 CAPITAL CIRCLE NE, SU; small business) : $13,023 in 2 contractsin 2002
$13,023 with Navy for Custodial Janitorial Services. Signed on 2002-03-28. Completion date: 2003-05-29.
$0, same as above.Signed on 2002-03-28. Completion date: 2003-05-29.
SOUTHERN WASTE INFORMATION EXC (1608 METROPOLITAN CIR STE; small business) : $8,900 in 3 contractsin 2005
$4,050 with U.S. Army Corps of Engineers - civil program financing only for Environmental Studies and Assessments. Signed on 2005-09-23. Completion date: 2005-10-17.
$4,050 with Army for Environmental Studies and Assessments. Signed on 2005-09-23. Completion date: 2005-10-17.
$800, same as above.Signed on 2005-10-31. Completion date: 2005-10-17.
SALONE CONSULTING GROUP INC (1400 METROPOLITAN BLVD STE; small business)
$2,140 with Army for ADP Components. Signed on 2003-03-06. Completion date: 2003-08-31.
TITZE MICHAEL CO (1906 BUFORD BLVD STE A; small business) : $282 in 2 contractsin 2004
$282 with Army for Miscellaneous Items. Signed on 2004-02-19. Completion date: 2003-01-05.
$0, same as above.Signed on 2004-02-19. Completion date: 2003-01-05.
Top industries in this zip code by the number of employees in 2005:
Health Care and Social Assistance: Offices of Physicians (except Mental Health Specialists) (250-499 employees: 1 establishment, 100-249 employees: 2 establishments, 50-99 employees: 7 establishments, 20-49 employees: 14 establishments, 10-19 employees: 19 establishments, 5-9 employees: 33 establishments, 1-4 employees: 55 establishments)
Health Care and Social Assistance: General Medical and Surgical Hospitals (over 1000: 1, 500-999: 1)
Administrative and Support and Waste Management and Remediation Services: Professional Employer Organizations (over 1000: 1)
2002 - 2018 National Fire Incident Reporting System (NFIRS) incidents
According to the data from the years 2002 - 2018 the average number of fire incidents per year is 90. The highest number of fire incidents - 184 took place in 2007, and the least - 6 in 2005. The data has a declining trend.
When looking into fire subcategories, the most reports belonged to: Outside Fires (47.2%), and Structure Fires (31.0%).
Fire incident types reported to NFIRS in Zip Code 32308

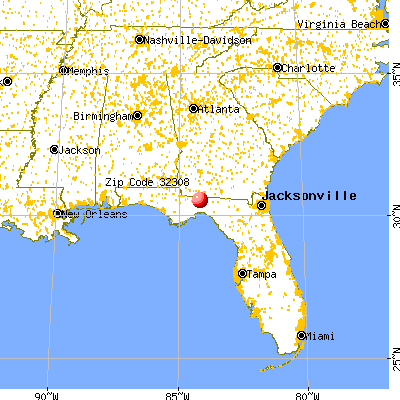


 Nearest zip codes: 32301, 32399, 32311, 32317, 32303, 32312.
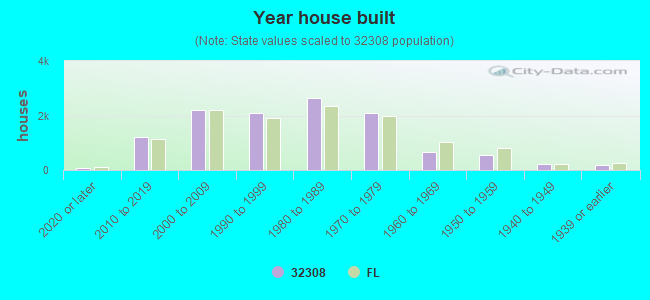


 According to the data from the years 2002 - 2018 the average number of fire incidents per year is 90. The highest number of fire incidents - 184 took place in 2007, and the least - 6 in 2005. The data has a declining trend.
 When looking into fire subcategories, the most reports belonged to: Outside Fires (47.2%), and Structure Fires (31.0%).