Estimated zip code population in 2022: 22,322 Zip code population in 2010: 21,441 Zip code population in 2000: 23,386
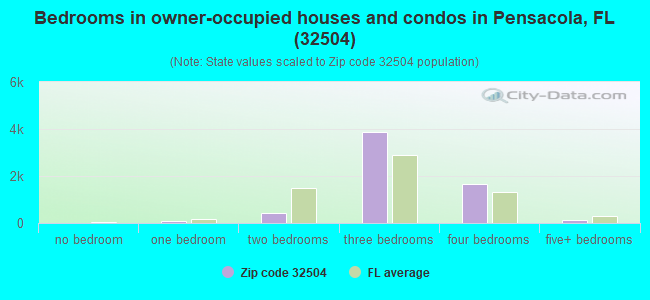
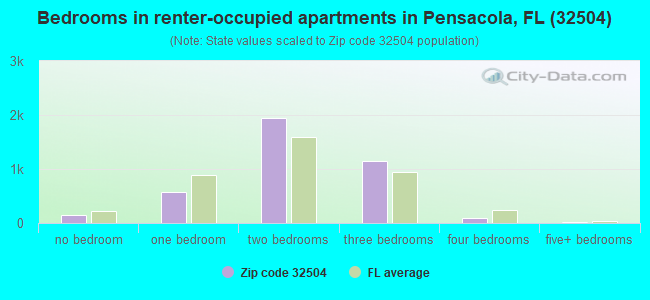
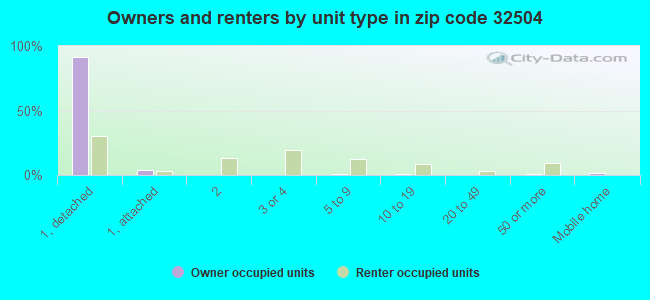
Houses and condos: 10,543 Renter-occupied apartments: 3,941
% of renters here:
39%
State:
33%
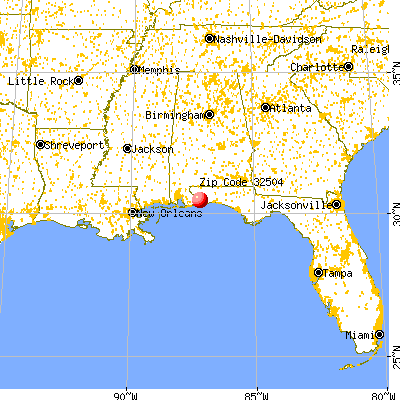
March 2022 cost of living index in zip code 32504: 85.7 (less than average, U.S. average is 100)
Land area: 10.7 sq. mi. Water area: 0.0 sq. mi.
Population density: 2,086 people per square mile
(low).
OSM Map
General Map
Google Map
MSN Map
OSM Map
General Map
Google Map
MSN Map
OSM Map
General Map
Google Map
MSN Map
OSM Map
General Map
Google Map
MSN Map
Please wait while loading the map...
Real estate property taxes paid for housing units in 2022:
This zip code:
0.6% ($1,711)
Florida:
0.7% ($2,529)
Median real estate property taxes paid for housing units with mortgages in 2022: $1,772 (0.6%) Median real estate property taxes paid for housing units with no mortgage in 2022: $1,648 (0.6%)
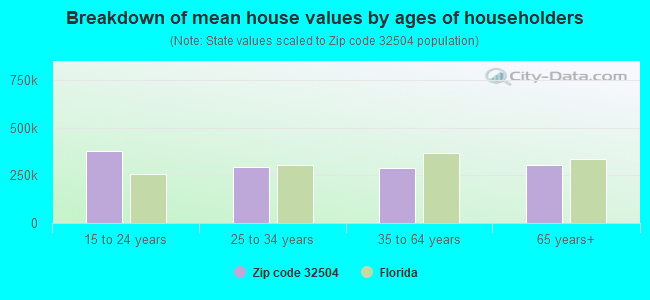
Estimated median house/condo value in 2022: $277,875
32504:
$277,875
Florida:
$354,100
According to our research of Florida and other state lists, there were 41 registered sex offenders living in 32504 zip code as of April 27, 2024. The ratio of all residents to sex offenders in zip code 32504 is 568 to 1. The ratio of registered sex offenders to all residents in this zip code is near the state average.
Median resident age:
This zip code:
39.6 years
Florida median age:
42.7 years
Average household size:
This zip code:
2.2 people
Florida:
2.5 people
Averages for the 2020 tax year for zip code 32504, filed in 2021:
Average Adjusted Gross Income (AGI) in 2020: $71,339 (Individual Income Tax Returns)
Here:
$71,339
State:
$82,200
Salary/wage: $55,064 (reported on 78.0% of returns)
Here:
$55,064
State:
$58,347
(% of AGI for various income ranges: 1199.5% for AGIs below $25k, 3574.2% for AGIs $25k-50k, 6390.6% for AGIs $50k-75k, 8924.6% for AGIs $75k-100k, 16245.5% for AGIs $100k-200k, 72161.1% for AGIs over 200k)
Taxable interest for individuals: $2,154 (reported on 32.8% of returns)
This zip code:
$2,154
Florida:
$4,272
(% of AGI for various income ranges: 15.3% for AGIs below $25k, 17.3% for AGIs $25k-50k, 77.9% for AGIs $50k-75k, 110.0% for AGIs $75k-100k, 227.3% for AGIs $100k-200k, 2278.3% for AGIs over 200k)
Ordinary dividends: $7,788 (reported on 20.3% of returns)
Here:
$7,788
State:
$15,863
(% of AGI for various income ranges: 26.2% for AGIs below $25k, 46.1% for AGIs $25k-50k, 139.5% for AGIs $50k-75k, 232.8% for AGIs $75k-100k, 576.3% for AGIs $100k-200k, 5083.3% for AGIs over 200k)
Net capital gain/loss in AGI: +$15,223 (reported on 18.8% of returns)
Here:
+$15,223
State:
+$62,983
(% of AGI for various income ranges: 9.1% for AGIs below $25k, 31.1% for AGIs $25k-50k, 84.6% for AGIs $50k-75k, 309.7% for AGIs $75k-100k, 1043.2% for AGIs $100k-200k, 11933.9% for AGIs over 200k)
Profit/loss from business: +$14,221 (reported on 15.8% of returns)
Here:
+$14,221
State:
+$9,719
(% of AGI for various income ranges: 125.9% for AGIs below $25k, 172.8% for AGIs $25k-50k, 235.3% for AGIs $50k-75k, 393.4% for AGIs $75k-100k, 652.1% for AGIs $100k-200k, 4623.9% for AGIs over 200k)
Taxable individual retirement arrangement distribution: $20,318 (reported on 10.5% of returns)
32504:
$20,318
Florida:
$24,823
(% of AGI for various income ranges: 52.7% for AGIs below $25k, 91.2% for AGIs $25k-50k, 235.8% for AGIs $50k-75k, 520.7% for AGIs $75k-100k, 1156.3% for AGIs $100k-200k, 3707.8% for AGIs over 200k)
Self-employed (Keogh) retirement plans: $29,220 (reported on 0.4% of returns)
32504:
$29,220
Florida:
$29,694
(% of AGI for various income ranges: 811.7% for AGIs over 200k)
Total itemized deductions: $45,017 (reported on 6.6% of returns)
Here:
$45,017
State:
$45,393
(% of AGI for various income ranges: 31.7% for AGIs below $25k, 80.0% for AGIs $25k-50k, 269.1% for AGIs $50k-75k, 453.1% for AGIs $75k-100k, 1208.2% for AGIs $100k-200k, 9471.7% for AGIs over 200k)
Charity contributions: $19,408 (reported on 4.3% of returns)
Here:
$19,408
State:
$20,178
(% of AGI for various income ranges: 11.5% for AGIs $25k-50k, 43.3% for AGIs $50k-75k, 96.9% for AGIs $75k-100k, 271.1% for AGIs $100k-200k, 3464.4% for AGIs over 200k)
Taxes paid: $5,562 (reported on 5.1% of returns)
32504:
$5,562
State:
$6,967
(% of AGI for various income ranges: 2.7% for AGIs below $25k, 5.5% for AGIs $25k-50k, 25.0% for AGIs $50k-75k, 50.8% for AGIs $75k-100k, 128.7% for AGIs $100k-200k, 842.2% for AGIs over 200k)
Earned income credit: $2,109 (reported on 16.0% of returns)
Here:
$2,109
State:
$2,306
(% of AGI for various income ranges: 88.4% for AGIs below $25k, 54.9% for AGIs $25k-50k, 1.4% for AGIs $50k-75k)
Percentage of individuals using paid preparers for their 2020 taxes: 91.7%
Here:
92%
State:
92%
(% for various income ranges: 91.6% for AGIs below $25k, 92.7% for AGIs $25k-50k, 91.6% for AGIs $50k-75k, 90.1% for AGIs $75k-100k, 91.4% for AGIs $100k-200k, 90.7% for AGIs over 200k)
Averages for the 2012 tax year for zip code 32504, filed in 2013:
Average Adjusted Gross Income (AGI) in 2012: $58,297 (Individual Income Tax Returns)
Here:
$58,297
State:
$60,316
Salary/wage: $47,613 (reported on 79.7% of returns)
Here:
$47,613
State:
$45,277
(% of AGI for various income ranges: 77.6% for AGIs below $25k, 75.3% for AGIs $25k-50k, 67.0% for AGIs $50k-75k, 62.5% for AGIs $75k-100k, 64.4% for AGIs $100k-200k, 56.4% for AGIs over 200k)
Taxable interest for individuals: $2,296 (reported on 35.3% of returns)
This zip code:
$2,296
Florida:
$3,587
(% of AGI for various income ranges: 1.0% for AGIs below $25k, 0.9% for AGIs $25k-50k, 1.2% for AGIs $50k-75k, 1.1% for AGIs $75k-100k, 1.3% for AGIs $100k-200k, 2.1% for AGIs over 200k)
Ordinary dividends: $5,646 (reported on 21.1% of returns)
Here:
$5,646
State:
$12,831
(% of AGI for various income ranges: 2.1% for AGIs below $25k, 1.3% for AGIs $25k-50k, 1.5% for AGIs $50k-75k, 2.1% for AGIs $75k-100k, 2.6% for AGIs $100k-200k, 2.3% for AGIs over 200k)
Net capital gain/loss in AGI: +$5,637 (reported on 16.8% of returns)
Here:
+$5,637
State:
+$33,493
(% of AGI for various income ranges: 0.1% for AGIs $25k-50k, 0.4% for AGIs $50k-75k, 1.0% for AGIs $75k-100k, 1.8% for AGIs $100k-200k, 3.7% for AGIs over 200k)
Profit/loss from business: +$13,438 (reported on 13.8% of returns)
Here:
+$13,438
State:
+$10,012
(% of AGI for various income ranges: 5.9% for AGIs below $25k, 1.3% for AGIs $25k-50k, 2.3% for AGIs $50k-75k, 2.8% for AGIs $75k-100k, 3.7% for AGIs $100k-200k, 3.5% for AGIs over 200k)
Taxable individual retirement arrangement distribution: $16,295 (reported on 12.1% of returns)
32504:
$16,295
Florida:
$21,544
(% of AGI for various income ranges: 2.8% for AGIs below $25k, 2.3% for AGIs $25k-50k, 2.9% for AGIs $50k-75k, 4.2% for AGIs $75k-100k, 5.0% for AGIs $100k-200k, 2.8% for AGIs over 200k)
Self-employment retirement plans: $25,167 (reported on 0.5% of returns)
32504:
$25,167
Florida:
$20,611
Total itemized deductions: $22,221 (17% of AGI, reported on 22.7% of returns)
Here:
$22,221
State:
$25,533
Here:
17.1% of AGI
State:
18.0% of AGI
(% of AGI for various income ranges: 6.6% for AGIs below $25k, 7.4% for AGIs $25k-50k, 8.9% for AGIs $50k-75k, 9.1% for AGIs $75k-100k, 9.7% for AGIs $100k-200k, 8.9% for AGIs over 200k)
Charity contributions: $5,896 (reported on 18.9% of returns)
Here:
$5,896
State:
$5,698
(% of AGI for various income ranges: 0.7% for AGIs below $25k, 1.0% for AGIs $25k-50k, 1.6% for AGIs $50k-75k, 2.1% for AGIs $75k-100k, 2.4% for AGIs $100k-200k, 2.5% for AGIs over 200k)
Taxes paid: $4,133 (reported on 22.4% of returns)
32504:
$4,133
State:
$6,203
(% of AGI for various income ranges: 0.9% for AGIs below $25k, 1.0% for AGIs $25k-50k, 1.5% for AGIs $50k-75k, 1.6% for AGIs $75k-100k, 2.1% for AGIs $100k-200k, 1.7% for AGIs over 200k)
Earned income credit: $2,143 (reported on 18.3% of returns)
Here:
$2,143
State:
$2,372
(% of AGI for various income ranges: 5.9% for AGIs below $25k, 0.8% for AGIs $25k-50k)
Percentage of individuals using paid preparers for their 2012 taxes: 40.8%
Here:
41%
State:
54%
(% for various income ranges: 35.9% for AGIs below $25k, 35.9% for AGIs $25k-50k, 43.5% for AGIs $50k-75k, 46.1% for AGIs $75k-100k, 55.0% for AGIs $100k-200k, 77.1% for AGIs over 200k)
Averages for the 2004 tax year for zip code 32504, filed in 2005:
Average Adjusted Gross Income (AGI) in 2004: $49,111 (Individual Income Tax Returns)
Here:
$49,111
State:
$50,523
Salary/wage: $39,718 (reported on 80.8% of returns)
Here:
$39,718
State:
$39,563
(% of AGI for various income ranges: 162.3% for AGIs below $10k, 75.2% for AGIs $10k-25k, 72.9% for AGIs $25k-50k, 68.7% for AGIs $50k-75k, 69.2% for AGIs $75k-100k, 55.1% for AGIs over 100k)
Taxable interest for individuals: $2,166 (reported on 46.0% of returns)
This zip code:
$2,166
Florida:
$3,211
(% of AGI for various income ranges: 6.6% for AGIs below $10k, 1.8% for AGIs $10k-25k, 1.8% for AGIs $25k-50k, 1.7% for AGIs $50k-75k, 1.7% for AGIs $75k-100k, 2.3% for AGIs over 100k)
Taxable dividends: $3,234 (reported on 26.9% of returns)
Here:
$3,234
State:
$6,129
(% of AGI for various income ranges: 6.2% for AGIs below $10k, 1.7% for AGIs $10k-25k, 1.4% for AGIs $25k-50k, 1.5% for AGIs $50k-75k, 1.9% for AGIs $75k-100k, 1.9% for AGIs over 100k)
Net capital gain/loss: +$10,254 (reported on 21.9% of returns)
Here:
+$10,254
State:
+$27,205
(% of AGI for various income ranges: -3.8% for AGIs below $10k, 0.2% for AGIs $10k-25k, 0.6% for AGIs $25k-50k, 1.1% for AGIs $50k-75k, 1.8% for AGIs $75k-100k, 9.6% for AGIs over 100k)
Profit/loss from business: +$16,714 (reported on 13.2% of returns)
Here:
+$16,714
State:
+$10,634
(% of AGI for various income ranges: 5.8% for AGIs below $10k, 3.2% for AGIs $10k-25k, 2.9% for AGIs $25k-50k, 3.1% for AGIs $50k-75k, 3.3% for AGIs $75k-100k, 6.3% for AGIs over 100k)
IRA payment deduction: $3,101 (reported on 2.9% of returns)
32504:
$3,101
Florida:
$3,082
(% of AGI for various income ranges: 0.6% for AGIs below $10k, 0.2% for AGIs $10k-25k, 0.3% for AGIs $25k-50k, 0.2% for AGIs $50k-75k, 0.2% for AGIs $75k-100k, 0.1% for AGIs over 100k)
Self-employed pension: $18,051 (reported on 0.9% of returns)
Here:
$18,051
Florida:
$15,857
(% of AGI for various income ranges: 0.1% for AGIs $25k-50k, 0.1% for AGIs $50k-75k, 0.2% for AGIs $75k-100k, 0.6% for AGIs over 100k)
Total itemized deductions: $19,997 (21% of AGI, reported on 28.7% of returns)
Here:
$19,997
State:
$20,370
Here:
21.0% of AGI
State:
20.7% of AGI
(% of AGI for various income ranges: 15.6% for AGIs below $10k, 8.1% for AGIs $10k-25k, 11.3% for AGIs $25k-50k, 13.6% for AGIs $50k-75k, 13.4% for AGIs $75k-100k, 11.3% for AGIs over 100k)
Charity contributions deductions: $5,348 (5% of AGI, reported on 24.5% of returns)
Here:
$5,348
State:
$4,064
Here:
5.3% of AGI
State:
3.8% of AGI
(% of AGI for various income ranges: 0.9% for AGIs below $10k, 0.9% for AGIs $10k-25k, 1.5% for AGIs $25k-50k, 2.2% for AGIs $50k-75k, 2.7% for AGIs $75k-100k, 3.7% for AGIs over 100k)
Total tax: $8,693 (reported on 76.1% of returns)
32504:
$8,693
State:
$9,431
(% of AGI for various income ranges: 4.1% for AGIs below $10k, 4.0% for AGIs $10k-25k, 7.6% for AGIs $25k-50k, 9.7% for AGIs $50k-75k, 11.2% for AGIs $75k-100k, 20.3% for AGIs over 100k)
Earned income credit: $1,713 (reported on 14.6% of returns)
Here:
$1,713
State:
$1,808
Percentage of individuals using paid preparers for their 2004 taxes: 49.3%
Here:
49%
State:
60%
(% for various income ranges: 42.0% for AGIs below $10k, 49.2% for AGIs $10k-25k, 50.4% for AGIs $25k-50k, 48.8% for AGIs $50k-75k, 50.3% for AGIs $75k-100k, 62.7% for AGIs over 100k)
Household received Food Stamps/SNAP in the past 12 months: 1,065 Household did not receive Food Stamps/SNAP in the past 12 months: 9,079
Women who had a birth in the past 12 months: 264 (176 now married, 87 unmarried) Women who did not have a birth in the past 12 months: 4,533 (1,538 now married, 2,994 unmarried)
Housing units in zip code 32504 with a mortgage: 3,743 (165 second mortgage, 131 both second mortgage and home equity loan) Houses without a mortgage: 130
Median monthly owner costs for units with a mortgage: $1,479 Median monthly owner costs for units without a mortgage: $590
Residents with income below the poverty level in 2022:
This zip code:
10.4%
Whole state:
12.7%
Residents with income below 50% of the poverty level in 2022:
This zip code:
4.4%
Whole state:
6.6%
Median number of rooms in houses and condos:
Here:
6.4
State:
5.9
Median number of rooms in apartments:
Here:
4.4
State:
4.2
Notable locations in this zip code not listed on our city pages
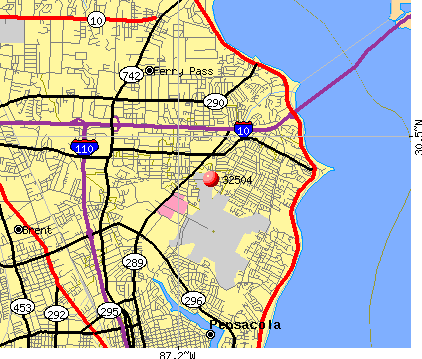
Notable locations in zip code 32504: Belvedere Park Plaza (A), Select Specialty Hospital (B), Lifeguard Ground Transportation Pensacola (C), Lifeguard Air Ambulance (D), Pensacola Fire Department Station 7 (E), Pensacola Fire Department Station 6 (F). Display/hide their locations on the map
Churches in zip code 32504 include: Ferry Pass Church (A), Science Bay Church (B), Pleasant Hill Baptist Church (C), Airport Boulevard Baptist Church (D), East Brent Baptist Church (E), Faith Church (F). Display/hide their locations on the map
In group quarters: 240 (-1 institutionalized population)
Size of family households: 3,155 2-persons, 1,269 3-persons, 879 4-persons, 346 5-persons, 129 6-persons, 5 7-or-more-persons
Size of nonfamily households: 3,415 1-person, 809 2-persons, 112 3-persons
2,141 married couples with children.
1,875 single-parent households (703 men, 1,172 women).
92.0% of residents of 32504 zip code speak English at home.
2.6% of residents speak Spanish at home (56% very well, 13% well, 32% not well).
3.0% of residents speak other Indo-European language at home (94% very well, 6% well).
1.5% of residents speak Asian or Pacific Island language at home (48% very well, 42% well, 10% not at all).
0.6% of residents speak other language at home (100% very well).
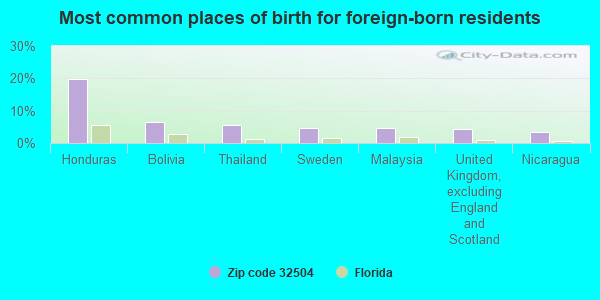
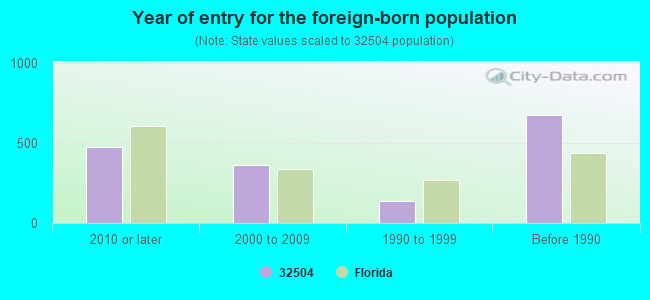
Foreign born population: 1,301 (5.8%) (54.3% of them are naturalized citizens)
Major facilities with environmental interests located in this zip code:
PACE CENTER FOR GIRLS/ESCAMIA-SANTA ROSA (1201 COLLEGE BLVD in PENSACOLA, FL)
(National Center for Education Statistics) - STATE ID-0206 Organizations: SANTA ROSA COUNTY SCHOOL DISTRICT (SCHOOL DISTRICT)
REINHARDT HOLM ELEMENTARY SCHOOL (6101 LANIER DR in PENSACOLA, FL)
(National Center for Education Statistics) - STATE ID-0602 Organizations: ESCAMBIA COUNTY SCHOOL DISTRICT (SCHOOL DISTRICT)
SCENIC HEIGHTS ELEMENTARY SCHOOL (3801 CHERRY LAUREL DR in PENSACOLA, FL)
(National Center for Education Statistics) - STATE ID-0461 Organizations: ESCAMBIA COUNTY SCHOOL DISTRICT (SCHOOL DISTRICT)
9TH AVE-COIN-O-MATIC (6220 N 9TH AVENUE in PENSACOLA, FL)
AIR MINOR (AIRS/AFS) (Resource Conservation and Recovery Act (tracking hazardous waste)) Business SIC classification: DRYCLEANING PLANTS, EXCEPT RUG CLEANING Organizations: NON NOTIFIED (CONTACT/OWNER)
Alternative names: 9TH AVE COIN O MATIC LAUNDROMAT
AEOLIAN PRINTING COMPANY (2812 W CERVANTES ST in PENSACOLA, FL)
(Resource Conservation and Recovery Act (tracking hazardous waste)) Organizations: NON NOTIFIER (CONTACT/OWNER)
AIRPORT-DAVIS PLAZA (NEC OF DAVIS HWY & AIRPORT BLV in PENSACOLA, FL)
National Pollutant Discharge Elimination System NON-MAJOR (Tracking pollutant discharge elimination systems) - permit Organizations: BRIAN GRASSA (CONTACT/OWNER)
AMOCO SERVICE STATION #60053 (6891 N 9TH AVE in PENSACOLA, FL)
GOODYEAR STORE #2272 (825 BURGESS RD in PENSACOLA, FL)
(Resource Conservation and Recovery Act (tracking hazardous waste)) Organizations: JOE SMERGLIA, PRINCIPAL ENG (CONTACT/OWNER)
GULF COAST OFFICE PRODUCTS (6020 ENTERPRISE DRIVE in PENSACOLA, FL)
National Pollutant Discharge Elimination System NON-MAJOR (Tracking pollutant discharge elimination systems) - permit Organizations: MARK WRIGHT (CONTACT/OWNER)
Alternative names: N.E. CONSTRUCTION LTD.
HEWLETT PACKARD CO (2114 AIRPORT BLVD #1500 in PENSACOLA, FL)
(Resource Conservation and Recovery Act (tracking hazardous waste)) Organizations: BILL ROBERTSON, CUST ENG (CONTACT/OWNER)
INNERLIGHT RETAIL UNITS (6307 N 9TH AVE in PENSACOLA, FL)
National Pollutant Discharge Elimination System NON-MAJOR (Tracking pollutant discharge elimination systems) - permit Organizations: J SLUTER (CONTACT/OWNER)
Housing units lacking complete plumbing facilities: 0.2% Housing units lacking complete kitchen facilities: 0.9%
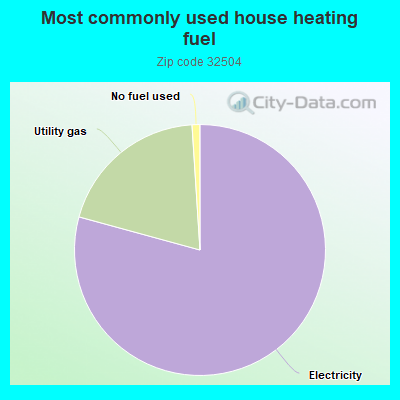
79.1%Electricity
19.7%Utility gas
1.0%No fuel used
Population in 1990: 23,077. Population change in the 1990s: +309 (+1.3%).
Place of birth for U.S.-born residents:
This state: 10,342
Northeast: 1,739
Midwest: 1,888
South: 5,426
West: 1,108
51% of the 32504 zip code residents lived in the same house 5 years ago. Out of people who lived in different houses, 50% lived in this county. Out of people who lived in different counties, 50% lived in Florida.
87% of the 32504 zip code residents lived in the same house 1 year ago. Out of people who lived in different houses, 46% moved from this county. Out of people who lived in different houses, 20% moved from different county within same state. Out of people who lived in different houses, 31% moved from different state. Out of people who lived in different houses, 1% moved from abroad.
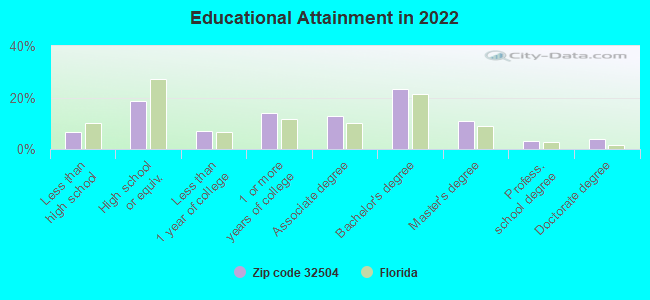
Private vs. public school enrollment:
Students in private schools in grades 1 to 8 (elementary and middle school): 479
Here:
25.6%
Florida:
15.8%
Students in private schools in grades 9 to 12 (high school): 173
Here:
19.5%
Florida:
12.9%
Students in private undergraduate colleges: 5
Here:
0.6%
Florida:
23.6%
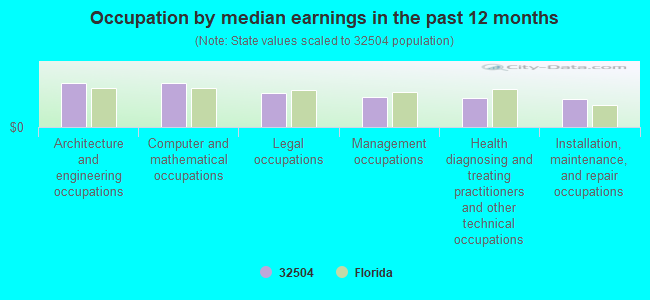
Occupation by median earnings in the past 12 months ($)
110,264Architecture and engineering occupations
109,904Computer and mathematical occupations
85,239Legal occupations
76,247Management occupations
72,498Health diagnosing and treating practitioners and other technical occupations
69,993Installation, maintenance, and repair occupations
Companies with biggest federal contracts located in this zip code (PENSACOLA, FL):
MINORITY SPECIALTY SERVICES IN (2401 EXECUTIVE PLAZA, SUIT; small business) : $16,864,740 in 306 contractsfrom 1999 to 2006
Contracts for Construction of Structures and Facilities -- Miscellaneous Buildings, Construction of Structures and Facilities -- Office Buildings, Maintenance, Repair or Alteration of Real Property -- Other Industrial Buildings, Maintenance, Repair or Alteration of Real Property -- Other Non-Building Facilities, and moreby Navy, Bureau of Prisoners/Federal Prison System, Air Force Signed by year:2000: $2,089,517; 2001: $3,026,271; 2002: $4,148,321; 2003: $1,585,560; 2004: $2,637,945; 2005: $2,582,999; 2006: $111,956.
Biggest contracts:
$1,915,926 with Navy for Construction of Structures and Facilities -- Miscellaneous Buildings. Signed on 2002-09-30. Completion date: 2004-03-24.
$1,381,681 with Navy for Construction of Structures and Facilities -- Office Buildings. Signed on 2004-09-24. Completion date: 2005-10-01.
$902,235 with Navy for Maintenance, Repair or Alteration of Real Property -- Other Industrial Buildings. Signed on 2002-10-31. Completion date: 2003-09-09.
$848,967 with Navy for Maintenance, Repair or Alteration of Real Property -- Other Non-Building Facilities. Signed on 2001-09-29. Completion date: 2002-06-30.
COX COMMUNICATIONS GULF COAST (2205 LA VISTA AVENUE) : $1,151,831 in 25 contractsfrom 2000 to 2006
Contracts for Telephone and/or Communications Services (includes Telegraph, Telex, and Cablevision Services), Other Utilities, Custodial Janitorial Services, Real Property Appraisals Services (SIC 6531), and moreby Air Force, Defense Finance and Accounting Service Signed by year:2000: $229,844; 2001: $185,879; 2002: $213,928; 2003: $98,928; 2004: $253,147; 2005: $155,022; 2006: $15,083.
Biggest contracts:
$137,710 with Air Force for Telephone and/or Communications Services (includes Telegraph, Telex, and Cablevision Services). Signed on 2004-12-07. Completion date: 2005-09-30.
$118,000, same as above.Signed on 2002-10-01. Completion date: 2003-09-30.
$113,536, same as above.Signed on 2005-10-01. Completion date: 2006-09-30.
$110,760, same as above.Signed on 2004-10-01. Completion date: 2005-09-30.
DISTRICT BD OF TRUSTEES OF (1000 COLLEGE BLVD) : $471,465 in 15 contractsfrom 2001 to 2006
Contracts for Tuition, Registration, and Membership Fees, Miscellaneous Items, Lease or Rental of Facilities -- Miscellaneous Buildings by Navy, Federal Emergency Management Agency Signed by year:2000: $0; 2001: $25,307; 2002: $106,673; 2003: $65,413; 2004: $59,461; 2005: $157,125; 2006: $57,486.
Biggest contracts:
$57,486 with Navy for Tuition, Registration, and Membership Fees. Signed on 2006-05-08. Completion date: 2006-08-07.
$42,250, same as above.Signed on 2005-12-16. Completion date: 2006-05-31.
$42,000, same as above.Signed on 2005-07-14. Completion date: 2005-12-20.
$41,800, same as above.Signed on 2002-11-26. Completion date: 2003-05-06.
TRI-STATE INVENTORY SERVICE (6201 DUNLIETH PLACE; small business) : $427,443 in 8 contractsfrom 2003 to 2005
Contracts for Material Handling Equipment, Nonself-Propelled, Other Management Support Services by Air Force, Defense Commissary Agency, Department of Defense Signed by year:2000: $0; 2001: $0; 2002: $0; 2003: $180,000; 2004: $233,174; 2005: $14,269; 2006: $0.
Biggest contracts:
$175,000 with Air Force for Material Handling Equipment, Nonself-Propelled. Signed on 2004-03-03. Completion date: 2004-06-12.
$150,000, same as above.Signed on 2003-02-07. Completion date: 2003-05-15.
$53,000, same as above.Signed on 2004-07-20. Completion date: 2004-09-30.
$30,000, same as above.Signed on 2003-06-23. Completion date: 2003-09-30.
ENGINEERED COOLING SERVICES, L (2442 EXECUTIVE PLAZA RD; small business) : $318,619 in 25 contractsfrom 2003 to 2005
Contracts for Maintenance, Repair or Alteration of Real Property -- Miscellaneous Buildings, Maintenance, Repair and Rebuilding of Equipment -- Refrigeration, Air Conditioning, and Air Circulating Equipment, , Refrigeration Equipment, and moreby Navy, Army, Air Force, National Oceanic and Atmospheric Administration/Under Secretary for Oceans and Atmosphere, and others Signed by year:2000: $0; 2001: $0; 2002: $0; 2003: $14,400; 2004: $190,791; 2005: $113,428; 2006: $0.
Biggest contracts:
$48,846 with Navy for Maintenance, Repair or Alteration of Real Property -- Miscellaneous Buildings. Signed on 2005-04-27. Completion date: 2005-06-13.
$39,108, same as above.Signed on 2004-06-16. Completion date: 2004-07-23.
$35,892, same as above.Signed on 2004-05-04. Completion date: 2004-06-14.
$28,905, same as above.Signed on 2005-07-13. Completion date: 2005-06-13.
CITY OF PENSACOLA (2430 AIRPORT BLVD.) : $239,922 in 34 contractsfrom 2003 to 2006
Contracts for Lease or Rental of Facilities -- Office Buildings by Public Buildings Service Signed by year:2000: $0; 2001: $0; 2002: $0; 2003: $133,056; 2004: $17,811; 2005: $53,433; 2006: $35,622.
Biggest contracts:
$36,072 with Public Buildings Service for Lease or Rental of Facilities -- Office Buildings. Signed on 2003-06-15. Completion date: 2003-06-15.
$16,164, same as above.Signed on 2003-09-15. Completion date: 2003-09-15.
$16,164, same as above.Signed on 2003-06-15. Completion date: 2003-06-15.
$5,937, same as above.Signed on 2006-04-01. Completion date: 2006-09-30.
MICHAEL R AMBROSE, MD, MPH (2315 MALYSA PLACE; small business) : $234,700 in 2 contractsin 2002
$176,600 with Navy for General Health Care Services. Signed on 2002-10-01. Completion date: 2002-09-30.
$58,100, same as above.Signed on 2002-04-25. Completion date: 2002-09-30.
CORE SERVICES SOUTHEAST INC (826 CREIGHTON RD. B-100; small business) : $198,943 in 3 contractsfrom 2000 to 2001
$117,932 with Air Force for Cabinets, Lockers, Bins, and Shelving. Signed on 2000-09-23. Completion date: 2000-11-30.
$53,911 with Army for Construction of Structures and Facilities -- Miscellaneous Buildings. Taking place in NC. Signed on 2001-07-18. Completion date: 2001-08-20.
$27,100 with Air Force for Miscellaneous Prefabricated Structures. Taking place in TX. Signed on 2000-09-30. Completion date: 2000-11-30.
NINTH AVENUE OFFICE PLAZA (6706 N. NINTH AVE.; small business) : $98,000 in 17 contractsfrom 2004 to 2006
Contracts for Lease or Rental of Facilities -- Office Buildings by Public Buildings Service Signed by year:2000: $0; 2001: $0; 2002: $0; 2003: $0; 2004: $14,000; 2005: $42,000; 2006: $42,000.
Biggest contracts:
$7,000 with Public Buildings Service for Lease or Rental of Facilities -- Office Buildings. Signed on 2006-04-01. Completion date: 2006-09-30.
$7,000, same as above.Signed on 2006-07-01. Completion date: 2006-09-30.
$7,000, same as above.Signed on 2006-04-01. Completion date: 2006-09-30.
$7,000, same as above.Signed on 2006-07-01. Completion date: 2006-09-30.
KATONA, BECKY (6160 ARBUTUS DRIVE; small business) : $85,830 in 7 contractsfrom 2004 to 2006
Contracts for Electrical Hardware and Supplies, Electrical Insulators and Insulating Materials, Hose and Flexible Tubing, Screws, and moreby Navy, Defense Logistics Agency Signed by year:2000: $0; 2001: $0; 2002: $0; 2003: $0; 2004: $38,764; 2005: $40,058; 2006: $7,008.
Biggest contracts:
$31,536 with Navy for Electrical Hardware and Supplies. Signed on 2005-09-28. Completion date: 2005-11-16.
$20,706 with Defense Logistics Agency for Electrical Insulators and Insulating Materials. Signed on 2004-10-04. Completion date: 2004-11-23.
$9,933 with Defense Logistics Agency for Hose and Flexible Tubing. Signed on 2004-11-22. Completion date: 2005-01-02.
$8,125 with Defense Logistics Agency for Screws. Signed on 2004-10-29. Completion date: 2004-12-29.
Top industries in this zip code by the number of employees in 2005:
Administrative and Support and Waste Management and Remediation Services: Temporary Help Services (500-999 employees: 1 establishment, 100-249 employees: 4 establishments, 50-99 employees: 2 establishments, 20-49 employees: 2 establishments, 10-19 employees: 1 establishment, 5-9 employees: 1 establishment)
Health Care and Social Assistance: General Medical and Surgical Hospitals (over 1000: 1)
Health Care and Social Assistance: Offices of Physicians (except Mental Health Specialists) (100-249: 1, 50-99: 2, 20-49: 6, 10-19: 7, 5-9: 15, 1-4: 16)
Health Care and Social Assistance: All Other Outpatient Care Centers (500-999: 1, 1-4: 1)
Accommodation and Food Services: Hotels (except Casino Hotels) and Motels (100-249: 1, 20-49: 8, 10-19: 1, 1-4: 1)
People in group quarters in 2010:
116 people in nursing facilities/skilled-nursing facilities
32 people in group homes intended for adults
4 people in group homes for juveniles (non-correctional)
People in group quarters in 2000:
19 people in homes for the mentally ill
13 people in other noninstitutional group quarters
10 people in homes for the physically handicapped
Fatal accident statistics in 2014:
Fatal accident count: 2
Vehicles involved in fatal accidents: 4
Fatal accidents caused by drunken drivers: 0
Fatalities: 2
Persons involved in fatal accidents: 3
Pedestrians involved in fatal accidents: 1
Fatal accident statistics in 2013:
Fatal accident count: 1
Vehicles involved in fatal accidents: 1
Fatal accidents caused by drunken drivers: 1
Fatalities: 1
Persons involved in fatal accidents: 1
Pedestrians involved in fatal accidents: 1
Home Mortgage Disclosure Act Aggregated Statistics For Year 2009 (Based on 4 full and 8 partial tracts)
A) FHA, FSA/RHS & VA Home Purchase Loans
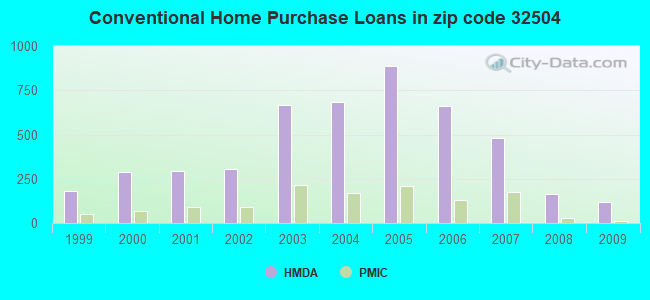
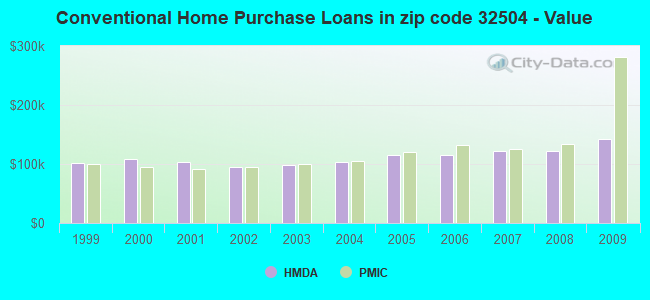
B) Conventional Home Purchase Loans
C) Refinancings
D) Home Improvement Loans
F) Non-occupant Loans on < 5 Family Dwellings (A B C & D)
G) Loans On Manufactured Home Dwelling (A B C & D)
Number
Average Value
Number
Average Value
Number
Average Value
Number
Average Value
Number
Average Value
Number
Average Value
LOANS ORIGINATED
219
$121,767
119
$142,194
359
$127,614
31
$37,752
59
$100,689
2
$168,570
APPLICATIONS APPROVED, NOT ACCEPTED
9
$140,882
5
$86,840
38
$126,035
3
$52,543
9
$74,186
0
$0
APPLICATIONS DENIED
21
$158,779
21
$92,129
168
$135,539
17
$36,926
15
$102,770
5
$58,570
APPLICATIONS WITHDRAWN
24
$130,370
9
$160,653
118
$142,241
3
$46,133
17
$98,414
0
$0
FILES CLOSED FOR INCOMPLETENESS
10
$124,636
3
$83,337
30
$122,097
2
$9,920
3
$127,867
0
$0
Aggregated Statistics For Year 2008 (Based on 4 full and 8 partial tracts)
A) FHA, FSA/RHS & VA Home Purchase Loans
B) Conventional Home Purchase Loans
C) Refinancings
D) Home Improvement Loans
E) Loans on Dwellings For 5+ Families
F) Non-occupant Loans on < 5 Family Dwellings (A B C & D)
G) Loans On Manufactured Home Dwelling (A B C & D)
Number
Average Value
Number
Average Value
Number
Average Value
Number
Average Value
Number
Average Value
Number
Average Value
Number
Average Value
LOANS ORIGINATED
172
$122,455
162
$121,244
256
$124,226
50
$55,689
0
$0
82
$83,700
3
$90,183
APPLICATIONS APPROVED, NOT ACCEPTED
9
$117,734
17
$113,159
50
$127,186
7
$42,426
0
$0
16
$93,108
2
$69,865
APPLICATIONS DENIED
24
$104,659
45
$93,909
254
$128,861
33
$49,348
0
$0
48
$103,718
5
$40,376
APPLICATIONS WITHDRAWN
19
$116,134
34
$254,989
98
$124,889
4
$52,420
1
$8,074,880
25
$85,513
0
$0
FILES CLOSED FOR INCOMPLETENESS
2
$166,045
8
$212,255
22
$109,925
0
$0
0
$0
5
$91,364
0
$0
Aggregated Statistics For Year 2007 (Based on 4 full and 8 partial tracts)
A) FHA, FSA/RHS & VA Home Purchase Loans
B) Conventional Home Purchase Loans
C) Refinancings
D) Home Improvement Loans
E) Loans on Dwellings For 5+ Families
F) Non-occupant Loans on < 5 Family Dwellings (A B C & D)
G) Loans On Manufactured Home Dwelling (A B C & D)
Number
Average Value
Number
Average Value
Number
Average Value
Number
Average Value
Number
Average Value
Number
Average Value
Number
Average Value
LOANS ORIGINATED
100
$123,231
483
$122,381
501
$118,732
78
$59,678
2
$2,381,040
140
$101,687
2
$79,040
APPLICATIONS APPROVED, NOT ACCEPTED
9
$72,368
53
$102,502
131
$120,542
18
$53,958
0
$0
28
$85,604
0
$0
APPLICATIONS DENIED
9
$139,511
101
$114,021
312
$136,321
77
$63,078
1
$8,811,440
47
$95,165
1
$63,340
APPLICATIONS WITHDRAWN
8
$122,418
57
$120,493
257
$138,486
25
$63,801
0
$0
20
$103,686
0
$0
FILES CLOSED FOR INCOMPLETENESS
0
$0
16
$115,229
68
$134,346
8
$81,892
0
$0
7
$114,629
0
$0
Aggregated Statistics For Year 2006 (Based on 4 full and 8 partial tracts)
A) FHA, FSA/RHS & VA Home Purchase Loans
B) Conventional Home Purchase Loans
C) Refinancings
D) Home Improvement Loans
E) Loans on Dwellings For 5+ Families
F) Non-occupant Loans on < 5 Family Dwellings (A B C & D)
G) Loans On Manufactured Home Dwelling (A B C & D)
Number
Average Value
Number
Average Value
Number
Average Value
Number
Average Value
Number
Average Value
Number
Average Value
Number
Average Value
LOANS ORIGINATED
104
$126,985
662
$115,632
714
$116,256
121
$61,877
2
$5,242,230
206
$105,123
6
$67,777
APPLICATIONS APPROVED, NOT ACCEPTED
6
$127,332
108
$96,601
124
$112,914
12
$71,437
0
$0
29
$99,619
3
$16,163
APPLICATIONS DENIED
12
$112,420
131
$109,087
387
$118,782
98
$50,250
3
$292,867
56
$81,825
20
$45,848
APPLICATIONS WITHDRAWN
16
$106,464
99
$120,300
377
$121,455
24
$81,401
0
$0
49
$108,102
1
$40,000
FILES CLOSED FOR INCOMPLETENESS
4
$130,335
27
$102,262
84
$132,349
9
$73,154
0
$0
19
$118,095
0
$0
Aggregated Statistics For Year 2005 (Based on 4 full and 8 partial tracts)
A) FHA, FSA/RHS & VA Home Purchase Loans
B) Conventional Home Purchase Loans
C) Refinancings
D) Home Improvement Loans
E) Loans on Dwellings For 5+ Families
F) Non-occupant Loans on < 5 Family Dwellings (A B C & D)
G) Loans On Manufactured Home Dwelling (A B C & D)
Number
Average Value
Number
Average Value
Number
Average Value
Number
Average Value
Number
Average Value
Number
Average Value
Number
Average Value
LOANS ORIGINATED
84
$122,404
885
$114,876
893
$112,243
139
$49,183
5
$1,374,336
404
$91,623
0
$0
APPLICATIONS APPROVED, NOT ACCEPTED
4
$65,975
96
$111,589
119
$110,956
14
$47,777
0
$0
29
$97,588
7
$43,834
APPLICATIONS DENIED
11
$143,477
115
$93,169
394
$116,101
77
$43,572
0
$0
58
$92,375
7
$40,309
APPLICATIONS WITHDRAWN
8
$141,439
170
$103,353
503
$112,598
59
$105,058
0
$0
70
$97,794
2
$95,240
FILES CLOSED FOR INCOMPLETENESS
1
$57,230
17
$119,052
71
$171,842
3
$96,700
0
$0
8
$110,504
0
$0
Aggregated Statistics For Year 2004 (Based on 4 full and 8 partial tracts)
A) FHA, FSA/RHS & VA Home Purchase Loans
B) Conventional Home Purchase Loans
C) Refinancings
D) Home Improvement Loans
E) Loans on Dwellings For 5+ Families
F) Non-occupant Loans on < 5 Family Dwellings (A B C & D)
G) Loans On Manufactured Home Dwelling (A B C & D)
Number
Average Value
Number
Average Value
Number
Average Value
Number
Average Value
Number
Average Value
Number
Average Value
Number
Average Value
LOANS ORIGINATED
95
$101,762
683
$103,428
647
$90,352
85
$50,670
2
$639,950
298
$78,922
2
$92,270
APPLICATIONS APPROVED, NOT ACCEPTED
12
$126,929
84
$95,672
139
$94,948
12
$61,552
0
$0
36
$88,703
2
$37,180
APPLICATIONS DENIED
21
$87,492
106
$94,179
381
$92,497
88
$26,177
0
$0
46
$84,669
18
$59,471
APPLICATIONS WITHDRAWN
11
$128,063
76
$100,233
351
$99,464
16
$58,816
0
$0
32
$101,094
0
$0
FILES CLOSED FOR INCOMPLETENESS
2
$185,350
17
$93,899
67
$96,091
6
$77,960
0
$0
5
$91,552
0
$0
Aggregated Statistics For Year 2003 (Based on 4 full and 8 partial tracts)
A) FHA, FSA/RHS & VA Home Purchase Loans
B) Conventional Home Purchase Loans
C) Refinancings
D) Home Improvement Loans
E) Loans on Dwellings For 5+ Families
F) Non-occupant Loans on < 5 Family Dwellings (A B C & D)
Number
Average Value
Number
Average Value
Number
Average Value
Number
Average Value
Number
Average Value
Number
Average Value
LOANS ORIGINATED
161
$92,659
664
$97,855
1,471
$89,703
66
$30,183
4
$14,565,465
262
$69,551
APPLICATIONS APPROVED, NOT ACCEPTED
10
$93,663
75
$100,922
204
$87,753
9
$23,894
0
$0
24
$88,342
APPLICATIONS DENIED
13
$79,944
94
$110,927
535
$82,685
53
$25,511
1
$115,210
71
$88,502
APPLICATIONS WITHDRAWN
14
$104,852
61
$94,030
335
$98,366
11
$43,650
2
$102,865
59
$87,664
FILES CLOSED FOR INCOMPLETENESS
6
$85,307
16
$140,393
47
$105,292
8
$31,841
0
$0
4
$118,180
Aggregated Statistics For Year 2002 (Based on 2 full and 6 partial tracts)
A) FHA, FSA/RHS & VA Home Purchase Loans
B) Conventional Home Purchase Loans
C) Refinancings
D) Home Improvement Loans
E) Loans on Dwellings For 5+ Families
F) Non-occupant Loans on < 5 Family Dwellings (A B C & D)
Number
Average Value
Number
Average Value
Number
Average Value
Number
Average Value
Number
Average Value
Number
Average Value
LOANS ORIGINATED
78
$95,395
305
$95,044
449
$110,925
35
$26,728
2
$346,185
104
$71,084
APPLICATIONS APPROVED, NOT ACCEPTED
2
$84,100
26
$86,003
76
$100,743
4
$13,308
0
$0
18
$77,339
APPLICATIONS DENIED
8
$79,900
34
$86,287
162
$82,892
23
$39,945
0
$0
36
$88,015
APPLICATIONS WITHDRAWN
3
$91,957
30
$85,637
107
$89,279
4
$31,858
0
$0
16
$71,713
FILES CLOSED FOR INCOMPLETENESS
2
$78,140
7
$99,449
37
$88,748
1
$32,740
0
$0
5
$81,408
Aggregated Statistics For Year 2001 (Based on 2 full and 6 partial tracts)
A) FHA, FSA/RHS & VA Home Purchase Loans
B) Conventional Home Purchase Loans
C) Refinancings
D) Home Improvement Loans
E) Loans on Dwellings For 5+ Families
F) Non-occupant Loans on < 5 Family Dwellings (A B C & D)
Number
Average Value
Number
Average Value
Number
Average Value
Number
Average Value
Number
Average Value
Number
Average Value
LOANS ORIGINATED
93
$84,691
293
$102,896
366
$92,342
41
$23,540
1
$7,510,750
87
$58,713
APPLICATIONS APPROVED, NOT ACCEPTED
7
$90,203
22
$109,739
51
$73,143
3
$39,900
0
$0
7
$51,453
APPLICATIONS DENIED
6
$66,907
33
$52,357
171
$72,576
26
$18,263
0
$0
8
$43,762
APPLICATIONS WITHDRAWN
13
$85,798
21
$74,598
121
$80,016
12
$21,008
0
$0
13
$46,293
FILES CLOSED FOR INCOMPLETENESS
0
$0
9
$62,324
27
$83,796
0
$0
0
$0
7
$70,429
Aggregated Statistics For Year 2000 (Based on 2 full and 6 partial tracts)
A) FHA, FSA/RHS & VA Home Purchase Loans
B) Conventional Home Purchase Loans
C) Refinancings
D) Home Improvement Loans
F) Non-occupant Loans on < 5 Family Dwellings (A B C & D)
Number
Average Value
Number
Average Value
Number
Average Value
Number
Average Value
Number
Average Value
LOANS ORIGINATED
92
$85,056
289
$108,899
101
$66,097
52
$20,557
44
$62,919
APPLICATIONS APPROVED, NOT ACCEPTED
18
$76,273
57
$85,818
36
$68,233
21
$17,536
11
$65,175
APPLICATIONS DENIED
7
$95,304
110
$63,029
105
$52,936
21
$28,450
11
$49,703
APPLICATIONS WITHDRAWN
10
$55,109
23
$104,883
53
$62,135
8
$37,041
8
$58,900
FILES CLOSED FOR INCOMPLETENESS
3
$81,487
6
$77,540
18
$84,067
2
$31,420
0
$0
Aggregated Statistics For Year 1999 (Based on 1 full and 4 partial tracts)
A) FHA, FSA/RHS & VA Home Purchase Loans
B) Conventional Home Purchase Loans
C) Refinancings
D) Home Improvement Loans
E) Loans on Dwellings For 5+ Families
F) Non-occupant Loans on < 5 Family Dwellings (A B C & D)
2002 - 2018 National Fire Incident Reporting System (NFIRS) incidents
Based on the data from the years 2002 - 2018 the average number of fire incidents per year is 61. The highest number of fires - 102 took place in 2017, and the least - 37 in 2016. The data has an increasing trend.
When looking into fire subcategories, the most incidents belonged to: Outside Fires (44.6%), and Structure Fires (36.6%).
Fire incident types reported to NFIRS in Zip Code 32504


 Nearest zip codes: 32503, 32501, 32514, 32502, 32505, 32534.


 Based on the data from the years 2002 - 2018 the average number of fire incidents per year is 61. The highest number of fires - 102 took place in 2017, and the least - 37 in 2016. The data has an increasing trend.
 When looking into fire subcategories, the most incidents belonged to: Outside Fires (44.6%), and Structure Fires (36.6%).