Estimated zip code population in 2022: 34,830 Zip code population in 2010: 32,011 Zip code population in 2000: 33,097
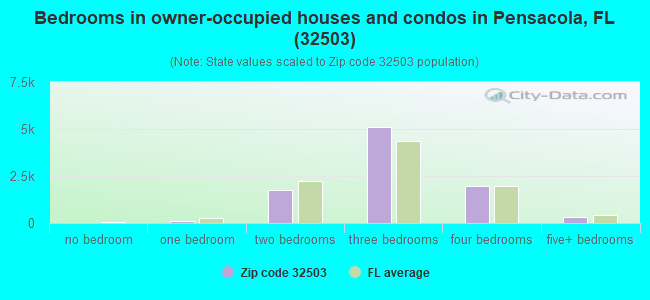
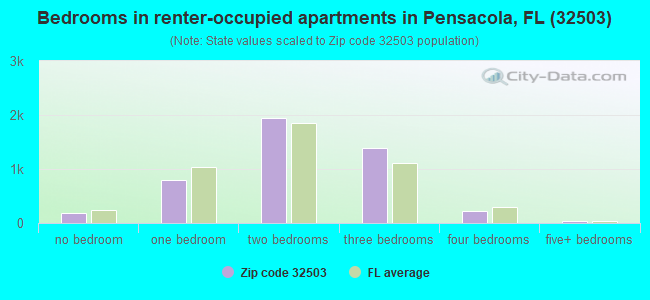
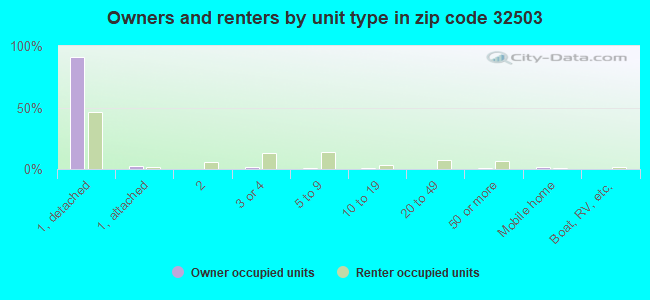
Houses and condos: 15,242 Renter-occupied apartments: 4,587
% of renters here:
33%
State:
33%
March 2022 cost of living index in zip code 32503: 85.9 (less than average, U.S. average is 100)
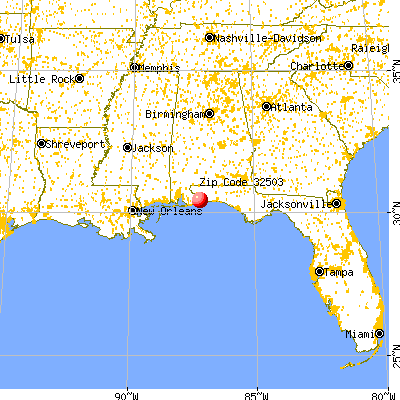
Land area: 12.3 sq. mi. Water area: 0.6 sq. mi.
Population density: 2,831 people per square mile
(average).
OSM Map
General Map
Google Map
MSN Map
OSM Map
General Map
Google Map
MSN Map
OSM Map
General Map
Google Map
MSN Map
OSM Map
General Map
Google Map
MSN Map
Please wait while loading the map...
Real estate property taxes paid for housing units in 2022:
This zip code:
0.5% ($1,360)
Florida:
0.7% ($2,529)
Median real estate property taxes paid for housing units with mortgages in 2022: $1,569 (0.5%) Median real estate property taxes paid for housing units with no mortgage in 2022: $1,057 (0.4%)
Averages for the 2020 tax year for zip code 32503, filed in 2021:
Average Adjusted Gross Income (AGI) in 2020: $70,043 (Individual Income Tax Returns)
Here:
$70,043
State:
$82,200
Salary/wage: $55,626 (reported on 79.3% of returns)
Here:
$55,626
State:
$58,347
(% of AGI for various income ranges: 1165.0% for AGIs below $25k, 3549.1% for AGIs $25k-50k, 6349.2% for AGIs $50k-75k, 9401.9% for AGIs $75k-100k, 18465.1% for AGIs $100k-200k, 80208.9% for AGIs over 200k)
Taxable interest for individuals: $2,397 (reported on 30.7% of returns)
This zip code:
$2,397
Florida:
$4,272
(% of AGI for various income ranges: 13.0% for AGIs below $25k, 19.7% for AGIs $25k-50k, 38.3% for AGIs $50k-75k, 110.9% for AGIs $75k-100k, 228.6% for AGIs $100k-200k, 2580.7% for AGIs over 200k)
Ordinary dividends: $9,340 (reported on 19.9% of returns)
Here:
$9,340
State:
$15,863
(% of AGI for various income ranges: 22.5% for AGIs below $25k, 40.5% for AGIs $25k-50k, 104.5% for AGIs $50k-75k, 288.7% for AGIs $75k-100k, 696.3% for AGIs $100k-200k, 6356.7% for AGIs over 200k)
Net capital gain/loss in AGI: +$24,297 (reported on 18.4% of returns)
Here:
+$24,297
State:
+$62,983
(% of AGI for various income ranges: 12.6% for AGIs below $25k, 40.1% for AGIs $25k-50k, 84.8% for AGIs $50k-75k, 291.9% for AGIs $75k-100k, 1124.9% for AGIs $100k-200k, 20241.1% for AGIs over 200k)
Profit/loss from business: +$14,922 (reported on 16.1% of returns)
Here:
+$14,922
State:
+$9,719
(% of AGI for various income ranges: 119.8% for AGIs below $25k, 149.1% for AGIs $25k-50k, 243.0% for AGIs $50k-75k, 429.4% for AGIs $75k-100k, 902.6% for AGIs $100k-200k, 4933.3% for AGIs over 200k)
Taxable individual retirement arrangement distribution: $21,739 (reported on 8.6% of returns)
32503:
$21,739
Florida:
$24,823
(% of AGI for various income ranges: 31.9% for AGIs below $25k, 82.8% for AGIs $25k-50k, 218.8% for AGIs $50k-75k, 435.9% for AGIs $75k-100k, 1183.8% for AGIs $100k-200k, 3298.5% for AGIs over 200k)
Self-employed (Keogh) retirement plans: $20,722 (reported on 0.6% of returns)
32503:
$20,722
Florida:
$29,694
(% of AGI for various income ranges: 77.9% for AGIs $100k-200k, 442.6% for AGIs over 200k)
Total itemized deductions: $37,930 (reported on 7.6% of returns)
Here:
$37,930
State:
$45,393
(% of AGI for various income ranges: 34.5% for AGIs below $25k, 119.4% for AGIs $25k-50k, 302.7% for AGIs $50k-75k, 611.7% for AGIs $75k-100k, 1297.0% for AGIs $100k-200k, 7495.6% for AGIs over 200k)
Charity contributions: $14,493 (reported on 4.9% of returns)
Here:
$14,493
State:
$20,178
(% of AGI for various income ranges: 1.9% for AGIs below $25k, 13.9% for AGIs $25k-50k, 48.0% for AGIs $50k-75k, 93.6% for AGIs $75k-100k, 269.8% for AGIs $100k-200k, 2560.7% for AGIs over 200k)
Taxes paid: $5,994 (reported on 5.8% of returns)
32503:
$5,994
State:
$6,967
(% of AGI for various income ranges: 2.1% for AGIs below $25k, 9.6% for AGIs $25k-50k, 27.8% for AGIs $50k-75k, 68.1% for AGIs $75k-100k, 155.8% for AGIs $100k-200k, 1048.1% for AGIs over 200k)
Earned income credit: $2,331 (reported on 18.7% of returns)
Here:
$2,331
State:
$2,306
(% of AGI for various income ranges: 110.7% for AGIs below $25k, 57.8% for AGIs $25k-50k)
Percentage of individuals using paid preparers for their 2020 taxes: 91.6%
Here:
92%
State:
92%
(% for various income ranges: 91.2% for AGIs below $25k, 92.7% for AGIs $25k-50k, 91.1% for AGIs $50k-75k, 91.5% for AGIs $75k-100k, 91.1% for AGIs $100k-200k, 92.2% for AGIs over 200k)
Averages for the 2012 tax year for zip code 32503, filed in 2013:
Average Adjusted Gross Income (AGI) in 2012: $55,922 (Individual Income Tax Returns)
Here:
$55,922
State:
$60,316
Salary/wage: $43,497 (reported on 80.4% of returns)
Here:
$43,497
State:
$45,277
(% of AGI for various income ranges: 76.6% for AGIs below $25k, 77.0% for AGIs $25k-50k, 67.7% for AGIs $50k-75k, 67.6% for AGIs $75k-100k, 64.6% for AGIs $100k-200k, 45.7% for AGIs over 200k)
Taxable interest for individuals: $2,581 (reported on 30.9% of returns)
This zip code:
$2,581
Florida:
$3,587
(% of AGI for various income ranges: 1.1% for AGIs below $25k, 0.8% for AGIs $25k-50k, 0.9% for AGIs $50k-75k, 0.9% for AGIs $75k-100k, 1.1% for AGIs $100k-200k, 2.5% for AGIs over 200k)
Ordinary dividends: $7,947 (reported on 18.3% of returns)
Here:
$7,947
State:
$12,831
(% of AGI for various income ranges: 1.8% for AGIs below $25k, 1.4% for AGIs $25k-50k, 1.5% for AGIs $50k-75k, 2.1% for AGIs $75k-100k, 2.6% for AGIs $100k-200k, 4.1% for AGIs over 200k)
Net capital gain/loss in AGI: +$15,562 (reported on 14.8% of returns)
Here:
+$15,562
State:
+$33,493
(% of AGI for various income ranges: 0.2% for AGIs $25k-50k, 0.9% for AGIs $50k-75k, 0.3% for AGIs $75k-100k, 1.7% for AGIs $100k-200k, 11.4% for AGIs over 200k)
Profit/loss from business: +$14,148 (reported on 14.2% of returns)
Here:
+$14,148
State:
+$10,012
(% of AGI for various income ranges: 7.2% for AGIs below $25k, 2.4% for AGIs $25k-50k, 1.9% for AGIs $50k-75k, 2.0% for AGIs $75k-100k, 3.4% for AGIs $100k-200k, 4.3% for AGIs over 200k)
Taxable individual retirement arrangement distribution: $19,739 (reported on 9.5% of returns)
32503:
$19,739
Florida:
$21,544
(% of AGI for various income ranges: 1.5% for AGIs below $25k, 2.0% for AGIs $25k-50k, 3.0% for AGIs $50k-75k, 4.0% for AGIs $75k-100k, 4.4% for AGIs $100k-200k, 4.0% for AGIs over 200k)
Self-employment retirement plans: $21,357 (reported on 0.5% of returns)
32503:
$21,357
Florida:
$20,611
Total itemized deductions: $22,484 (16% of AGI, reported on 21.7% of returns)
Here:
$22,484
State:
$25,533
Here:
15.9% of AGI
State:
18.0% of AGI
(% of AGI for various income ranges: 5.2% for AGIs below $25k, 7.9% for AGIs $25k-50k, 9.7% for AGIs $50k-75k, 10.8% for AGIs $75k-100k, 11.1% for AGIs $100k-200k, 7.8% for AGIs over 200k)
Charity contributions: $6,067 (reported on 17.9% of returns)
Here:
$6,067
State:
$5,698
(% of AGI for various income ranges: 0.5% for AGIs below $25k, 1.2% for AGIs $25k-50k, 1.9% for AGIs $50k-75k, 2.2% for AGIs $75k-100k, 2.6% for AGIs $100k-200k, 2.3% for AGIs over 200k)
Taxes paid: $4,766 (reported on 21.2% of returns)
32503:
$4,766
State:
$6,203
(% of AGI for various income ranges: 0.7% for AGIs below $25k, 1.2% for AGIs $25k-50k, 1.5% for AGIs $50k-75k, 2.1% for AGIs $75k-100k, 2.4% for AGIs $100k-200k, 2.1% for AGIs over 200k)
Earned income credit: $2,368 (reported on 21.7% of returns)
Here:
$2,368
State:
$2,372
(% of AGI for various income ranges: 7.4% for AGIs below $25k, 0.9% for AGIs $25k-50k)
Percentage of individuals using paid preparers for their 2012 taxes: 41.8%
Here:
42%
State:
54%
(% for various income ranges: 37.6% for AGIs below $25k, 37.5% for AGIs $25k-50k, 43.6% for AGIs $50k-75k, 49.5% for AGIs $75k-100k, 54.3% for AGIs $100k-200k, 81.2% for AGIs over 200k)
Averages for the 2004 tax year for zip code 32503, filed in 2005:
Average Adjusted Gross Income (AGI) in 2004: $45,863 (Individual Income Tax Returns)
Here:
$45,863
State:
$50,523
Salary/wage: $35,163 (reported on 80.7% of returns)
Here:
$35,163
State:
$39,563
(% of AGI for various income ranges: 118.8% for AGIs below $10k, 75.5% for AGIs $10k-25k, 73.3% for AGIs $25k-50k, 64.9% for AGIs $50k-75k, 68.7% for AGIs $75k-100k, 48.5% for AGIs over 100k)
Taxable interest for individuals: $1,910 (reported on 40.4% of returns)
This zip code:
$1,910
Florida:
$3,211
(% of AGI for various income ranges: 4.4% for AGIs below $10k, 1.7% for AGIs $10k-25k, 1.3% for AGIs $25k-50k, 1.9% for AGIs $50k-75k, 1.6% for AGIs $75k-100k, 1.7% for AGIs over 100k)
Taxable dividends: $4,493 (reported on 22.6% of returns)
Here:
$4,493
State:
$6,129
(% of AGI for various income ranges: 3.9% for AGIs below $10k, 1.3% for AGIs $10k-25k, 1.3% for AGIs $25k-50k, 1.8% for AGIs $50k-75k, 2.0% for AGIs $75k-100k, 3.0% for AGIs over 100k)
Net capital gain/loss: +$23,291 (reported on 18.9% of returns)
Here:
+$23,291
State:
+$27,205
(% of AGI for various income ranges: -0.7% for AGIs below $10k, 0.3% for AGIs $10k-25k, 0.7% for AGIs $25k-50k, 1.7% for AGIs $50k-75k, 2.2% for AGIs $75k-100k, 20.6% for AGIs over 100k)
Profit/loss from business: +$14,103 (reported on 12.9% of returns)
Here:
+$14,103
State:
+$10,634
(% of AGI for various income ranges: 1.5% for AGIs below $10k, 4.1% for AGIs $10k-25k, 2.3% for AGIs $25k-50k, 2.6% for AGIs $50k-75k, 3.5% for AGIs $75k-100k, 5.3% for AGIs over 100k)
IRA payment deduction: $3,137 (reported on 2.3% of returns)
32503:
$3,137
Florida:
$3,082
(% of AGI for various income ranges: 0.2% for AGIs below $10k, 0.1% for AGIs $10k-25k, 0.2% for AGIs $25k-50k, 0.2% for AGIs $50k-75k, 0.2% for AGIs $75k-100k, 0.1% for AGIs over 100k)
Self-employed pension: $15,111 (reported on 0.7% of returns)
Here:
$15,111
Florida:
$15,857
(% of AGI for various income ranges: 0.1% for AGIs $10k-25k, 0.1% for AGIs $50k-75k, 0.2% for AGIs $75k-100k, 0.4% for AGIs over 100k)
Total itemized deductions: $22,524 (22% of AGI, reported on 25.1% of returns)
Here:
$22,524
State:
$20,370
Here:
22.0% of AGI
State:
20.7% of AGI
(% of AGI for various income ranges: 11.1% for AGIs below $10k, 8.7% for AGIs $10k-25k, 11.1% for AGIs $25k-50k, 13.4% for AGIs $50k-75k, 13.9% for AGIs $75k-100k, 13.0% for AGIs over 100k)
Charity contributions deductions: $5,314 (5% of AGI, reported on 21.7% of returns)
Here:
$5,314
State:
$4,064
Here:
4.8% of AGI
State:
3.8% of AGI
(% of AGI for various income ranges: 0.9% for AGIs below $10k, 1.1% for AGIs $10k-25k, 1.8% for AGIs $25k-50k, 2.6% for AGIs $50k-75k, 2.6% for AGIs $75k-100k, 3.2% for AGIs over 100k)
Total tax: $8,216 (reported on 71.7% of returns)
32503:
$8,216
State:
$9,431
(% of AGI for various income ranges: 2.7% for AGIs below $10k, 3.8% for AGIs $10k-25k, 7.3% for AGIs $25k-50k, 9.8% for AGIs $50k-75k, 11.3% for AGIs $75k-100k, 19.3% for AGIs over 100k)
Earned income credit: $1,894 (reported on 20.0% of returns)
Here:
$1,894
State:
$1,808
Percentage of individuals using paid preparers for their 2004 taxes: 53.4%
Here:
53%
State:
60%
(% for various income ranges: 46.7% for AGIs below $10k, 54.9% for AGIs $10k-25k, 51.3% for AGIs $25k-50k, 54.6% for AGIs $50k-75k, 55.7% for AGIs $75k-100k, 68.9% for AGIs over 100k)
Likely homosexual households (counted as self-reported same-sex unmarried-partner households)
Lesbian couples: 0.3% of all households
Gay men: 0.2% of all households
Household received Food Stamps/SNAP in the past 12 months: 1,408 Household did not receive Food Stamps/SNAP in the past 12 months: 12,555
Women who had a birth in the past 12 months: 343 (232 now married, 111 unmarried) Women who did not have a birth in the past 12 months: 8,982 (2,115 now married, 6,861 unmarried)
Housing units in zip code 32503 with a mortgage: 4,911 (435 second mortgage, 21 home equity loan, 316 both second mortgage and home equity loan) Houses without a mortgage: 66
Median monthly owner costs for units with a mortgage: $1,587 Median monthly owner costs for units without a mortgage: $510
Residents with income below the poverty level in 2022:
This zip code:
13.1%
Whole state:
12.7%
Residents with income below 50% of the poverty level in 2022:
This zip code:
7.4%
Whole state:
6.6%
Median number of rooms in houses and condos:
Here:
6.3
State:
5.9
Median number of rooms in apartments:
Here:
4.6
State:
4.2
Notable locations in this zip code not listed on our city pages
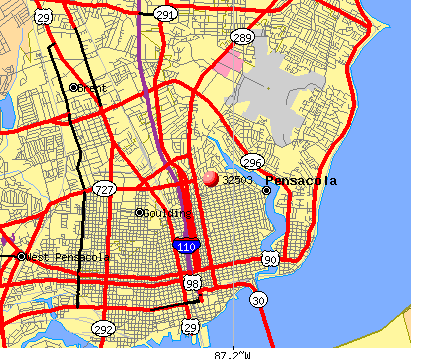
Notable locations in zip code 32503: Pensacola Fire Department Station 2 (A), Pensacola Fire Department Station 3 (B). Display/hide their locations on the map
Shopping Centers: Delmar Shopping Center (1), Ensley Shopping Center (2), Ninth and Fairfield Shopping Center (3), University Mall (4), Beach Road Shopping Center (5), Cordova Mall (6). Display/hide their locations on the map
Churches in zip code 32503 include: Burgess Road Church (A), Saint Pauls Church (B), Allen Chapel African Methodist Episcopal Church (C), Spoken Word Church-Apostolic Faith (D), Baywoods Assembly of God Church (E), Brentwood Assembly of God (F), Bahai Faith (G), Antioch Missionary Baptist Church (H), Bethel Baptist Church (I). Display/hide their locations on the map
3,099 married couples with children.
1,853 single-parent households (258 men, 1,595 women).
93.8% of residents of 32503 zip code speak English at home.
2.7% of residents speak Spanish at home (70% very well, 18% well, 10% not well, 2% not at all).
1.2% of residents speak other Indo-European language at home (89% very well, 8% well, 3% not well).
1.2% of residents speak Asian or Pacific Island language at home (56% very well, 35% well, 5% not well, 5% not at all).
0.4% of residents speak other language at home (100% very well).
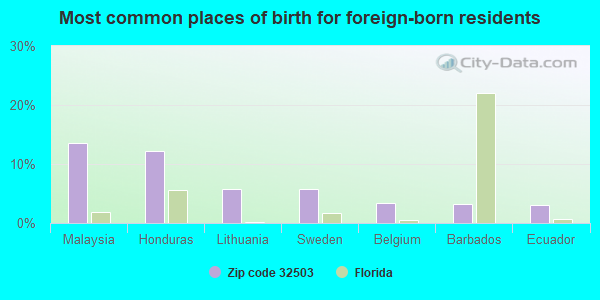
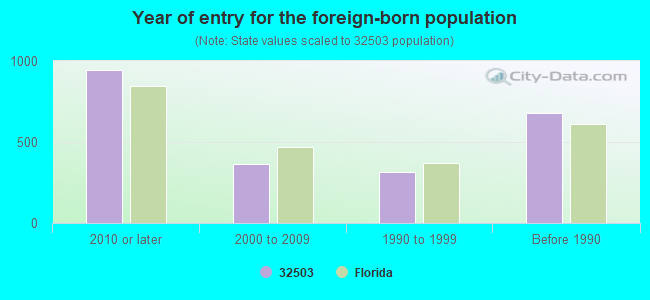
Foreign born population: 1,558 (4.5%) (50.3% of them are naturalized citizens)
Major facilities with environmental interests located in this zip code:
SOUTHERN PRESTRESSED CONCRETE (128 AIRPORT BLVD in PENSACOLA, FL)
(Integrated Compliance Information System) - ICIS-04-2000-0243, FORMAL ENFORCEMENT ACTION National Pollutant Discharge Elimination System NON-MAJOR (Tracking pollutant discharge elimination systems) - permit (Resource Conservation and Recovery Act (tracking hazardous waste)) Business SIC classification: CONCRETE PRODUCTS, EXCEPT BLOCK AND BRICK Organizations: JAMES GEMIND (CONTACT/OWNER)
, NON NOTIFIER (CONTACT/OWNER)
Alternative names: SOUTHERN PRESTRESSED CONCRETE INC
CORVINA DRY CLEANERS (3110 A E CERVANTES ST in PENSACOLA, FL)
AIR MINOR (AIRS/AFS) STATE MASTER (FDM) - CHAZ-FLD981752751, HAZARDOUS WASTE REGULATION PROGRAM (Resource Conservation and Recovery Act (tracking hazardous waste)) Business SIC classification: DRYCLEANING PLANTS, EXCEPT RUG CLEANING Organizations: MIKE ROBB (CONTACT/OWNER)
Alternative names: CORVINA ENTERPRISES INCORPORATED, MAGIC TOUCH CLEANERS
APAC SOUTHEAST GULF COAST DIV (4375 MCCOY DR in PENSACOLA, FL)
AIR MINOR (AIRS/AFS) AIR SYNTHETIC MINOR (AIRS/AFS) CRITERIA AND HAZARDOUS AIR POLLUTANT INVENTORY (Inventory of air pollution sources) (Resource Conservation and Recovery Act (tracking hazardous waste)) TRI REPORTER (Tracking of toxic chemicals releasing facilities) Business SIC classification: ASPHALT PAVING MIXTURES AND BLOCKS Organizations: M E DROSSOS VICE PRESIDENT (CONTACT/OWNER)
Alternative names: APAC FLORIDA INCORPORATED, APAC FLORIDA INCORPORATED north florida DIVISION, APAC-FLORIDA INC., PLANT 407, APAC-FLORIDA INC., PLANT 408, APAC-FLORIDA, INC, APAC-FLORIDA INC., NORTH FL DIVISION, APAC-FLORIDA, INC., NORTH FLORIDA DIVIS, APAC SE GC DIV (NEW MCCOY PLANT), COUCH CONSTRUCTION, L.P., EDWARD M CHADBOURNE INC
PCC PRINT SHOP INC (118 SAINT JOHN ST in PENSACOLA, FL)
STATE MASTER (FDM) - CHAZ-FLD981474380, HAZARDOUS WASTE REGULATION PROGRAM CRITERIA AND HAZARDOUS AIR POLLUTANT INVENTORY (Inventory of air pollution sources) Business SIC classification: BOOKS: PUBLISHING, OR PUBLISHING AND PRINTING; BOOK PRINTING
CSX TRANSPORTATION INC GOULDIN (4100 SYCAMORE DR in PENSACOLA, FL)
National Pollutant Discharge Elimination System NON-MAJOR (Tracking pollutant discharge elimination systems) - permit (Resource Conservation and Recovery Act (tracking hazardous waste)) Business SIC classification: RAILROADS, LINE-HAUL OPERATING Organizations: CARL GERHARDSTEIN (CONTACT/OWNER)
, C E HICKS, DIR ENV OP (CONTACT/OWNER)
A. K. SUTER SCHOOL (501 PICKENS AVENUE in PENSACOLA, FL)
(National Center for Education Statistics) - STATE ID-0501 Organizations: ESCAMBIA COUNTY SCHOOL DISTRICT (SCHOOL DISTRICT)
PATS PROGRAM (INACTIVE 09/01) (1408 E BLOUNT ST in PENSACOLA, FL)
(National Center for Education Statistics) - STATE ID-0341 Organizations: ESCAMBIA COUNTY SCHOOL DISTRICT (SCHOOL DISTRICT)
PETREE PRE-K (INACTIV (916 E FAIRFIELD DR in PENSACOLA, FL)
(National Center for Education Statistics) - STATE ID-0621 Organizations: ESCAMBIA COUNTY SCHOOL DISTRICT (SCHOOL DISTRICT)
N. B. COOK ELEMENTARY SCHOOL (1310 NORTH 12TH AVENUE in PENSACOLA, FL)
(National Center for Education Statistics) - STATE ID-0191 Organizations: ESCAMBIA COUNTY SCHOOL DISTRICT (SCHOOL DISTRICT)
P.A.C.E. PROGRAM (JE HALL CENTER in PENSACOLA, FL)
(National Center for Education Statistics) - STATE ID-2034 Organizations: ESCAMBIA COUNTY SCHOOL DISTRICT (SCHOOL DISTRICT)
HOSPITAL & HOMEBOUND (30 E TEXAR DR in PENSACOLA, FL)
(National Center for Education Statistics) - STATE ID-0933 Organizations: ESCAMBIA COUNTY SCHOOL DISTRICT (SCHOOL DISTRICT)
GULF COAST HIGH SCHOOL (FORMERLY AC (1805 NORTH 6TH AVENUE in PENSACOLA, FL)
(National Center for Education Statistics) - STATE ID-2096 Organizations: ESCAMBIA COUNTY SCHOOL DISTRICT (SCHOOL DISTRICT)
O. J. SEMMES MONTESSORI ACADEMY (1250 E TEXAR DR in PENSACOLA, FL)
(National Center for Education Statistics) - STATE ID-0471 Organizations: ESCAMBIA COUNTY SCHOOL DISTRICT (SCHOOL DISTRICT)
Housing units lacking complete plumbing facilities: 1.4% Housing units lacking complete kitchen facilities: 2.3%
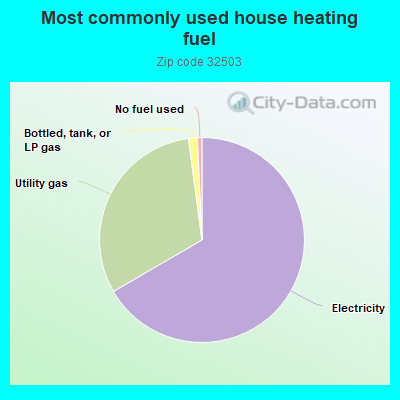
66.5%Electricity
31.2%Utility gas
1.4%Bottled, tank, or LP gas
0.7%No fuel used
Population in 1990: 34,491.
Place of birth for U.S.-born residents:
This state: 14,115
Northeast: 3,099
Midwest: 4,044
South: 8,562
West: 2,597
50% of the 32503 zip code residents lived in the same house 5 years ago. Out of people who lived in different houses, 45% lived in this county. Out of people who lived in different counties, 50% lived in Florida.
87% of the 32503 zip code residents lived in the same house 1 year ago. Out of people who lived in different houses, 53% moved from this county. Out of people who lived in different houses, 12% moved from different county within same state. Out of people who lived in different houses, 27% moved from different state. Out of people who lived in different houses, 5% moved from abroad.
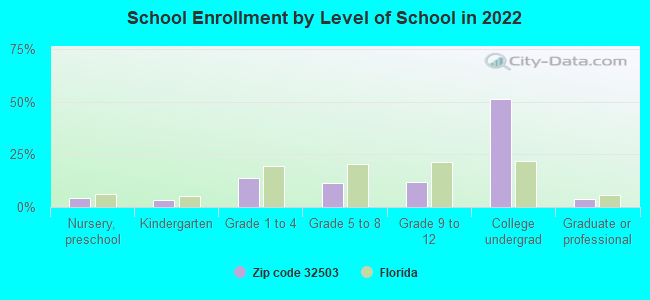
Private vs. public school enrollment:
Students in private schools in grades 1 to 8 (elementary and middle school): 832
Here:
30.7%
Florida:
15.8%
Students in private schools in grades 9 to 12 (high school): 210
Here:
16.8%
Florida:
12.9%
Students in private undergraduate colleges: 4,963
Here:
84.6%
Florida:
23.6%
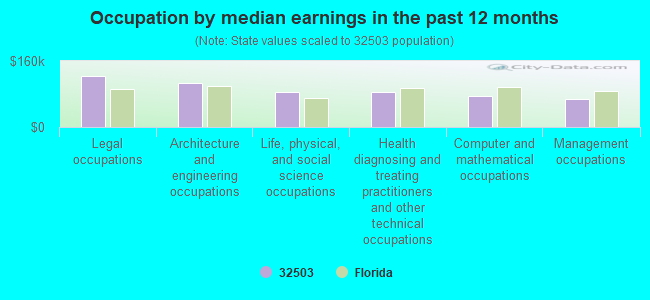
Occupation by median earnings in the past 12 months ($)
122,624Legal occupations
106,796Architecture and engineering occupations
85,863Life, physical, and social science occupations
84,486Health diagnosing and treating practitioners and other technical occupations
74,833Computer and mathematical occupations
67,367Management occupations
Companies with biggest federal contracts located in this zip code (PENSACOLA, FL):
OVERSTREET ELECTRIC CO , INC (4220 NORTH DAVIS HWY, BLDG; small business) : $45,345,383 in 208 contractsfrom 1999 to 2005
Contracts for Construction of Structures and Facilities -- Miscellaneous Buildings, Maintenance, Repair or Alteration of Real Property -- Other Utilities, Construction of Structures and Facilities -- Other Conservation and Development Facilities, Construction of Structures and Facilities -- Other Non-Building Facilities, and moreby U.S. Army Corps of Engineers - civil program financing only, Navy, Army, NASA, and others Signed by year:2000: $8,565,569; 2001: $14,112,492; 2002: $8,792,639; 2003: $4,759,846; 2004: $6,467,802; 2005: $2,428,052; 2006: $0.
Biggest contracts:
$4,306,036 with U.S. Army Corps of Engineers - civil program financing only for Construction of Structures and Facilities -- Miscellaneous Buildings. Taking place in SC. Signed on 2001-09-14. Completion date: 2002-09-30.
$2,744,000 with Navy for Maintenance, Repair or Alteration of Real Property -- Other Utilities. Taking place in WA. Signed on 2001-09-25. Completion date: 2002-10-07.
$2,166,383 with U.S. Army Corps of Engineers - civil program financing only for Construction of Structures and Facilities -- Other Conservation and Development Facilities. Taking place in GA. Signed on 2000-07-28. Completion date: 2001-08-02.
$1,841,692 with Army for Construction of Structures and Facilities -- Miscellaneous Buildings. Taking place in AL. Signed on 2000-09-30. Completion date: 2001-10-11.
APAC-SOUTHEAST, INC (4375 MCCOY DR) : $10,460,644 in 75 contractsfrom 2000 to 2006
Contracts for Maintenance, Repair or Alteration of Real Property -- Airport Runways, Maintenance, Repair or Alteration of Real Property -- Highways, Roads, Streets, Bridges, and Railways (includes resurfacing), Maintenance, Repair or Alteration of Real Property -- Miscellaneous Buildings, Construction of Structures and Facilities -- Other Non-Building Facilities, and moreby Navy, Air Force, National Park Service Signed by year:2000: $82,000; 2001: $230,000; 2002: $76,935; 2003: $1,115,717; 2004: $3,552,676; 2005: $1,861,004; 2006: $3,542,312.
Biggest contracts:
$2,301,677 with Navy for Maintenance, Repair or Alteration of Real Property -- Airport Runways. Signed on 2004-12-29. Completion date: 2005-05-15.
$2,088,184 with Navy for Maintenance, Repair or Alteration of Real Property -- Highways, Roads, Streets, Bridges, and Railways (includes resurfacing). Signed on 2006-02-23. Completion date: 2006-10-14.
$889,603, same as above.Signed on 2005-08-22. Completion date: 2006-02-03.
$350,288, same as above.Signed on 2003-09-18. Completion date: 2004-07-31.
GULFSIDEMECHANICAL, INC (435 CORDAY ST) : $3,494,165 in 50 contractsfrom 2000 to 2006
Contracts for Maintenance, Repair or Alteration of Real Property -- Miscellaneous Buildings, Construction of Structures and Facilities -- Miscellaneous Buildings, Construction of Structures and Facilities -- Office Buildings, Air Conditioning Equipment by Navy, Air Force, National Oceanic and Atmospheric Administration/Under Secretary for Oceans and Atmosphere Signed by year:2000: $956,472; 2001: $70,900; 2002: $468,863; 2003: $0; 2004: $405,000; 2005: $1,544,018; 2006: $48,912.
Biggest contracts:
$494,200 with Navy for Maintenance, Repair or Alteration of Real Property -- Miscellaneous Buildings. Signed on 2005-06-29. Completion date: 2006-04-10.
$407,200 with Air Force for Maintenance, Repair or Alteration of Real Property -- Miscellaneous Buildings. Signed on 2000-06-07. Completion date: 2000-11-15.
$299,827 with Navy for Construction of Structures and Facilities -- Miscellaneous Buildings. Signed on 2002-02-19. Completion date: 2003-01-03.
$289,900 with Navy for Construction of Structures and Facilities -- Office Buildings. Signed on 2000-09-28. Completion date: 2001-04-10.
JONES FLOOR COVERING INC (5600 N DAVIS HWY; small business) : $1,053,911 in 232 contractsfrom 1999 to 2005
Contracts for Maintenance, Repair or Alteration of Real Property -- Miscellaneous Buildings, Maintenance, Repair or Alteration of Real Property -- Office Buildings, Floor Coverings by Air Force, Army, Navy Signed by year:2000: $209,280; 2001: -$874; 2002: $171,856; 2003: $319,918; 2004: $0; 2005: $7,994; 2006: $0.
Biggest contracts:
$211,939 with Air Force for Maintenance, Repair or Alteration of Real Property -- Miscellaneous Buildings. Signed on 1999-10-01. Completion date: 1999-12-30.
$80,000, same as above.Signed on 2000-08-14. Completion date: 2000-08-14.
$66,184, same as above.Signed on 1999-10-25. Completion date: 1999-11-30.
$60,000, same as above.Signed on 2000-07-18. Completion date: 2000-08-14.
VERTEC INC (141 TERRY DRIVE; small business) : $852,547 in 4 contractsfrom 2002 to 2006
$519,000 with Navy for Miscellaneous Aircraft Accessories and Components. Signed on 2006-05-03. Completion date: 2007-05-03.
$178,050, same as above.Signed on 2002-10-01. Completion date: 2002-12-13.
$78,342, same as above.Signed on 2004-11-18. Completion date: 2005-02-16.
$77,155, same as above.Signed on 2002-06-06. Completion date: 2002-11-24.
APOGEE ELECTRONIC SERVICES INC (180 E BURGESS RD STE D) : $392,532 in 35 contractsfrom 2001 to 2006
Contracts for ADPE System Configuration, ADP Supplies, ADP Support Equipment, ADP Software, and moreby Navy, Federal Technology Service, Department of State, Bureau of the Public Debt, and others Signed by year:2000: $0; 2001: $72,469; 2002: $6,171; 2003: $49,048; 2004: $107,572; 2005: $147,938; 2006: $9,334.
Biggest contracts:
$66,215 with Navy for ADPE System Configuration. Signed on 2004-09-30. Completion date: 2004-10-30.
$45,469, same as above.Signed on 2001-02-21. Completion date: 2001-03-30.
$28,911, same as above.Signed on 2003-06-09. Completion date: 2003-07-07.
$27,000 with Federal Technology Service for ADPE System Configuration. Signed on 2001-03-15. Completion date: 2001-03-15.
WILLIAMSON, ANGEL MD PA (5120 BAYOU BLVD STE 9; small business) : $374,720 in 2 contractsfrom 1999 to 2000
$198,720 with Navy for Other Medical Services. Signed on 2000-10-01. Completion date: 2001-09-30.
$176,000, same as above.Signed on 1999-11-01. Completion date: 2000-09-30.
RICHARD A GUMAN (2350 BAVARIAN COURT; small business) : $263,844 in 4 contractsfrom 2000 to 2001
$88,687 with Navy for Dentistry Services. Signed on 2001-10-01. Completion date: 2006-05-31.
$83,065, same as above.Signed on 2000-01-12. Completion date: 2000-09-30.
$63,828, same as above.Signed on 2000-10-01. Completion date: 2001-09-30.
$28,264, same as above.Signed on 2001-05-22. Completion date: 2006-05-31.
PORTER M D , HENRY (6209 VICKSBURG DR; small business) : $233,520 in 2 contractsin 2005
$199,680 with Navy for General Health Care Services. Signed on 2005-10-19. Completion date: 2005-09-30.
$33,840, same as above.Signed on 2005-08-01. Completion date: 2005-09-30.
PANHANDLE ALARM & TELEPHONE CO (10 INDUSTRIAL BLVD; small business) : $83,273 in 18 contractsfrom 2003 to 2005
Contracts for Communications Security Equipment and Components, Intercommunication and Public Address Systems, Except Airborne, Maintenance, Repair and Rebuilding of Equipment -- Communication, Detection, and Coherent Radiation Equipment, Telephone and Telegraph Equipment, and moreby U.S. Secret Service, National Park Service, Air Force, Navy, and others Signed by year:2000: $0; 2001: $0; 2002: $0; 2003: $27,029; 2004: $11,035; 2005: $45,209; 2006: $0.
Biggest contracts:
$32,515 with U.S. Secret Service for Communications Security Equipment and Components. Signed on 2005-08-05. Completion date: 2005-08-07.
$10,296 with National Park Service for Communications Security Equipment and Components. Signed on 2003-10-01. Completion date: 2004-09-30.
$6,100 with Air Force for Intercommunication and Public Address Systems, Except Airborne. Signed on 2005-03-23. Completion date: 2005-04-07.
$4,889 with Navy for Maintenance, Repair and Rebuilding of Equipment -- Communication, Detection, and Coherent Radiation Equipment. Signed on 2004-10-04. Completion date: 2005-09-30.
Top industries in this zip code by the number of employees in 2005:
2002 - 2018 National Fire Incident Reporting System (NFIRS) incidents
Based on the data from the years 2002 - 2018 the average number of fire incidents per year is 77. The highest number of fires - 97 took place in 2004, and the least - 53 in 2016. The data has a decreasing trend.
When looking into fire subcategories, the most incidents belonged to: Structure Fires (43.1%), and Outside Fires (39.7%).
Fire incident types reported to NFIRS in Zip Code 32503


 Nearest zip codes: 32504, 32501, 32505, 32502, 32514, 32511.


 Based on the data from the years 2002 - 2018 the average number of fire incidents per year is 77. The highest number of fires - 97 took place in 2004, and the least - 53 in 2016. The data has a decreasing trend.
 When looking into fire subcategories, the most incidents belonged to: Structure Fires (43.1%), and Outside Fires (39.7%).