Estimated zip code population in 2022: 10,894 Zip code population in 2010: 9,997 Zip code population in 2000: 10,110
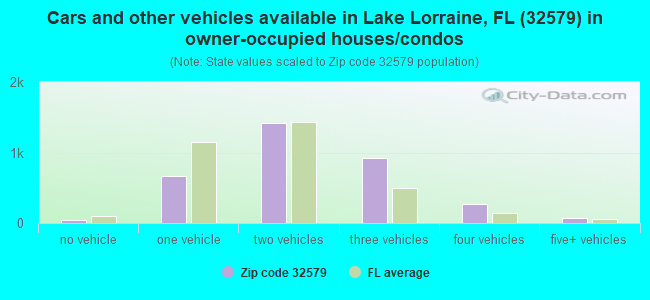
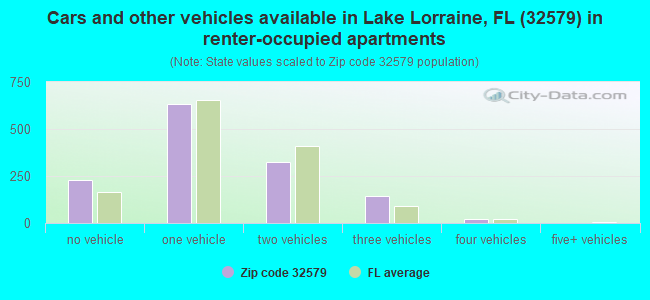
Houses and condos: 5,259 Renter-occupied apartments: 1,345
% of renters here:
28%
State:
33%
March 2022 cost of living index in zip code 32579: 90.1 (less than average, U.S. average is 100)
Land area: 4.4 sq. mi. Water area: 2.4 sq. mi.
Population density: 2,502 people per square mile
(average).
OSM Map
General Map
Google Map
MSN Map
OSM Map
General Map
Google Map
MSN Map
OSM Map
General Map
Google Map
MSN Map
OSM Map
General Map
Google Map
MSN Map
Please wait while loading the map...
Real estate property taxes paid for housing units in 2022:
This zip code:
0.6% ($2,604)
Florida:
0.7% ($2,529)
Median real estate property taxes paid for housing units with mortgages in 2022: $2,751 (0.6%) Median real estate property taxes paid for housing units with no mortgage in 2022: $2,328 (0.5%)
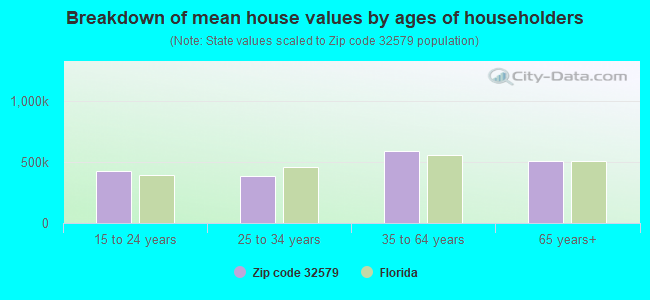
Estimated median house/condo value in 2022: $471,527
32579:
$471,527
Florida:
$354,100
According to our research of Florida and other state lists, there were 9 registered sex offenders living in 32579 zip code as of April 27, 2024. The ratio of all residents to sex offenders in zip code 32579 is 1,164 to 1. The ratio of registered sex offenders to all residents in this zip code is lower than the state average.
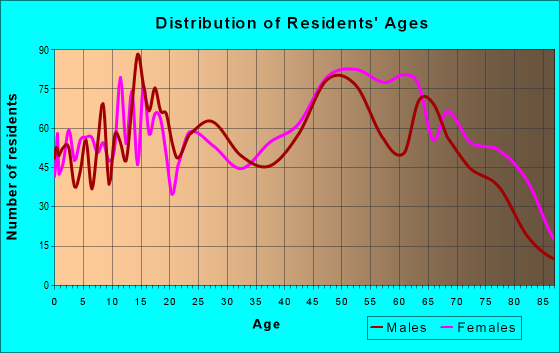
Median resident age:
This zip code:
46.3 years
Florida median age:
42.7 years
Average household size:
This zip code:
2.3 people
Florida:
2.5 people
Averages for the 2020 tax year for zip code 32579, filed in 2021:
Average Adjusted Gross Income (AGI) in 2020: $89,876 (Individual Income Tax Returns)
Here:
$89,876
State:
$82,200
Salary/wage: $62,956 (reported on 71.8% of returns)
Here:
$62,956
State:
$58,347
(% of AGI for various income ranges: 1164.4% for AGIs below $25k, 3295.5% for AGIs $25k-50k, 5648.8% for AGIs $50k-75k, 7285.1% for AGIs $75k-100k, 16008.8% for AGIs $100k-200k, 54569.2% for AGIs over 200k)
Taxable interest for individuals: $2,270 (reported on 46.3% of returns)
This zip code:
$2,270
Florida:
$4,272
(% of AGI for various income ranges: 24.3% for AGIs below $25k, 49.1% for AGIs $25k-50k, 109.6% for AGIs $50k-75k, 152.6% for AGIs $75k-100k, 321.9% for AGIs $100k-200k, 1835.4% for AGIs over 200k)
Ordinary dividends: $9,958 (reported on 28.5% of returns)
Here:
$9,958
State:
$15,863
(% of AGI for various income ranges: 27.6% for AGIs below $25k, 36.8% for AGIs $25k-50k, 150.6% for AGIs $50k-75k, 267.4% for AGIs $75k-100k, 685.4% for AGIs $100k-200k, 7694.6% for AGIs over 200k)
Net capital gain/loss in AGI: +$28,695 (reported on 26.2% of returns)
Here:
+$28,695
State:
+$62,983
(% of AGI for various income ranges: 8.6% for AGIs below $25k, 29.3% for AGIs $25k-50k, 170.2% for AGIs $50k-75k, 255.1% for AGIs $75k-100k, 1303.8% for AGIs $100k-200k, 25593.1% for AGIs over 200k)
Profit/loss from business: +$14,678 (reported on 14.8% of returns)
Here:
+$14,678
State:
+$9,719
(% of AGI for various income ranges: 108.3% for AGIs below $25k, 120.7% for AGIs $25k-50k, 225.8% for AGIs $50k-75k, 228.6% for AGIs $75k-100k, 606.3% for AGIs $100k-200k, 3601.5% for AGIs over 200k)
Taxable individual retirement arrangement distribution: $19,401 (reported on 12.3% of returns)
32579:
$19,401
Florida:
$24,823
(% of AGI for various income ranges: 50.2% for AGIs below $25k, 89.7% for AGIs $25k-50k, 208.4% for AGIs $50k-75k, 378.9% for AGIs $75k-100k, 973.8% for AGIs $100k-200k, 3461.5% for AGIs over 200k)
Self-employed (Keogh) retirement plans: $19,600 (reported on 0.5% of returns)
32579:
$19,600
Florida:
$29,694
(% of AGI for various income ranges: 113.1% for AGIs $100k-200k)
Total itemized deductions: $41,502 (reported on 8.0% of returns)
Here:
$41,502
State:
$45,393
(% of AGI for various income ranges: 122.6% for AGIs $25k-50k, 240.6% for AGIs $50k-75k, 466.9% for AGIs $75k-100k, 1073.5% for AGIs $100k-200k, 6956.2% for AGIs over 200k)
Charity contributions: $16,629 (reported on 6.2% of returns)
Here:
$16,629
State:
$20,178
(% of AGI for various income ranges: 14.8% for AGIs $25k-50k, 52.0% for AGIs $50k-75k, 92.9% for AGIs $75k-100k, 298.8% for AGIs $100k-200k, 2718.5% for AGIs over 200k)
Taxes paid: $6,227 (reported on 7.3% of returns)
32579:
$6,227
State:
$6,967
(% of AGI for various income ranges: 17.0% for AGIs $25k-50k, 37.2% for AGIs $50k-75k, 65.1% for AGIs $75k-100k, 157.5% for AGIs $100k-200k, 886.2% for AGIs over 200k)
Earned income credit: $2,145 (reported on 11.4% of returns)
Here:
$2,145
State:
$2,306
(% of AGI for various income ranges: 73.3% for AGIs below $25k, 55.1% for AGIs $25k-50k)
Percentage of individuals using paid preparers for their 2020 taxes: 91.4%
Here:
91%
State:
92%
(% for various income ranges: 90.8% for AGIs below $25k, 92.9% for AGIs $25k-50k, 90.8% for AGIs $50k-75k, 91.2% for AGIs $75k-100k, 90.7% for AGIs $100k-200k, 92.7% for AGIs over 200k)
Averages for the 2012 tax year for zip code 32579, filed in 2013:
Average Adjusted Gross Income (AGI) in 2012: $70,052 (Individual Income Tax Returns)
Here:
$70,052
State:
$60,316
Salary/wage: $48,764 (reported on 75.8% of returns)
Here:
$48,764
State:
$45,277
(% of AGI for various income ranges: 73.8% for AGIs below $25k, 70.7% for AGIs $25k-50k, 57.1% for AGIs $50k-75k, 58.2% for AGIs $75k-100k, 57.2% for AGIs $100k-200k, 31.7% for AGIs over 200k)
Taxable interest for individuals: $1,915 (reported on 45.3% of returns)
This zip code:
$1,915
Florida:
$3,587
(% of AGI for various income ranges: 1.5% for AGIs below $25k, 0.9% for AGIs $25k-50k, 1.5% for AGIs $50k-75k, 0.8% for AGIs $75k-100k, 1.3% for AGIs $100k-200k, 1.4% for AGIs over 200k)
Ordinary dividends: $6,658 (reported on 26.8% of returns)
Here:
$6,658
State:
$12,831
(% of AGI for various income ranges: 1.1% for AGIs below $25k, 1.1% for AGIs $25k-50k, 2.2% for AGIs $50k-75k, 1.3% for AGIs $75k-100k, 3.0% for AGIs $100k-200k, 3.7% for AGIs over 200k)
Net capital gain/loss in AGI: +$10,660 (reported on 21.8% of returns)
Here:
+$10,660
State:
+$33,493
(% of AGI for various income ranges: 0.2% for AGIs $25k-50k, 0.4% for AGIs $50k-75k, 1.0% for AGIs $75k-100k, 1.4% for AGIs $100k-200k, 9.7% for AGIs over 200k)
Profit/loss from business: +$12,764 (reported on 13.2% of returns)
Here:
+$12,764
State:
+$10,012
(% of AGI for various income ranges: 5.2% for AGIs below $25k, 2.3% for AGIs $25k-50k, 2.0% for AGIs $50k-75k, 2.1% for AGIs $75k-100k, 2.3% for AGIs $100k-200k, 2.2% for AGIs over 200k)
Taxable individual retirement arrangement distribution: $14,559 (reported on 13.6% of returns)
32579:
$14,559
Florida:
$21,544
(% of AGI for various income ranges: 1.8% for AGIs below $25k, 2.2% for AGIs $25k-50k, 2.2% for AGIs $50k-75k, 2.6% for AGIs $75k-100k, 4.1% for AGIs $100k-200k, 2.3% for AGIs over 200k)
Self-employment retirement plans: $19,933 (reported on 0.6% of returns)
32579:
$19,933
Florida:
$20,611
Total itemized deductions: $23,268 (16% of AGI, reported on 26.8% of returns)
Here:
$23,268
State:
$25,533
Here:
16.1% of AGI
State:
18.0% of AGI
(% of AGI for various income ranges: 8.0% for AGIs below $25k, 7.4% for AGIs $25k-50k, 8.7% for AGIs $50k-75k, 9.1% for AGIs $75k-100k, 9.8% for AGIs $100k-200k, 8.7% for AGIs over 200k)
Charity contributions: $6,680 (reported on 22.4% of returns)
Here:
$6,680
State:
$5,698
(% of AGI for various income ranges: 0.5% for AGIs below $25k, 0.9% for AGIs $25k-50k, 1.6% for AGIs $50k-75k, 2.1% for AGIs $75k-100k, 2.7% for AGIs $100k-200k, 2.6% for AGIs over 200k)
Taxes paid: $4,652 (reported on 26.4% of returns)
32579:
$4,652
State:
$6,203
(% of AGI for various income ranges: 1.2% for AGIs below $25k, 1.0% for AGIs $25k-50k, 1.5% for AGIs $50k-75k, 1.8% for AGIs $75k-100k, 2.1% for AGIs $100k-200k, 2.0% for AGIs over 200k)
Earned income credit: $2,149 (reported on 13.9% of returns)
Here:
$2,149
State:
$2,372
(% of AGI for various income ranges: 5.2% for AGIs below $25k, 0.9% for AGIs $25k-50k)
Percentage of individuals using paid preparers for their 2012 taxes: 40.4%
Here:
40%
State:
54%
(% for various income ranges: 35.4% for AGIs below $25k, 37.2% for AGIs $25k-50k, 42.7% for AGIs $50k-75k, 38.2% for AGIs $75k-100k, 47.6% for AGIs $100k-200k, 71.4% for AGIs over 200k)
Averages for the 2004 tax year for zip code 32579, filed in 2005:
Average Adjusted Gross Income (AGI) in 2004: $59,914 (Individual Income Tax Returns)
Here:
$59,914
State:
$50,523
Salary/wage: $41,956 (reported on 77.4% of returns)
Here:
$41,956
State:
$39,563
(% of AGI for various income ranges: 132.2% for AGIs below $10k, 74.6% for AGIs $10k-25k, 70.3% for AGIs $25k-50k, 60.2% for AGIs $50k-75k, 58.2% for AGIs $75k-100k, 43.4% for AGIs over 100k)
Taxable interest for individuals: $2,255 (reported on 54.3% of returns)
This zip code:
$2,255
Florida:
$3,211
(% of AGI for various income ranges: 6.8% for AGIs below $10k, 1.9% for AGIs $10k-25k, 1.7% for AGIs $25k-50k, 1.8% for AGIs $50k-75k, 1.6% for AGIs $75k-100k, 2.3% for AGIs over 100k)
Taxable dividends: $4,624 (reported on 31.9% of returns)
Here:
$4,624
State:
$6,129
(% of AGI for various income ranges: 4.9% for AGIs below $10k, 1.2% for AGIs $10k-25k, 1.4% for AGIs $25k-50k, 2.3% for AGIs $50k-75k, 2.2% for AGIs $75k-100k, 3.0% for AGIs over 100k)
Net capital gain/loss: +$19,516 (reported on 25.9% of returns)
Here:
+$19,516
State:
+$27,205
(% of AGI for various income ranges: -0.7% for AGIs below $10k, -0.1% for AGIs $10k-25k, 0.6% for AGIs $25k-50k, 1.3% for AGIs $50k-75k, 2.1% for AGIs $75k-100k, 15.4% for AGIs over 100k)
Profit/loss from business: +$12,694 (reported on 12.9% of returns)
Here:
+$12,694
State:
+$10,634
(% of AGI for various income ranges: -0.7% for AGIs below $10k, 4.0% for AGIs $10k-25k, 2.8% for AGIs $25k-50k, 2.5% for AGIs $50k-75k, 2.6% for AGIs $75k-100k, 2.7% for AGIs over 100k)
IRA payment deduction: $3,110 (reported on 3.4% of returns)
32579:
$3,110
Florida:
$3,082
(% of AGI for various income ranges: 0.2% for AGIs $10k-25k, 0.3% for AGIs $25k-50k, 0.3% for AGIs $50k-75k, 0.2% for AGIs $75k-100k, 0.1% for AGIs over 100k)
Self-employed pension: $11,422 (reported on 0.8% of returns)
Here:
$11,422
Florida:
$15,857
Total itemized deductions: $21,015 (19% of AGI, reported on 28.9% of returns)
Here:
$21,015
State:
$20,370
Here:
18.7% of AGI
State:
20.7% of AGI
(% of AGI for various income ranges: 9.7% for AGIs below $10k, 8.1% for AGIs $10k-25k, 11.8% for AGIs $25k-50k, 10.0% for AGIs $50k-75k, 12.2% for AGIs $75k-100k, 9.5% for AGIs over 100k)
Charity contributions deductions: $4,444 (4% of AGI, reported on 25.2% of returns)
Here:
$4,444
State:
$4,064
Here:
3.7% of AGI
State:
3.8% of AGI
(% of AGI for various income ranges: 0.7% for AGIs below $10k, 0.9% for AGIs $10k-25k, 1.3% for AGIs $25k-50k, 1.8% for AGIs $50k-75k, 2.4% for AGIs $75k-100k, 2.0% for AGIs over 100k)
Total tax: $10,660 (reported on 80.1% of returns)
32579:
$10,660
State:
$9,431
(% of AGI for various income ranges: 4.4% for AGIs below $10k, 4.4% for AGIs $10k-25k, 7.3% for AGIs $25k-50k, 9.6% for AGIs $50k-75k, 11.3% for AGIs $75k-100k, 19.6% for AGIs over 100k)
Earned income credit: $1,707 (reported on 12.2% of returns)
Here:
$1,707
State:
$1,808
Percentage of individuals using paid preparers for their 2004 taxes: 51.5%
Here:
51%
State:
60%
(% for various income ranges: 47.7% for AGIs below $10k, 53.0% for AGIs $10k-25k, 50.4% for AGIs $25k-50k, 51.3% for AGIs $50k-75k, 46.7% for AGIs $75k-100k, 58.2% for AGIs over 100k)
Household received Food Stamps/SNAP in the past 12 months: 174 Household did not receive Food Stamps/SNAP in the past 12 months: 4,589
Women who had a birth in the past 12 months: 61 (37 now married, 23 unmarried) Women who did not have a birth in the past 12 months: 2,097 (1,016 now married, 1,081 unmarried)
Housing units in zip code 32579 with a mortgage: 1,983 (240 second mortgage, 111 home equity loan, 128 both second mortgage and home equity loan) Houses without a mortgage: 21
Median monthly owner costs for units with a mortgage: $2,183 Median monthly owner costs for units without a mortgage: $648
Residents with income below the poverty level in 2022:
This zip code:
8.0%
Whole state:
12.7%
Residents with income below 50% of the poverty level in 2022:
This zip code:
5.2%
Whole state:
6.6%
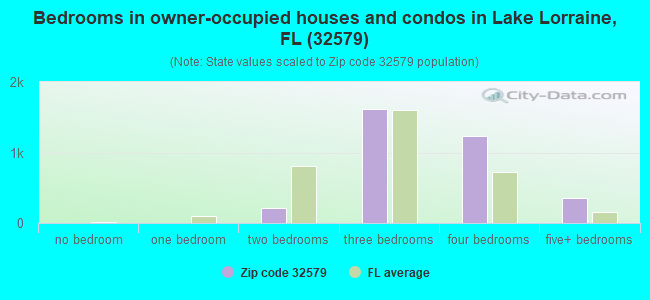
Median number of rooms in houses and condos:
Here:
7.1
State:
5.9
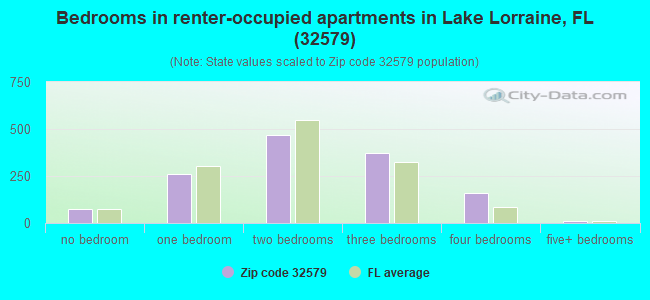
Median number of rooms in apartments:
Here:
4.6
State:
4.2
Notable locations in this zip code not listed on our city pages
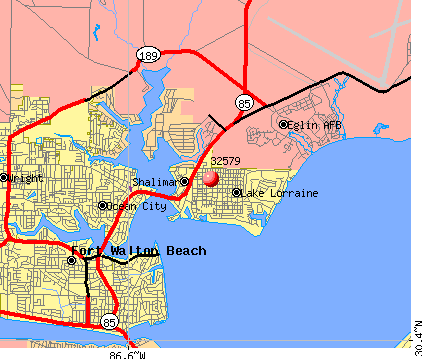
Notable locations in zip code 32579: Sun Plaza (A), Ferry Pass Plaza (B), Okaloosa County Emergency Medical Services (C), Ocean City - Wright Fire District Station 2 (D). Display/hide their locations on the map
1,096 married couples with children.
503 single-parent households (186 men, 317 women).
85.3% of residents of 32579 zip code speak English at home.
6.3% of residents speak Spanish at home (82% very well, 10% well, 8% not well).
3.8% of residents speak other Indo-European language at home (78% very well, 17% well, 5% not well).
4.1% of residents speak Asian or Pacific Island language at home (70% very well, 20% well, 10% not well).
0.2% of residents speak other language at home (100% very well).
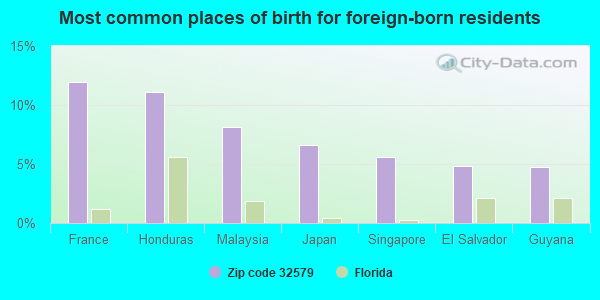
Foreign born population: 884 (8.1%) (81.5% of them are naturalized citizens)
This zip code:
8.1%
Whole state:
21.7%
12%France
11%Honduras
8%Malaysia
7%Japan
6%Singapore
5%El Salvador
5%Guyana
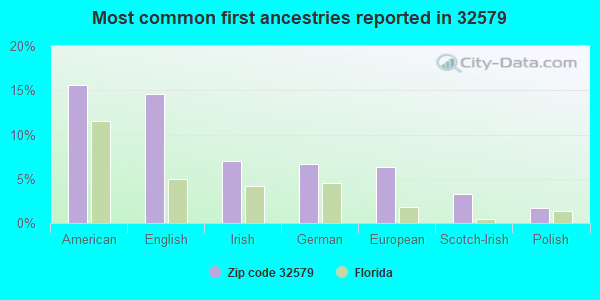
16%American
15%English
7%Irish
7%German
6%European
3%Scotch-Irish
2%Polish
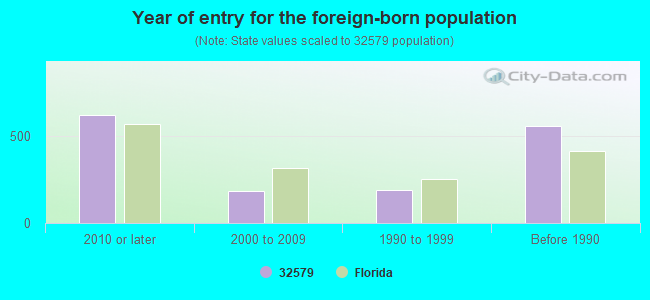
Year of entry for the foreign-born population
6202010 or later
1842000 to 2009
1911990 to 1999
556Before 1990
Facilities with environmental interests located in this zip code:
LONGWOOD ELEMENTARY SCHOOL (50 HOLLY AVENUE in SHALIMAR, FL)
(Geographic Names Information System) (National Center for Education Statistics) - STATE ID-0681 Organizations: OKALOOSA COUNTY SCHOOL DISTRICT (SCHOOL DISTRICT)
SHALIMAR ELEMENTARY SCHOOL (1350 JOE MARTIN CIRCLE in SHALIMAR, FL)
(National Center for Education Statistics) - STATE ID-0431 Organizations: OKALOOSA COUNTY SCHOOL DISTRICT (SCHOOL DISTRICT)
SHALIMAR YACHT BASIN (100 OLD FERRY ROAD in SHALIMAR, FL)
National Pollutant Discharge Elimination System NON-MAJOR (Tracking pollutant discharge elimination systems) - permit (Resource Conservation and Recovery Act (tracking hazardous waste)) Business SIC classification: MARINAS Organizations: ROBERT P MAXON (CONTACT/OWNER)
, STEPHEN PETERSON (CONTACT/OWNER)
CLIFFORD MEIGS MIDDLE SCHOOL (150 RICHBOURG AVENUE in SHALIMAR, FL)
(National Center for Education Statistics) - STATE ID-0082 Organizations: OKALOOSA COUNTY SCHOOL DISTRICT (SCHOOL DISTRICT)
BLUE BAYOU DRYCLEANERS & COIN LAUNDRY (24 A 8TH STREET in SHALIMAR, FL)
AIR MINOR (AIRS/AFS) (Resource Conservation and Recovery Act (tracking hazardous waste)) Business SIC classification: DRYCLEANING PLANTS, EXCEPT RUG CLEANING Organizations: JERRY ORTH (CONTACT/OWNER)
Alternative names: BLUE BAYOU DRY CLEANERS & COIN LAUNDRY
APAC-FLORIDA, INC - NORTH FL DIVISION (102 SUNSET LANE in SHALIMAR, FL)
AIR MINOR (AIRS/AFS) CRITERIA AND HAZARDOUS AIR POLLUTANT INVENTORY (Inventory of air pollution sources) Business SIC classification: ASPHALT PAVING MIXTURES AND BLOCKS Alternative names: APAC-FLORIDA INC, COUCH CONSTRUCTION, L.P., COUCH CONSTRUCTION, L.P.
KELTEC FLORIDA (50 SECOND STREET in SHALIMAR, FL)
(Resource Conservation and Recovery Act (tracking hazardous waste)) Organizations: SCOTT RAHMES (CONTACT/OWNER)
OKALOOSA ASPHALT ENT INC (100 SUNSET LANE in SHALIMAR, FL)
(Resource Conservation and Recovery Act (tracking hazardous waste)) Organizations: JOSEPH DAVIS, DEO (CONTACT/OWNER)
Alternative names: OKALOOSA ASPHALT INCORPORATED
SILVER CREEK PLANT (3275 LITTLE RD in CRESTVIEW, FL)
(Resource Conservation and Recovery Act (tracking hazardous waste)) Organizations: JOSEPH DAVIS, DEC (CONTACT/OWNER)
COMPUTER SCIENCE & APPLICATIONS (2 CLIFFORD AVE in SHALIMAR, FL)
(Resource Conservation and Recovery Act (tracking hazardous waste)) Business NAICS classification: BARE PRINTED CIRCUIT BOARD MANUFACTURING. Organizations: MARION SKALKA (CONTACT/OWNER)
Housing units lacking complete plumbing facilities: 0.5% Housing units lacking complete kitchen facilities: 1.6%
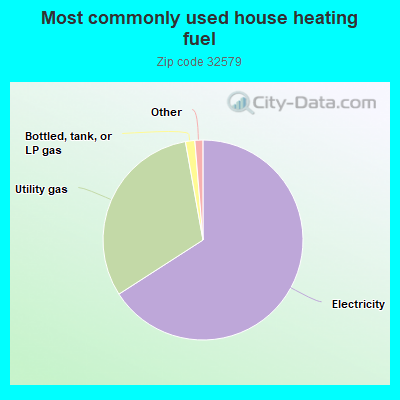
65.9%Electricity
31.3%Utility gas
1.5%Bottled, tank, or LP gas
0.6%Solar energy
0.6%No fuel used
Population in 1990: 9,327. Population change in the 1990s: +783 (+8.4%).
Place of birth for U.S.-born residents:
This state: 2,374
Northeast: 1,043
Midwest: 1,369
South: 3,215
West: 1,381
51% of the 32579 zip code residents lived in the same house 5 years ago. Out of people who lived in different houses, 53% lived in this county. Out of people who lived in different counties, 50% lived in Florida.
82% of the 32579 zip code residents lived in the same house 1 year ago. Out of people who lived in different houses, 42% moved from this county. Out of people who lived in different houses, 7% moved from different county within same state. Out of people who lived in different houses, 48% moved from different state. Out of people who lived in different houses, 3% moved from abroad.
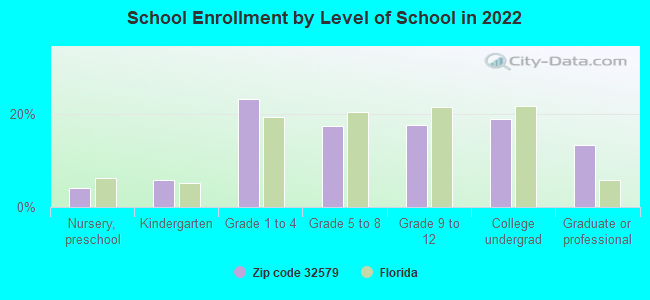
Private vs. public school enrollment:
Students in private schools in grades 1 to 8 (elementary and middle school): 215
Here:
23.4%
Florida:
15.8%
Students in private schools in grades 9 to 12 (high school): 34
Here:
8.6%
Florida:
12.9%
Students in private undergraduate colleges: 86
Here:
20.3%
Florida:
23.6%
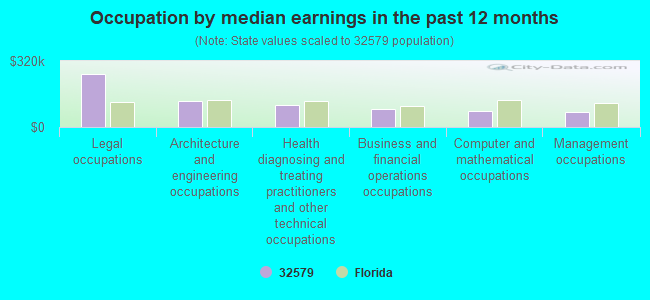
Occupation by median earnings in the past 12 months ($)
256,359Legal occupations
126,958Architecture and engineering occupations
105,754Health diagnosing and treating practitioners and other technical occupations
85,216Business and financial operations occupations
78,929Computer and mathematical occupations
73,356Management occupations
Companies with biggest federal contracts located in this zip code (SHALIMAR, FL):
COUCH CONSTRUCTION, L P (102 SUNSET LANE) : $6,999,263 in 47 contractsfrom 1999 to 2003
Contracts for Maintenance, Repair or Alteration of Real Property -- Highways, Roads, Streets, Bridges, and Railways (includes resurfacing), Maintenance, Repair or Alteration of Real Property -- Airport Runways by Air Force Signed by year:2000: $2,709,723; 2001: $3,500,725; 2002: $226,195; 2003: -$58,992; 2004: $0; 2005: $0; 2006: $0.
Biggest contracts:
$1,697,431 with Air Force for Maintenance, Repair or Alteration of Real Property -- Highways, Roads, Streets, Bridges, and Railways (includes resurfacing). Signed on 2000-08-02. Completion date: 2001-03-09.
$925,015, same as above.Signed on 2001-09-29. Completion date: 2002-01-31.
$749,998, same as above.Signed on 2001-09-27. Completion date: 2001-09-27.
$621,612 with Air Force for Maintenance, Repair or Alteration of Real Property -- Airport Runways. Signed on 1999-12-16. Completion date: 2000-01-18.
COUCH CONSTRUCTION, L P (102) : $1,365,165 in 7 contractsfrom 1999 to 2001
Contracts for Maintenance, Repair or Alteration of Real Property -- Highways, Roads, Streets, Bridges, and Railways (includes resurfacing), Maintenance, Repair or Alteration of Real Property -- Sewage and Waste Facilities, Maintenance, Repair or Alteration of Real Property -- Airport Service Roads by Air Force Signed by year:2000: $71,513; 2001: $1,270,411; 2002: $0; 2003: $0; 2004: $0; 2005: $0; 2006: $0.
Biggest contracts:
$1,244,346 with Air Force for Maintenance, Repair or Alteration of Real Property -- Highways, Roads, Streets, Bridges, and Railways (includes resurfacing). Signed on 2001-02-05. Completion date: 2001-06-24.
$71,720, same as above.Signed on 2000-09-27. Completion date: 2000-10-17.
$26,065, same as above.Signed on 2001-09-17. Completion date: 2001-11-08.
$23,241 with Air Force for Maintenance, Repair or Alteration of Real Property -- Sewage and Waste Facilities. Signed on 1999-12-06. Completion date: 2000-03-03.
FRITZ BROTHERS TREE SERVICE LL (1186 EGLIN PKWY; small business) : $1,061,000 in 5 contractsfrom 2004 to 2005
Contracts for Landscaping/Groundskeeping Services by Air Force Signed by year:2000: $0; 2001: $0; 2002: $0; 2003: $0; 2004: $861,000; 2005: $200,000; 2006: $0.
Biggest contracts:
$611,000 with Air Force for Landscaping/Groundskeeping Services. Signed on 2004-09-30. Completion date: 2004-09-30.
$250,000, same as above.Signed on 2004-09-29. Completion date: 2004-11-27.
$100,000, same as above.Signed on 2005-07-11. Completion date: 2005-09-17.
$60,000, same as above.Signed on 2005-07-11. Completion date: 2005-09-17.
TRENT, WILLIAM MD (2803 JERRY PATE COURT; small business)
$240,000 with Air Force for Dermatology Services. Signed on 2002-02-28. Completion date: 2003-03-03.
CASTEAL, CYNTHIA (40 11TH ST STE 88; small business) : $146,780 in 6 contractsfrom 2001 to 2005
Contracts for Recreational Services, Other Education and Training Services, Custodial Janitorial Services by Air Force Signed by year:2000: $0; 2001: $27,360; 2002: $27,360; 2003: $29,280; 2004: $29,280; 2005: $33,500; 2006: $0.
Biggest contracts:
$33,500 with Air Force for Recreational Services. Signed on 2005-10-01. Completion date: 2006-09-30.
$29,280 with Air Force for Other Education and Training Services. Signed on 2004-10-01. Completion date: 2005-09-30.
$29,280, same as above.Signed on 2003-10-01. Completion date: 2008-09-30.
$27,360 with Air Force for Custodial Janitorial Services. Signed on 2002-10-09. Completion date: 2003-09-30.
MCNEIL, GLORIA A (2806 JERRY PATE COURT; small business) : $126,672 in 3 contractsfrom 2004 to 2006
$42,848 with Air Force for Optometry Services. Signed on 2006-02-02. Completion date: 2007-02-01.
$42,224, same as above.Signed on 2005-02-14. Completion date: 2006-02-01.
$41,600, same as above.Signed on 2004-01-21. Completion date: 2008-09-30.
SEEKER TECHNOLOGIES INC (40 JAMES DRIVE; small business)
$69,853 with Navy for Defense Electronics and Communication Equipment -- Applied Research and Exploratory Development (R&D). Signed on 2000-03-14. Completion date: 2000-09-14.
TOP DOLLAR SOLUTIONS, INC (139 GARDNER DRIVE; small business) : $37,880 in 4 contractsfrom 2003 to 2005
$12,840 with Army for ADP Input/Output and Storage Devices. Signed on 2005-08-30. Completion date: 2005-12-20.
$10,345 with Air Force for ADP Software. Signed on 2004-06-04. Completion date: 2004-07-09.
$10,145 with Air Force for ADP Software. Taking place in SC. Signed on 2003-09-30. Completion date: 2003-11-14.
$4,550 with Air Force for ADP Software. Signed on 2005-02-24. Completion date: 2005-03-26.
BOYCE REPORTING SERVICE (84 6TH STREET; small business) : $13,500 in 3 contractsfrom 2005 to 2006
$7,000 with Defense Commissary Agency for Guard Services. Signed on 2005-08-03. Completion date: 2005-07-25.
$3,500 with Department of Defense for Guard Services. Signed on 2006-02-24. Completion date: 2006-02-14.
$3,000 with Defense Commissary Agency for Guard Services. Signed on 2005-07-22. Completion date: 2005-07-25.
OLLIE GOODWIN (79 SCHOONER LANE; small business) : $6,865 in 6 contractsfrom 2005 to 2006
Contracts for Landscaping/Groundskeeping Services by Air Force Signed by year:2000: $0; 2001: $0; 2002: $0; 2003: $0; 2004: $0; 2005: $5,470; 2006: $1,395.
Biggest contracts:
$1,410 with Air Force for Landscaping/Groundskeeping Services. Signed on 2005-05-18. Completion date: 2005-10-25.
$1,395, same as above.Signed on 2006-02-06. Completion date: 2006-02-22.
$1,270, same as above.Signed on 2005-09-29. Completion date: 2005-08-24.
$1,200, same as above.Signed on 2005-08-11. Completion date: 2005-05-26.
Top industries in this zip code by the number of employees in 2005:
Professional, Scientific, and Technical Services: Research and Development in the Physical, Engineering, and Life Sciences (100-249: 1, 50-99: 1, 10-19: 1, 5-9: 1, 1-4: 2)
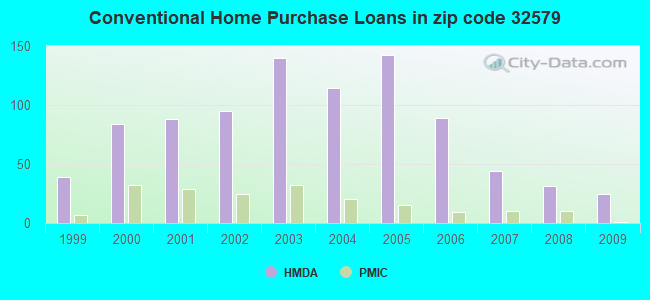
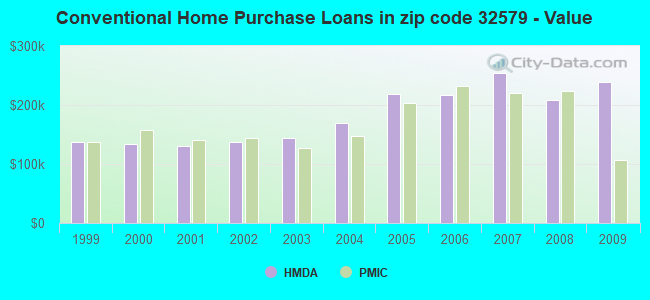
Detailed PMIC statistics for the following Tracts:0215.00
, 0216.00
2002 - 2018 National Fire Incident Reporting System (NFIRS) incidents
Based on the data from the years 2002 - 2018 the average number of fires per year is 28. The highest number of reported fire incidents - 48 took place in 2009, and the least - 15 in 2018. The data has a decreasing trend.
When looking into fire subcategories, the most reports belonged to: Structure Fires (42.3%), and Outside Fires (35.6%).
Fire incident types reported to NFIRS in Zip Code 32579


 Nearest zip codes: 32542, 32580, 32548, 32547, 32541, 32544.
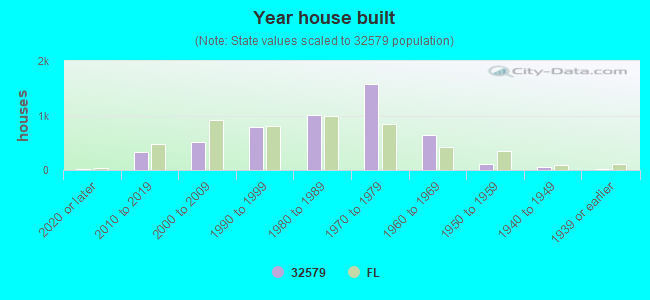


 Based on the data from the years 2002 - 2018 the average number of fires per year is 28. The highest number of reported fire incidents - 48 took place in 2009, and the least - 15 in 2018. The data has a decreasing trend.
 When looking into fire subcategories, the most reports belonged to: Structure Fires (42.3%), and Outside Fires (35.6%).