Estimated zip code population in 2022: 15,726 Zip code population in 2010: 14,295 Zip code population in 2000: 10,980
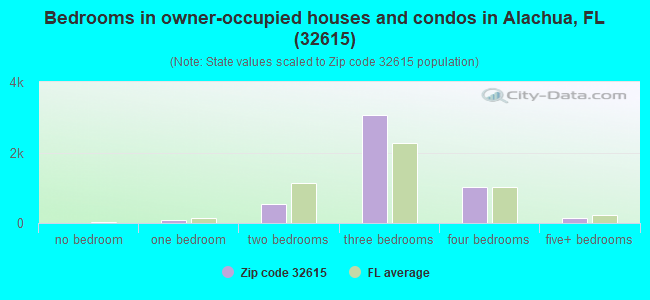
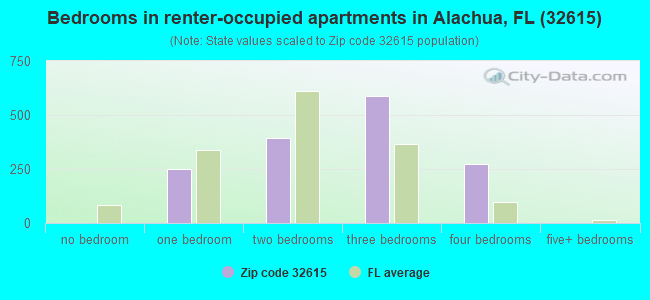
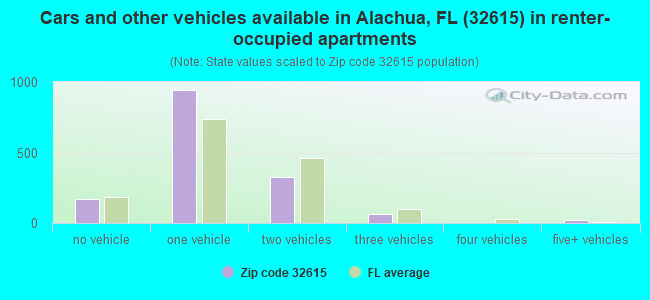
Houses and condos: 6,951 Renter-occupied apartments: 1,511
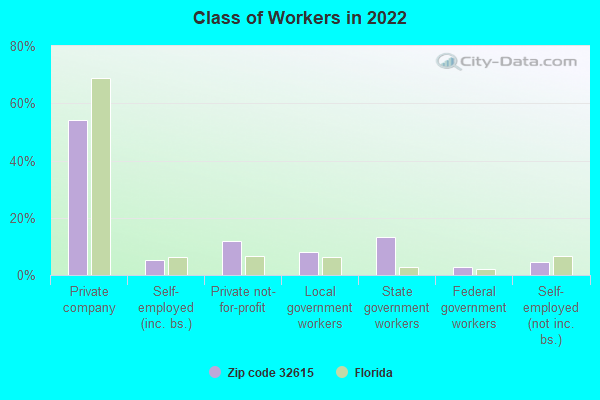
% of renters here:
24%
State:
33%
March 2022 cost of living index in zip code 32615: 83.6 (less than average, U.S. average is 100)
Land area: 138.6 sq. mi. Water area: 1.5 sq. mi.
Population density: 113 people per square mile
(very low).
OSM Map
General Map
Google Map
MSN Map
OSM Map
General Map
Google Map
MSN Map
OSM Map
General Map
Google Map
MSN Map
OSM Map
General Map
Google Map
MSN Map
Please wait while loading the map...
Real estate property taxes paid for housing units in 2022:
This zip code:
0.9% ($2,878)
Florida:
0.7% ($2,529)
Median real estate property taxes paid for housing units with mortgages in 2022: $2,917 (0.9%) Median real estate property taxes paid for housing units with no mortgage in 2022: $2,731 (0.9%)
Averages for the 2020 tax year for zip code 32615, filed in 2021:
Average Adjusted Gross Income (AGI) in 2020: $78,653 (Individual Income Tax Returns)
Here:
$78,653
State:
$82,200
Salary/wage: $60,247 (reported on 79.1% of returns)
Here:
$60,247
State:
$58,347
(% of AGI for various income ranges: 1252.1% for AGIs below $25k, 3684.0% for AGIs $25k-50k, 6479.7% for AGIs $50k-75k, 9066.2% for AGIs $75k-100k, 16339.3% for AGIs $100k-200k, 58107.5% for AGIs over 200k)
Taxable interest for individuals: $1,956 (reported on 32.3% of returns)
This zip code:
$1,956
Florida:
$4,272
(% of AGI for various income ranges: 19.1% for AGIs below $25k, 28.0% for AGIs $25k-50k, 49.4% for AGIs $50k-75k, 82.0% for AGIs $75k-100k, 137.4% for AGIs $100k-200k, 1824.2% for AGIs over 200k)
Ordinary dividends: $6,536 (reported on 19.3% of returns)
Here:
$6,536
State:
$15,863
(% of AGI for various income ranges: 32.2% for AGIs below $25k, 40.6% for AGIs $25k-50k, 125.7% for AGIs $50k-75k, 140.2% for AGIs $75k-100k, 321.8% for AGIs $100k-200k, 3543.3% for AGIs over 200k)
Net capital gain/loss in AGI: +$25,366 (reported on 17.8% of returns)
Here:
+$25,366
State:
+$62,983
(% of AGI for various income ranges: 19.4% for AGIs below $25k, 50.9% for AGIs $25k-50k, 88.2% for AGIs $50k-75k, 142.6% for AGIs $75k-100k, 562.4% for AGIs $100k-200k, 22335.8% for AGIs over 200k)
Profit/loss from business: +$8,881 (reported on 18.5% of returns)
Here:
+$8,881
State:
+$9,719
(% of AGI for various income ranges: 102.3% for AGIs below $25k, 77.1% for AGIs $25k-50k, 240.6% for AGIs $50k-75k, 305.8% for AGIs $75k-100k, 467.1% for AGIs $100k-200k, 2207.5% for AGIs over 200k)
Taxable individual retirement arrangement distribution: $18,193 (reported on 9.6% of returns)
32615:
$18,193
Florida:
$24,823
(% of AGI for various income ranges: 61.8% for AGIs below $25k, 102.6% for AGIs $25k-50k, 229.2% for AGIs $50k-75k, 269.4% for AGIs $75k-100k, 661.5% for AGIs $100k-200k, 2245.8% for AGIs over 200k)
Total itemized deductions: $36,420 (reported on 6.6% of returns)
Here:
$36,420
State:
$45,393
(% of AGI for various income ranges: 61.6% for AGIs below $25k, 121.6% for AGIs $25k-50k, 218.2% for AGIs $50k-75k, 325.6% for AGIs $75k-100k, 636.8% for AGIs $100k-200k, 6119.2% for AGIs over 200k)
Charity contributions: $16,941 (reported on 5.6% of returns)
Here:
$16,941
State:
$20,178
(% of AGI for various income ranges: 5.3% for AGIs below $25k, 21.1% for AGIs $25k-50k, 52.2% for AGIs $50k-75k, 68.0% for AGIs $75k-100k, 214.0% for AGIs $100k-200k, 3590.8% for AGIs over 200k)
Taxes paid: $6,177 (reported on 6.4% of returns)
32615:
$6,177
State:
$6,967
(% of AGI for various income ranges: 7.8% for AGIs below $25k, 15.5% for AGIs $25k-50k, 41.9% for AGIs $50k-75k, 65.8% for AGIs $75k-100k, 123.9% for AGIs $100k-200k, 860.8% for AGIs over 200k)
Earned income credit: $2,314 (reported on 16.4% of returns)
Here:
$2,314
State:
$2,306
(% of AGI for various income ranges: 110.5% for AGIs below $25k, 66.5% for AGIs $25k-50k)
Percentage of individuals using paid preparers for their 2020 taxes: 93.1%
Here:
93%
State:
92%
(% for various income ranges: 93.1% for AGIs below $25k, 93.7% for AGIs $25k-50k, 91.3% for AGIs $50k-75k, 91.8% for AGIs $75k-100k, 94.3% for AGIs $100k-200k, 94.1% for AGIs over 200k)
Averages for the 2012 tax year for zip code 32615, filed in 2013:
Average Adjusted Gross Income (AGI) in 2012: $56,185 (Individual Income Tax Returns)
Here:
$56,185
State:
$60,316
Salary/wage: $47,941 (reported on 82.7% of returns)
Here:
$47,941
State:
$45,277
(% of AGI for various income ranges: 73.5% for AGIs below $25k, 78.2% for AGIs $25k-50k, 78.8% for AGIs $50k-75k, 74.6% for AGIs $75k-100k, 73.0% for AGIs $100k-200k, 45.7% for AGIs over 200k)
Taxable interest for individuals: $2,077 (reported on 31.0% of returns)
This zip code:
$2,077
Florida:
$3,587
(% of AGI for various income ranges: 1.8% for AGIs below $25k, 1.1% for AGIs $25k-50k, 0.6% for AGIs $50k-75k, 0.8% for AGIs $75k-100k, 0.9% for AGIs $100k-200k, 2.2% for AGIs over 200k)
Ordinary dividends: $6,633 (reported on 19.2% of returns)
Here:
$6,633
State:
$12,831
(% of AGI for various income ranges: 3.2% for AGIs below $25k, 2.1% for AGIs $25k-50k, 1.3% for AGIs $50k-75k, 1.2% for AGIs $75k-100k, 2.0% for AGIs $100k-200k, 4.4% for AGIs over 200k)
Net capital gain/loss in AGI: +$8,358 (reported on 14.9% of returns)
Here:
+$8,358
State:
+$33,493
(% of AGI for various income ranges: 0.4% for AGIs $25k-50k, 0.3% for AGIs $50k-75k, 0.6% for AGIs $75k-100k, 2.1% for AGIs $100k-200k, 8.9% for AGIs over 200k)
Profit/loss from business: +$9,038 (reported on 15.6% of returns)
Here:
+$9,038
State:
+$10,012
(% of AGI for various income ranges: 9.3% for AGIs below $25k, 2.3% for AGIs $25k-50k, 2.4% for AGIs $50k-75k, 2.5% for AGIs $75k-100k, 0.9% for AGIs $100k-200k, 2.1% for AGIs over 200k)
Taxable individual retirement arrangement distribution: $16,286 (reported on 9.5% of returns)
32615:
$16,286
Florida:
$21,544
(% of AGI for various income ranges: 2.5% for AGIs below $25k, 2.6% for AGIs $25k-50k, 2.3% for AGIs $50k-75k, 3.4% for AGIs $75k-100k, 3.6% for AGIs $100k-200k, 1.4% for AGIs over 200k)
Self-employment retirement plans: $21,750 (reported on 0.3% of returns)
32615:
$21,750
Florida:
$20,611
Total itemized deductions: $21,033 (21% of AGI, reported on 27.5% of returns)
Here:
$21,033
State:
$25,533
Here:
20.9% of AGI
State:
18.0% of AGI
(% of AGI for various income ranges: 7.7% for AGIs below $25k, 10.0% for AGIs $25k-50k, 9.3% for AGIs $50k-75k, 11.6% for AGIs $75k-100k, 10.9% for AGIs $100k-200k, 10.5% for AGIs over 200k)
Charity contributions: $4,951 (reported on 21.4% of returns)
Here:
$4,951
State:
$5,698
(% of AGI for various income ranges: 0.6% for AGIs below $25k, 1.1% for AGIs $25k-50k, 1.5% for AGIs $50k-75k, 1.7% for AGIs $75k-100k, 2.0% for AGIs $100k-200k, 3.7% for AGIs over 200k)
Taxes paid: $4,653 (reported on 27.1% of returns)
32615:
$4,653
State:
$6,203
(% of AGI for various income ranges: 1.2% for AGIs below $25k, 2.0% for AGIs $25k-50k, 1.9% for AGIs $50k-75k, 2.5% for AGIs $75k-100k, 2.7% for AGIs $100k-200k, 2.3% for AGIs over 200k)
Earned income credit: $2,150 (reported on 17.3% of returns)
Here:
$2,150
State:
$2,372
(% of AGI for various income ranges: 6.1% for AGIs below $25k, 1.1% for AGIs $25k-50k)
Percentage of individuals using paid preparers for their 2012 taxes: 44.2%
Here:
44%
State:
54%
(% for various income ranges: 40.2% for AGIs below $25k, 41.8% for AGIs $25k-50k, 44.8% for AGIs $50k-75k, 43.8% for AGIs $75k-100k, 53.6% for AGIs $100k-200k, 80.0% for AGIs over 200k)
Averages for the 2004 tax year for zip code 32615, filed in 2005:
Average Adjusted Gross Income (AGI) in 2004: $52,858 (Individual Income Tax Returns)
Here:
$52,858
State:
$50,523
Salary/wage: $44,131 (reported on 84.7% of returns)
Here:
$44,131
State:
$39,563
(% of AGI for various income ranges: 173.9% for AGIs below $10k, 75.3% for AGIs $10k-25k, 82.4% for AGIs $25k-50k, 80.0% for AGIs $50k-75k, 80.3% for AGIs $75k-100k, 54.0% for AGIs over 100k)
Taxable interest for individuals: $2,080 (reported on 44.1% of returns)
This zip code:
$2,080
Florida:
$3,211
(% of AGI for various income ranges: 16.4% for AGIs below $10k, 2.5% for AGIs $10k-25k, 1.4% for AGIs $25k-50k, 1.1% for AGIs $50k-75k, 1.1% for AGIs $75k-100k, 2.0% for AGIs over 100k)
Taxable dividends: $2,983 (reported on 23.0% of returns)
Here:
$2,983
State:
$6,129
(% of AGI for various income ranges: 3.9% for AGIs below $10k, 1.4% for AGIs $10k-25k, 1.1% for AGIs $25k-50k, 0.7% for AGIs $50k-75k, 1.3% for AGIs $75k-100k, 1.6% for AGIs over 100k)
Net capital gain/loss: +$9,275 (reported on 20.0% of returns)
Here:
+$9,275
State:
+$27,205
(% of AGI for various income ranges: 1.3% for AGIs below $10k, 0.9% for AGIs $10k-25k, 0.9% for AGIs $25k-50k, 1.5% for AGIs $50k-75k, 2.5% for AGIs $75k-100k, 6.5% for AGIs over 100k)
Profit/loss from business: +$9,716 (reported on 17.1% of returns)
Here:
+$9,716
State:
+$10,634
(% of AGI for various income ranges: 1.8% for AGIs below $10k, 7.8% for AGIs $10k-25k, 2.7% for AGIs $25k-50k, 2.6% for AGIs $50k-75k, 1.8% for AGIs $75k-100k, 3.4% for AGIs over 100k)
IRA payment deduction: $3,032 (reported on 2.7% of returns)
32615:
$3,032
Florida:
$3,082
(% of AGI for various income ranges: 0.2% for AGIs $10k-25k, 0.3% for AGIs $25k-50k, 0.1% for AGIs $50k-75k, 0.1% for AGIs $75k-100k, 0.1% for AGIs over 100k)
Self-employed pension: $8,357 (reported on 0.6% of returns)
Here:
$8,357
Florida:
$15,857
Total itemized deductions: $17,357 (19% of AGI, reported on 33.8% of returns)
Here:
$17,357
State:
$20,370
Here:
19.2% of AGI
State:
20.7% of AGI
(% of AGI for various income ranges: 20.6% for AGIs below $10k, 7.7% for AGIs $10k-25k, 11.9% for AGIs $25k-50k, 12.0% for AGIs $50k-75k, 13.5% for AGIs $75k-100k, 9.6% for AGIs over 100k)
Charity contributions deductions: $4,407 (5% of AGI, reported on 27.6% of returns)
Here:
$4,407
State:
$4,064
Here:
4.6% of AGI
State:
3.8% of AGI
(% of AGI for various income ranges: 0.8% for AGIs below $10k, 0.7% for AGIs $10k-25k, 1.6% for AGIs $25k-50k, 1.7% for AGIs $50k-75k, 2.4% for AGIs $75k-100k, 3.1% for AGIs over 100k)
Total tax: $8,393 (reported on 78.6% of returns)
32615:
$8,393
State:
$9,431
(% of AGI for various income ranges: 5.0% for AGIs below $10k, 4.2% for AGIs $10k-25k, 7.1% for AGIs $25k-50k, 9.0% for AGIs $50k-75k, 10.6% for AGIs $75k-100k, 18.9% for AGIs over 100k)
Earned income credit: $1,826 (reported on 13.9% of returns)
Here:
$1,826
State:
$1,808
Percentage of individuals using paid preparers for their 2004 taxes: 53.8%
Here:
54%
State:
60%
(% for various income ranges: 51.2% for AGIs below $10k, 55.9% for AGIs $10k-25k, 49.0% for AGIs $25k-50k, 53.4% for AGIs $50k-75k, 54.6% for AGIs $75k-100k, 65.3% for AGIs over 100k)
Likely homosexual households (counted as self-reported same-sex unmarried-partner households)
Lesbian couples: 0.2% of all households
Gay men: 0.1% of all households
Household received Food Stamps/SNAP in the past 12 months: 593 Household did not receive Food Stamps/SNAP in the past 12 months: 5,750
Women who had a birth in the past 12 months: 115 (110 now married, 9 unmarried) Women who did not have a birth in the past 12 months: 3,721 (1,655 now married, 2,066 unmarried)
Housing units in zip code 32615 with a mortgage: 3,188 (443 second mortgage, 83 home equity loan, 370 both second mortgage and home equity loan) Houses without a mortgage: 30
Median monthly owner costs for units with a mortgage: $1,577 Median monthly owner costs for units without a mortgage: $536
Residents with income below the poverty level in 2022:
This zip code:
9.9%
Whole state:
12.7%
Residents with income below 50% of the poverty level in 2022:
This zip code:
6.0%
Whole state:
6.6%
Median number of rooms in houses and condos:
Here:
6.0
State:
5.9
Median number of rooms in apartments:
Here:
5.1
State:
4.2
Notable locations in this zip code not listed on our city pages
Notable locations in zip code 32615: South High Springs Railroad Station (A), Turkey Creek Golf and Country Club (B), Alachua County Library - Alachua Branch (C), Alachua Police Department (D), Alachua County Fire Rescue Station 21 (E). Display/hide their locations on the map
Churches in zip code 32615 include: St. Johns United Methodist Church (A), New Saint Mary Missionary Baptist Church (B), Saint Matthew Baptist Church (C), Saint Ponds Church (D), North Pleasant Grove Baptist Church (E), New Oak Grove Baptist Church (F), Greater New Hope Missionary Baptist Church (G), New Hope Church (H), Old Shiloh Missionary Baptist Church (I). Display/hide their locations on the map
Cemeteries: Richard Family Cemetery (1), St. Johns Cemetery (2), Spring Hill Cemetery (3), Old Thomas Cemetery (4), Cathcart Cemetery (5), Newnansville Cemetery (6), New Hope Cemetery (7). Display/hide their locations on the map
In group quarters: 40 (-1 institutionalized population)
Size of family households: 1,956 2-persons, 1,316 3-persons, 599 4-persons, 160 5-persons, 140 6-persons, 133 7-or-more-persons
Size of nonfamily households: 1,896 1-person, 102 2-persons, 12 3-persons
2,466 married couples with children.
787 single-parent households (160 men, 627 women).
91.3% of residents of 32615 zip code speak English at home.
5.0% of residents speak Spanish at home (80% very well, 17% well, 3% not well).
2.8% of residents speak other Indo-European language at home (73% very well, 19% well, 8% not well).
0.4% of residents speak Asian or Pacific Island language at home (59% very well, 41% well).
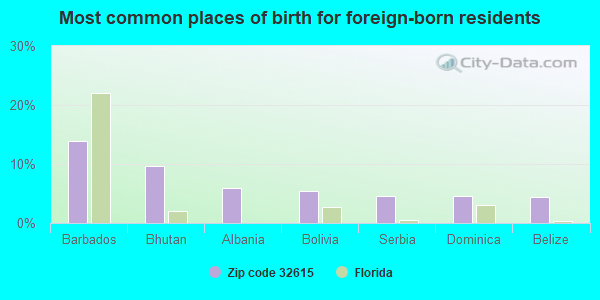
Foreign born population: 943 (6.0%) (69.4% of them are naturalized citizens)
This zip code:
6.0%
Whole state:
21.7%
14%Barbados
10%Bhutan
6%Albania
5%Bolivia
5%Serbia
5%Dominica
4%Belize
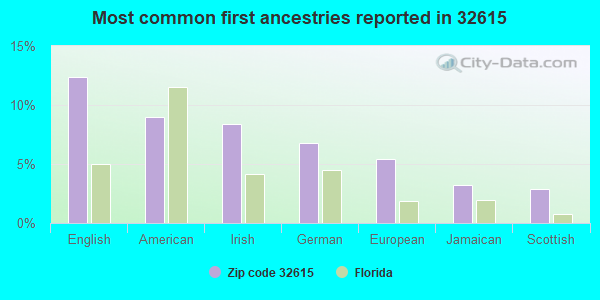
12%English
9%American
8%Irish
7%German
5%European
3%Jamaican
3%Scottish
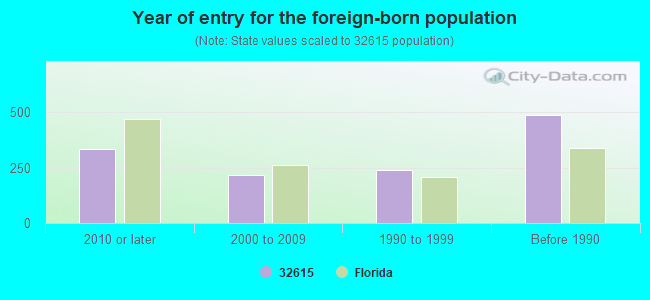
Year of entry for the foreign-born population
3352010 or later
2182000 to 2009
2381990 to 1999
488Before 1990
Major facilities with environmental interests located in this zip code:
HUNTER MARINE CORPORATION (14700 NORTHWEST US HIGHWAY 441 in ALACHUA, FL)
AIR MAJOR (AIRS/AFS) CRITERIA AND HAZARDOUS AIR POLLUTANT INVENTORY (Inventory of air pollution sources) National Pollutant Discharge Elimination System NON-MAJOR (Tracking pollutant discharge elimination systems) - permit HAZARDOUS WASTE BIENNIAL REPORTER (Resource Conservation and Recovery Act (tracking hazardous waste)) Large Quantity Generators, more that 1000 kg of hazardous waste/month (Resource Conservation and Recovery Act (tracking hazardous waste)) TRI REPORTER (Tracking of toxic chemicals releasing facilities) Business SIC classification: BOAT BUILDING AND REPAIRING Organizations: DANIEL JETT (CONTACT/OWNER)
Alternative names: HUNTER MARINE CORP.
ALACHUA ELEMENTARY SCHOOL (13800 NW 152 PLACE in ALACHUA, FL)
(Geographic Names Information System) (National Center for Education Statistics) - STATE ID-0161 Organizations: ALACHUA COUNTY SCHOOL DISTRICT (SCHOOL DISTRICT)
SANTA FE HIGH SCHOOL (16331 NW US HWY 441 in ALACHUA, FL)
(Geographic Names Information System) (National Center for Education Statistics) - STATE ID-0271 Organizations: ALACHUA COUNTY SCHOOL DISTRICT (SCHOOL DISTRICT)
A. L. MEBANE MIDDLE SCHOOL (16401 NW 140TH STREET in ALACHUA, FL)
(National Center for Education Statistics) - STATE ID-0221 Organizations: ALACHUA COUNTY SCHOOL DISTRICT (SCHOOL DISTRICT)
REGENERATION TECHNOLOGIES INC. (11621 RESEARCH CIRCLE in ALACHUA, FL)
Large Quantity Generators, more that 1000 kg of hazardous waste/month (Resource Conservation and Recovery Act (tracking hazardous waste)) - notification TRI REPORTER (Tracking of toxic chemicals releasing facilities) Business SIC classification: ORTHOPEDIC, PROSTHETIC, AND SURGICAL APPLIANCES AND SUPPLIES Business NAICS classification: SURGICAL APPLIANCE AND SUPPLIES MANUFACTURING. Organizations: REGENERATION TECHNOLOGIES, INC (CONTACT/OPERATOR)
ALACHUA BP SERVICE (INTERSTATE 75 AND US HIGHWAY 441 in ALACHUA, FL)
National Pollutant Discharge Elimination System NON-MAJOR (Tracking pollutant discharge elimination systems) - permit Small Quantity Generators, between 100 kg and 1000 kg of hazardous waste/month (Resource Conservation and Recovery Act (tracking hazardous waste)) - notification Business SIC classification: GASOLINE SERVICE STATIONS Organizations: EARL NOLAN, OWNER (CONTACT/OWNER)
Alternative names: BP OIL COMPANY, GULF SERVICE STA NO 23963
JOHN C. HIPP CONSTRUCTION CO. ALACHUA (14610 NW 129TH TER in ALACHUA, FL)
AIR MINOR (AIRS/AFS) CRITERIA AND HAZARDOUS AIR POLLUTANT INVENTORY (Inventory of air pollution sources) Business SIC classification: ASPHALT PAVING MIXTURES AND BLOCKS
ALCHEM LABORATORIES CORP. (13305 RACHAEL BLVD in ALACHUA, FL)
Large Quantity Generators, more that 1000 kg of hazardous waste/month (Resource Conservation and Recovery Act (tracking hazardous waste)) Organizations: EMIL POP (CONTACT/OWNER)
ACR ENVIRONMENTAL SERVICES (13101 RACHEL BLVD in ALACHUA, FL)
(Resource Conservation and Recovery Act (tracking hazardous waste)) Organizations: CHARLIE JORDAN, VP (CONTACT/OWNER)
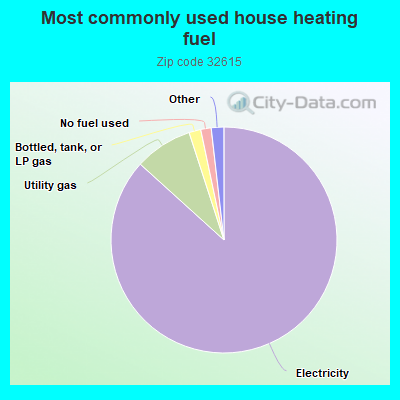
Housing units lacking complete kitchen facilities: 4.3%
86.8%Electricity
8.3%Utility gas
1.7%Bottled, tank, or LP gas
1.5%No fuel used
1.0%Wood
0.7%Other fuel
Population in 1990: 9,414. Population change in the 1990s: +1,566 (+16.6%).
Place of birth for U.S.-born residents:
This state: 8,280
Northeast: 2,041
Midwest: 1,884
South: 1,647
West: 448
55% of the 32615 zip code residents lived in the same house 5 years ago. Out of people who lived in different houses, 63% lived in this county. Out of people who lived in different counties, 50% lived in Florida.
92% of the 32615 zip code residents lived in the same house 1 year ago. Out of people who lived in different houses, 40% moved from this county. Out of people who lived in different houses, 27% moved from different county within same state. Out of people who lived in different houses, 22% moved from different state. Out of people who lived in different houses, 16% moved from abroad.
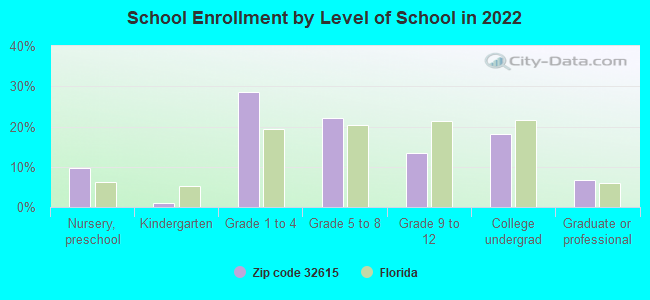
Private vs. public school enrollment:
Students in private schools in grades 1 to 8 (elementary and middle school): 595
Here:
32.0%
Florida:
15.8%
Students in private schools in grades 9 to 12 (high school): 145
Here:
29.8%
Florida:
12.9%
Students in private undergraduate colleges: 125
Here:
19.3%
Florida:
23.6%
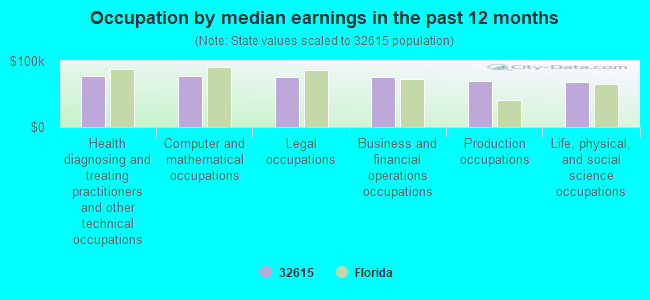
Occupation by median earnings in the past 12 months ($)
77,284Health diagnosing and treating practitioners and other technical occupations
76,664Computer and mathematical occupations
75,597Legal occupations
75,336Business and financial operations occupations
69,715Production occupations
67,771Life, physical, and social science occupations
Companies with federal contracts located in this zip code (ALACHUA, FL):
LUCAYA INDUSTRIES, INC (13101 RACHEL BLVD; small business) : $959,804 in 47 contractsfrom 2000 to 2006
Contracts for Switches, Pipe, Tube and Rigid Tubing, Structural Shapes, Circuit Breakers, and moreby Defense Logistics Agency, Army Signed by year:2000: $30,848; 2001: $151,162; 2002: $126,186; 2003: $139,439; 2004: $326,403; 2005: $155,177; 2006: $30,589.
Biggest contracts:
$99,760 with Defense Logistics Agency for Switches. Signed on 2004-01-29. Completion date: 2004-03-14.
$93,432 with Defense Logistics Agency for Pipe, Tube and Rigid Tubing. Signed on 2004-07-28. Completion date: 2004-10-26.
$82,320 with Defense Logistics Agency for Switches. Signed on 2003-12-27. Completion date: 2004-02-25.
$55,566, same as above.Signed on 2004-01-02. Completion date: 2004-02-25.
MOLTECH POWER SYSTEMS, INC (12801 NW HIGHWAY 441; small business)
$369,349 with Air Force for Batteries, Rechargeable. Signed on 2001-03-21. Completion date: 2001-05-31.
INTERMED ULTRASOUND SERVICES, (13351 PROGRESS BLVD; small business) : $141,595 in 17 contractsfrom 2000 to 2006
Contracts for Maintenance, Repair and Rebuilding of Equipment -- Medical, Dental, and Veterinary Equipment and Supplies, Engineering and Technical Services, Radiology Services by Department of Veterans Affairs, Navy Signed by year:2000: $42,000; 2001: $0; 2002: $0; 2003: $27,614; 2004: $36,599; 2005: $25,332; 2006: $10,050.
Biggest contracts:
$42,000 with Department of Veterans Affairs for Maintenance, Repair and Rebuilding of Equipment -- Medical, Dental, and Veterinary Equipment and Supplies. Taking place in MN. Signed on 2000-10-15. Completion date: 2001-09-15.
$33,849 with Department of Veterans Affairs for Engineering and Technical Services. Signed on 2004-09-10. Effective on 2004-09-13. Completion date: 2004-12-10.
$18,230 with Navy for Maintenance, Repair and Rebuilding of Equipment -- Medical, Dental, and Veterinary Equipment and Supplies. Signed on 2003-10-28. Completion date: 2003-10-01.
$12,499 with Department of Veterans Affairs for Engineering and Technical Services. Signed on 2005-03-17. Effective on 2005-03-14. Completion date: 2005-05-06.
BANYAN BIOMARKERS INC (12085 RESEARCH DR; small business)
$99,685 with Army for Other Medical -- Basic Research (R&D). Signed on 2005-08-26. Completion date: 2006-03-29.
SCHNEIDER LABORATORIES LTD (1663 TECHNOLOGY AVE; small business)
$29,961 with Air Force for Defense Aircraft -- Management and Support (R&D). Signed on 2000-06-19. Completion date: 2000-09-30.
SEATEK (7215 NW 214TH ST; small business)
$14,700 with U.S. Army Corps of Engineers - civil program financing only for Microcircuits, Electronic. Signed on 2002-09-06. Completion date: 2002-09-30.
MCDAVID ROOFING INC (US HIGHWAY 441; small business) 12 employees, $790000 revenue. Woman Owned Business
$12,000 with Agricultural Research Service (disused code) for Maintenance, Repair or Alteration of Real Property -- Government-Owned Government-Operated (GOGO) R&D Facilities. Signed on 2002-09-15. Completion date: 2002-11-15.
CONTROL PANEL DESIGN (1320 RACHAEL BLVD SW 4; small business)
$10,810 with Air Force for ADP Components. Signed on 2005-09-30. Completion date: 2005-11-11.
Top industries in this zip code by the number of employees in 2005:
Professional, Scientific, and Technical Services: Research and Development in the Physical, Engineering, and Life Sciences (250-499 employees: 1 establishment, 100-249 employees: 1 establishment, 20-49 employees: 1 establishment, 10-19 employees: 2 establishments, 5-9 employees: 2 establishments, 1-4 employees: 10 establishments)
2002 - 2018 National Fire Incident Reporting System (NFIRS) incidents
Based on the data from the years 2002 - 2018 the average number of fire incidents per year is 66. The highest number of reported fires - 124 took place in 2006, and the least - 13 in 2002. The data has a growing trend.
When looking into fire subcategories, the most incidents belonged to: Outside Fires (56.1%), and Structure Fires (21.4%).
Fire incident types reported to NFIRS in Zip Code 32615


 Nearest zip codes: 32616, 32658, 32653, 32697, 32606, 32643.
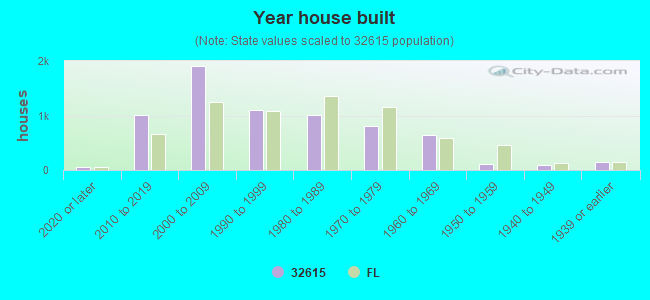


 Based on the data from the years 2002 - 2018 the average number of fire incidents per year is 66. The highest number of reported fires - 124 took place in 2006, and the least - 13 in 2002. The data has a growing trend.
 When looking into fire subcategories, the most incidents belonged to: Outside Fires (56.1%), and Structure Fires (21.4%).