Estimated zip code population in 2022: 23,458 Zip code population in 2010: 19,928 Zip code population in 2000: 18,114
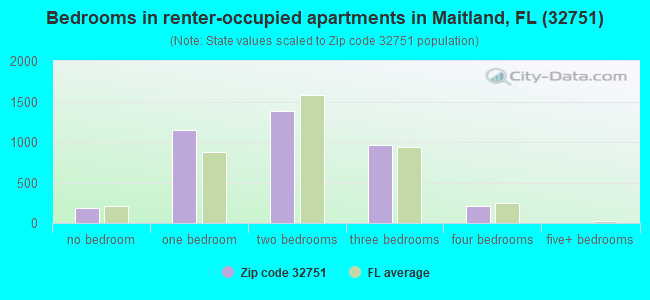
Houses and condos: 11,018 Renter-occupied apartments: 3,898
% of renters here:
38%
State:
33%
March 2022 cost of living index in zip code 32751: 93.0 (less than average, U.S. average is 100)
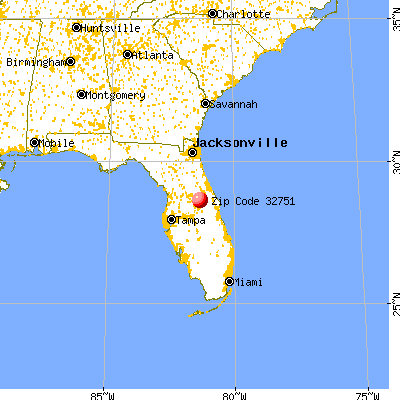
Land area: 7.0 sq. mi. Water area: 1.2 sq. mi.
Population density: 3,329 people per square mile
(average).
OSM Map
General Map
Google Map
MSN Map
OSM Map
General Map
Google Map
MSN Map
OSM Map
General Map
Google Map
MSN Map
OSM Map
General Map
Google Map
MSN Map
Please wait while loading the map...
Real estate property taxes paid for housing units in 2022:
This zip code:
0.6% ($3,005)
Florida:
0.7% ($2,529)
Median real estate property taxes paid for housing units with mortgages in 2022: $3,468 (0.7%) Median real estate property taxes paid for housing units with no mortgage in 2022: $2,352 (0.5%)
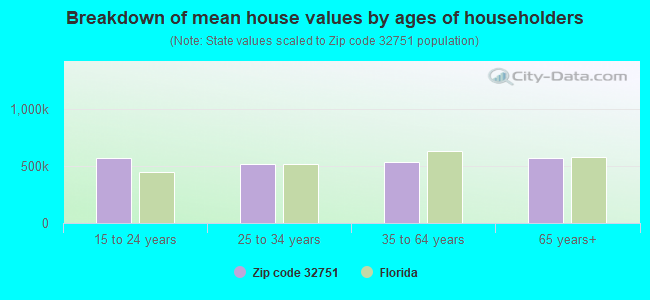
Estimated median house/condo value in 2022: $488,008
32751:
$488,008
Florida:
$354,100
According to our research of Florida and other state lists, there were 8 registered sex offenders living in 32751 zip code as of April 26, 2024. The ratio of all residents to sex offenders in zip code 32751 is 2,712 to 1. The ratio of registered sex offenders to all residents in this zip code is much lower than the state average.
Median resident age:
This zip code:
40.5 years
Florida median age:
42.7 years
Average household size:
This zip code:
2.3 people
Florida:
2.5 people
Averages for the 2020 tax year for zip code 32751, filed in 2021:
Average Adjusted Gross Income (AGI) in 2020: $111,230 (Individual Income Tax Returns)
Here:
$111,230
State:
$82,200
Salary/wage: $87,344 (reported on 80.0% of returns)
Here:
$87,344
State:
$58,347
(% of AGI for various income ranges: 1296.2% for AGIs below $25k, 3738.5% for AGIs $25k-50k, 6852.5% for AGIs $50k-75k, 10198.4% for AGIs $75k-100k, 20567.1% for AGIs $100k-200k, 91413.1% for AGIs over 200k)
Taxable interest for individuals: $4,195 (reported on 33.8% of returns)
This zip code:
$4,195
Florida:
$4,272
(% of AGI for various income ranges: 26.7% for AGIs below $25k, 30.1% for AGIs $25k-50k, 64.1% for AGIs $50k-75k, 140.1% for AGIs $75k-100k, 218.3% for AGIs $100k-200k, 2830.2% for AGIs over 200k)
Ordinary dividends: $9,636 (reported on 30.8% of returns)
Here:
$9,636
State:
$15,863
(% of AGI for various income ranges: 57.0% for AGIs below $25k, 71.2% for AGIs $25k-50k, 171.8% for AGIs $50k-75k, 336.3% for AGIs $75k-100k, 816.7% for AGIs $100k-200k, 4879.5% for AGIs over 200k)
Net capital gain/loss in AGI: +$30,439 (reported on 29.7% of returns)
Here:
+$30,439
State:
+$62,983
(% of AGI for various income ranges: 27.6% for AGIs below $25k, 76.9% for AGIs $25k-50k, 165.1% for AGIs $50k-75k, 311.8% for AGIs $75k-100k, 982.3% for AGIs $100k-200k, 21825.7% for AGIs over 200k)
Profit/loss from business: +$16,052 (reported on 21.5% of returns)
Here:
+$16,052
State:
+$9,719
(% of AGI for various income ranges: 139.3% for AGIs below $25k, 206.4% for AGIs $25k-50k, 296.0% for AGIs $50k-75k, 644.3% for AGIs $75k-100k, 848.9% for AGIs $100k-200k, 4292.4% for AGIs over 200k)
Taxable individual retirement arrangement distribution: $25,632 (reported on 9.6% of returns)
32751:
$25,632
Florida:
$24,823
(% of AGI for various income ranges: 57.9% for AGIs below $25k, 108.6% for AGIs $25k-50k, 240.5% for AGIs $50k-75k, 444.0% for AGIs $75k-100k, 1067.6% for AGIs $100k-200k, 2356.9% for AGIs over 200k)
Self-employed (Keogh) retirement plans: $22,282 (reported on 0.9% of returns)
32751:
$22,282
Florida:
$29,694
(% of AGI for various income ranges: 80.0% for AGIs $75k-100k, 456.0% for AGIs over 200k)
Total itemized deductions: $41,883 (reported on 11.4% of returns)
Here:
$41,883
State:
$45,393
(% of AGI for various income ranges: 77.7% for AGIs below $25k, 113.5% for AGIs $25k-50k, 310.2% for AGIs $50k-75k, 545.4% for AGIs $75k-100k, 1021.7% for AGIs $100k-200k, 8491.7% for AGIs over 200k)
Charity contributions: $19,548 (reported on 9.7% of returns)
Here:
$19,548
State:
$20,178
(% of AGI for various income ranges: 7.2% for AGIs below $25k, 21.6% for AGIs $25k-50k, 53.7% for AGIs $50k-75k, 136.6% for AGIs $75k-100k, 303.0% for AGIs $100k-200k, 4160.7% for AGIs over 200k)
Taxes paid: $6,829 (reported on 11.3% of returns)
32751:
$6,829
State:
$6,967
(% of AGI for various income ranges: 8.2% for AGIs below $25k, 23.0% for AGIs $25k-50k, 53.2% for AGIs $50k-75k, 106.3% for AGIs $75k-100k, 212.6% for AGIs $100k-200k, 1231.2% for AGIs over 200k)
Earned income credit: $1,996 (reported on 11.9% of returns)
Here:
$1,996
State:
$2,306
(% of AGI for various income ranges: 84.3% for AGIs below $25k, 47.8% for AGIs $25k-50k)
Percentage of individuals using paid preparers for their 2020 taxes: 92.5%
Here:
92%
State:
92%
(% for various income ranges: 91.2% for AGIs below $25k, 93.2% for AGIs $25k-50k, 92.9% for AGIs $50k-75k, 91.7% for AGIs $75k-100k, 93.2% for AGIs $100k-200k, 93.4% for AGIs over 200k)
Averages for the 2012 tax year for zip code 32751, filed in 2013:
Average Adjusted Gross Income (AGI) in 2012: $85,788 (Individual Income Tax Returns)
Here:
$85,788
State:
$60,316
Salary/wage: $69,438 (reported on 80.7% of returns)
Here:
$69,438
State:
$45,277
(% of AGI for various income ranges: 72.4% for AGIs below $25k, 78.1% for AGIs $25k-50k, 75.1% for AGIs $50k-75k, 72.1% for AGIs $75k-100k, 73.5% for AGIs $100k-200k, 53.9% for AGIs over 200k)
Taxable interest for individuals: $2,957 (reported on 39.3% of returns)
This zip code:
$2,957
Florida:
$3,587
(% of AGI for various income ranges: 1.9% for AGIs below $25k, 0.9% for AGIs $25k-50k, 1.1% for AGIs $50k-75k, 1.2% for AGIs $75k-100k, 1.0% for AGIs $100k-200k, 1.7% for AGIs over 200k)
Ordinary dividends: $8,821 (reported on 31.3% of returns)
Here:
$8,821
State:
$12,831
(% of AGI for various income ranges: 3.9% for AGIs below $25k, 2.5% for AGIs $25k-50k, 2.9% for AGIs $50k-75k, 3.0% for AGIs $75k-100k, 2.6% for AGIs $100k-200k, 3.7% for AGIs over 200k)
Net capital gain/loss in AGI: +$18,512 (reported on 27.9% of returns)
Here:
+$18,512
State:
+$33,493
(% of AGI for various income ranges: 0.6% for AGIs $25k-50k, 1.0% for AGIs $50k-75k, 0.7% for AGIs $75k-100k, 1.7% for AGIs $100k-200k, 12.4% for AGIs over 200k)
Profit/loss from business: +$14,818 (reported on 18.7% of returns)
Here:
+$14,818
State:
+$10,012
(% of AGI for various income ranges: 9.9% for AGIs below $25k, 3.5% for AGIs $25k-50k, 2.2% for AGIs $50k-75k, 3.3% for AGIs $75k-100k, 2.9% for AGIs $100k-200k, 2.9% for AGIs over 200k)
Taxable individual retirement arrangement distribution: $23,525 (reported on 13.3% of returns)
32751:
$23,525
Florida:
$21,544
(% of AGI for various income ranges: 4.0% for AGIs below $25k, 2.6% for AGIs $25k-50k, 3.3% for AGIs $50k-75k, 4.1% for AGIs $75k-100k, 4.0% for AGIs $100k-200k, 3.7% for AGIs over 200k)
Self-employment retirement plans: $18,470 (reported on 1.0% of returns)
32751:
$18,470
Florida:
$20,611
(% of AGI for various income ranges: 0.3% for AGIs $25k-50k, 0.3% for AGIs $100k-200k, 0.3% for AGIs over 200k)
Total itemized deductions: $25,946 (16% of AGI, reported on 35.9% of returns)
Here:
$25,946
State:
$25,533
Here:
15.8% of AGI
State:
18.0% of AGI
(% of AGI for various income ranges: 11.4% for AGIs below $25k, 11.0% for AGIs $25k-50k, 16.0% for AGIs $50k-75k, 12.1% for AGIs $75k-100k, 12.6% for AGIs $100k-200k, 8.4% for AGIs over 200k)
Charity contributions: $6,200 (reported on 30.7% of returns)
Here:
$6,200
State:
$5,698
(% of AGI for various income ranges: 1.0% for AGIs below $25k, 1.4% for AGIs $25k-50k, 1.8% for AGIs $50k-75k, 1.8% for AGIs $75k-100k, 2.2% for AGIs $100k-200k, 2.7% for AGIs over 200k)
Taxes paid: $5,683 (reported on 35.4% of returns)
32751:
$5,683
State:
$6,203
(% of AGI for various income ranges: 1.8% for AGIs below $25k, 1.6% for AGIs $25k-50k, 2.4% for AGIs $50k-75k, 2.4% for AGIs $75k-100k, 2.8% for AGIs $100k-200k, 2.3% for AGIs over 200k)
Earned income credit: $2,094 (reported on 13.8% of returns)
Here:
$2,094
State:
$2,372
(% of AGI for various income ranges: 5.8% for AGIs below $25k, 0.7% for AGIs $25k-50k)
Percentage of individuals using paid preparers for their 2012 taxes: 51.8%
Here:
52%
State:
54%
(% for various income ranges: 46.9% for AGIs below $25k, 46.3% for AGIs $25k-50k, 51.4% for AGIs $50k-75k, 52.2% for AGIs $75k-100k, 57.4% for AGIs $100k-200k, 76.9% for AGIs over 200k)
Averages for the 2004 tax year for zip code 32751, filed in 2005:
Average Adjusted Gross Income (AGI) in 2004: $85,417 (Individual Income Tax Returns)
Here:
$85,417
State:
$50,523
Salary/wage: $62,193 (reported on 79.7% of returns)
Here:
$62,193
State:
$39,563
(% of AGI for various income ranges: 207.6% for AGIs below $10k, 74.4% for AGIs $10k-25k, 75.9% for AGIs $25k-50k, 71.4% for AGIs $50k-75k, 71.8% for AGIs $75k-100k, 50.4% for AGIs over 100k)
Taxable interest for individuals: $3,047 (reported on 52.8% of returns)
This zip code:
$3,047
Florida:
$3,211
(% of AGI for various income ranges: 15.0% for AGIs below $10k, 2.8% for AGIs $10k-25k, 2.1% for AGIs $25k-50k, 2.0% for AGIs $50k-75k, 1.6% for AGIs $75k-100k, 1.7% for AGIs over 100k)
Taxable dividends: $4,985 (reported on 38.5% of returns)
Here:
$4,985
State:
$6,129
(% of AGI for various income ranges: 21.7% for AGIs below $10k, 3.0% for AGIs $10k-25k, 2.4% for AGIs $25k-50k, 2.7% for AGIs $50k-75k, 2.2% for AGIs $75k-100k, 2.0% for AGIs over 100k)
Net capital gain/loss: +$27,563 (reported on 32.7% of returns)
Here:
+$27,563
State:
+$27,205
(% of AGI for various income ranges: 2.7% for AGIs below $10k, 1.3% for AGIs $10k-25k, 0.5% for AGIs $25k-50k, 2.1% for AGIs $50k-75k, 1.8% for AGIs $75k-100k, 14.7% for AGIs over 100k)
Profit/loss from business: +$17,123 (reported on 17.7% of returns)
Here:
+$17,123
State:
+$10,634
(% of AGI for various income ranges: 19.2% for AGIs below $10k, 6.3% for AGIs $10k-25k, 3.3% for AGIs $25k-50k, 3.9% for AGIs $50k-75k, 4.1% for AGIs $75k-100k, 3.2% for AGIs over 100k)
IRA payment deduction: $3,455 (reported on 3.8% of returns)
32751:
$3,455
Florida:
$3,082
(% of AGI for various income ranges: 1.0% for AGIs below $10k, 0.3% for AGIs $10k-25k, 0.3% for AGIs $25k-50k, 0.3% for AGIs $50k-75k, 0.2% for AGIs $75k-100k, 0.1% for AGIs over 100k)
Self-employed pension: $16,184 (reported on 1.4% of returns)
Here:
$16,184
Florida:
$15,857
(% of AGI for various income ranges: 0.1% for AGIs $25k-50k, 0.2% for AGIs $50k-75k, 0.3% for AGIs $75k-100k, 0.3% for AGIs over 100k)
Total itemized deductions: $21,019 (14% of AGI, reported on 41.8% of returns)
Here:
$21,019
State:
$20,370
Here:
14.4% of AGI
State:
20.7% of AGI
(% of AGI for various income ranges: 41.1% for AGIs below $10k, 13.6% for AGIs $10k-25k, 14.9% for AGIs $25k-50k, 16.2% for AGIs $50k-75k, 16.1% for AGIs $75k-100k, 7.8% for AGIs over 100k)
Charity contributions deductions: $5,276 (3% of AGI, reported on 37.2% of returns)
Here:
$5,276
State:
$4,064
Here:
3.4% of AGI
State:
3.8% of AGI
(% of AGI for various income ranges: 2.2% for AGIs below $10k, 1.5% for AGIs $10k-25k, 2.0% for AGIs $25k-50k, 2.3% for AGIs $50k-75k, 2.7% for AGIs $75k-100k, 2.3% for AGIs over 100k)
Total tax: $19,094 (reported on 79.5% of returns)
32751:
$19,094
State:
$9,431
(% of AGI for various income ranges: 7.3% for AGIs below $10k, 4.6% for AGIs $10k-25k, 7.5% for AGIs $25k-50k, 10.0% for AGIs $50k-75k, 10.9% for AGIs $75k-100k, 21.9% for AGIs over 100k)
Earned income credit: $1,623 (reported on 10.6% of returns)
Here:
$1,623
State:
$1,808
Percentage of individuals using paid preparers for their 2004 taxes: 57.8%
Here:
58%
State:
60%
(% for various income ranges: 53.9% for AGIs below $10k, 55.7% for AGIs $10k-25k, 53.5% for AGIs $25k-50k, 55.3% for AGIs $50k-75k, 55.3% for AGIs $75k-100k, 71.4% for AGIs over 100k)
Likely homosexual households (counted as self-reported same-sex unmarried-partner households)
Lesbian couples: 0.1% of all households
Gay men: 0.0% of all households
Household received Food Stamps/SNAP in the past 12 months: 449 Household did not receive Food Stamps/SNAP in the past 12 months: 9,952
Women who had a birth in the past 12 months: 346 (299 now married, 56 unmarried) Women who did not have a birth in the past 12 months: 5,226 (2,120 now married, 3,105 unmarried)
Housing units in zip code 32751 with a mortgage: 4,024 (461 second mortgage, 51 home equity loan, 372 both second mortgage and home equity loan) Houses without a mortgage: 45
Median monthly owner costs for units with a mortgage: $2,163 Median monthly owner costs for units without a mortgage: $737
Residents with income below the poverty level in 2022:
This zip code:
9.3%
Whole state:
12.7%
Residents with income below 50% of the poverty level in 2022:
This zip code:
5.0%
Whole state:
6.6%
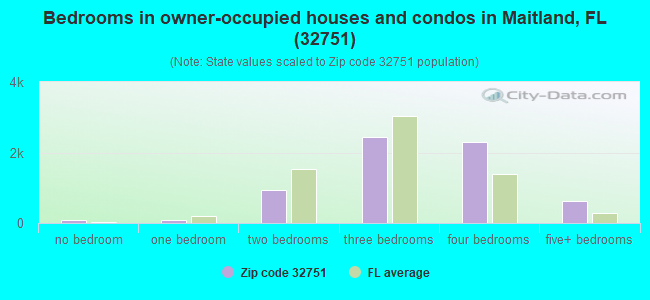
Median number of rooms in houses and condos:
Here:
7.0
State:
5.9
Median number of rooms in apartments:
Here:
4.1
State:
4.2
Notable locations in this zip code not listed on our city pages
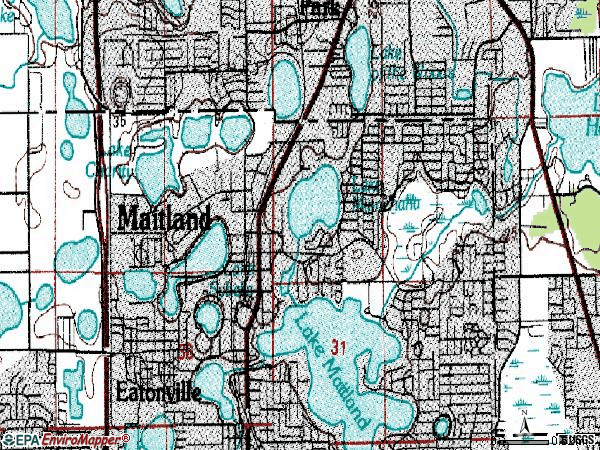
Notable locations in zip code 32751: Lake Lucien Executive Complex (A), Butler Plaza (B), Maitland Civic Center (C), Maitland Historical Society (D), Maitland Art Center (E), Maitland Historical Museum and Telephone Museum (F), Moseley House (G), Maitland Public Library (H), Eatonville Fire Department Station 46 (I), Maitland Fire Operations (J), Maitland Fire and Rescue Station 45 (K), Maitland Fire and Rescue Station 47 (L), Maitland Police Department (M), Eatonville Police Department (N). Display/hide their locations on the map
Shopping Centers: Winter Park Mall (1), Village Plaza Shopping Center (2), Royal Plaza Shopping Center (3), Casselbery Commons Shopping Center (4), Lake Howell Square Shopping Center (5), Belitz Plaza Shopping Center (6). Display/hide their locations on the map
Churches in zip code 32751 include: Lake Howell Bible Chapel (A), Asbury United Methodist Church (B), King of Kings Lutheran Church (C), Saint Lawrence African Methodist Episcopal Church (D), Saint Richards Episcopal Church (E), Altamonte Springs Seventh Day Adventist Church (F), Orangewood Presbyterian Church (G), First Presbyterian Church of Maitland (H), Bible Presbyterian Church of Maitland (I). Display/hide their locations on the map
Lakes: Lake Minnehaha (A), Harvest Lake (B), Lake Hope (C), Lake Catherine (D), Lake Charity (E), Park Lake (F), Lake Lotus (G), Lake Lily (H). Display/hide their locations on the map
2,961 married couples with children.
884 single-parent households (258 men, 626 women).
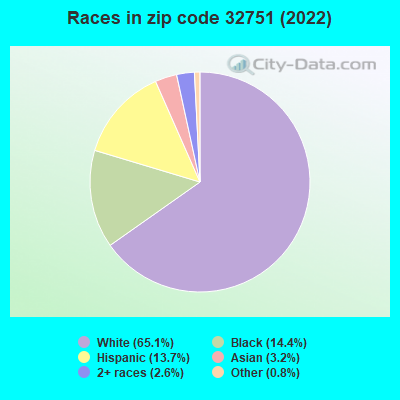
81.5% of residents of 32751 zip code speak English at home.
11.5% of residents speak Spanish at home (74% very well, 8% well, 6% not well, 11% not at all).
4.5% of residents speak other Indo-European language at home (67% very well, 28% well, 5% not well).
1.2% of residents speak Asian or Pacific Island language at home (80% very well, 16% well, 4% not well).
1.0% of residents speak other language at home (96% very well, 4% well).
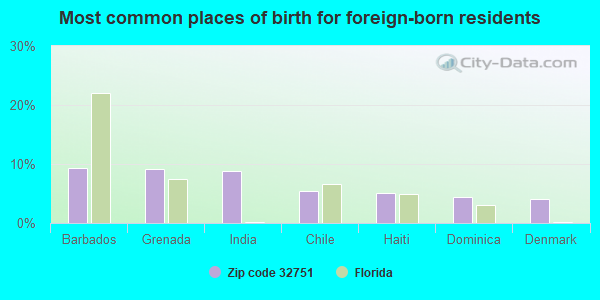
Foreign born population: 2,831 (12.1%) (56.6% of them are naturalized citizens)
Major facilities with environmental interests located in this zip code:
HUNGERFORD ELEMENTARY SCHOOL (230 S COLLEGE ST in EATONVILLE, FL)
(Geographic Names Information System) (National Center for Education Statistics) - STATE ID-1351 Organizations: ORANGE COUNTY SCHOOL DISTRICT (SCHOOL DISTRICT)
LAKE SYBELIA ELEMENTARY SCHOOL (BOX 966, 600 SANDSPUR RD in MAITLAND, FL)
(Geographic Names Information System) (National Center for Education Statistics) - STATE ID-1221 Organizations: ORANGE COUNTY SCHOOL DISTRICT (SCHOOL DISTRICT)
ROBERT HUNGERFORD PREPARATORY HIGH SCHOOL (FORMERL (100 E KENNEDY BLVD in EATONVILLE, FL)
(National Center for Education Statistics) - STATE ID-5801 Organizations: ORANGE COUNTY SCHOOL DISTRICT (SCHOOL DISTRICT)
MAITLAND MIDDLE SCHOOL (1901 CHOCTAW TRAIL in MAITLAND, FL)
(National Center for Education Statistics) - STATE ID-0731 Organizations: ORANGE COUNTY SCHOOL DISTRICT (SCHOOL DISTRICT)
LA-AMISTAD (I (201 ALPINE DR in MAITLAND, FL)
(National Center for Education Statistics) - STATE ID-0031 Organizations: ORANGE COUNTY SCHOOL DISTRICT (SCHOOL DISTRICT)
ART-CO PAINT & TILE CO INC (631 NORTH ORLANDO AVE. in MAITLAND, FL)
COMPLIANCE ACTIVITY (Tracking inspections of insecticide, fungicide, and rodenticide, and toxic substances)
MAITLAND MIXED USE (400 S ORLANDO AVE in ORLANDO, FL)
National Pollutant Discharge Elimination System NON-MAJOR (Tracking pollutant discharge elimination systems) - permit Organizations: DANIEL ARMSTRONG (CONTACT/OWNER)
JACKSON PARK CONDOMINIUMS (WETHERBEE RD in ORLANDO, FL)
National Pollutant Discharge Elimination System NON-MAJOR (Tracking pollutant discharge elimination systems) - permit Organizations: TIMOTHY WHEELER (CONTACT/OWNER)
7-11 #27506 (481 N ORLANDO AVE in MAITLAND, FL)
National Pollutant Discharge Elimination System NON-MAJOR (Tracking pollutant discharge elimination systems) - permit Organizations: WILLO SMITH (CONTACT/OWNER)
MAITLAND EXECUTIVE VILLAGE (9255 US 17- 92 SOUTH in MAITLAND, FL)
National Pollutant Discharge Elimination System NON-MAJOR (Tracking pollutant discharge elimination systems) - permit Organizations: SOLANGE DAO (CONTACT/OWNER)
NAPA AUTO PARTS ( in EATONVILLE, FL)
National Pollutant Discharge Elimination System NON-MAJOR (Tracking pollutant discharge elimination systems) - permit Organizations: JEFF YEARWOOD (CONTACT/OWNER)
7-ELEVEN #25608 (351 N LAKE DESTINY RD in MAITLAND, FL)
National Pollutant Discharge Elimination System NON-MAJOR (Tracking pollutant discharge elimination systems) - permit Organizations: MEAGEN GONZALEZ (CONTACT/OWNER)
800 NORTH MAITLAND AVENUE OFFI (800 N MAITLAND AVE in MAITLAND, FL)
National Pollutant Discharge Elimination System NON-MAJOR (Tracking pollutant discharge elimination systems) - permit Organizations: BARRY KALMANSON (CONTACT/OWNER)
Housing units lacking complete plumbing facilities: 0.9% Housing units lacking complete kitchen facilities: 2.9%
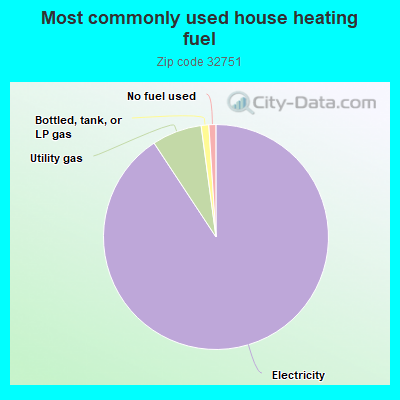
90.1%Electricity
7.1%Utility gas
1.1%Bottled, tank, or LP gas
1.0%No fuel used
Population in 1990: 19,834.
Place of birth for U.S.-born residents:
This state: 8,950
Northeast: 4,107
Midwest: 2,540
South: 3,139
West: 864
54% of the 32751 zip code residents lived in the same house 5 years ago. Out of people who lived in different houses, 43% lived in this county. Out of people who lived in different counties, 50% lived in Florida.
88% of the 32751 zip code residents lived in the same house 1 year ago. Out of people who lived in different houses, 43% moved from this county. Out of people who lived in different houses, 29% moved from different county within same state. Out of people who lived in different houses, 21% moved from different state. Out of people who lived in different houses, 6% moved from abroad.
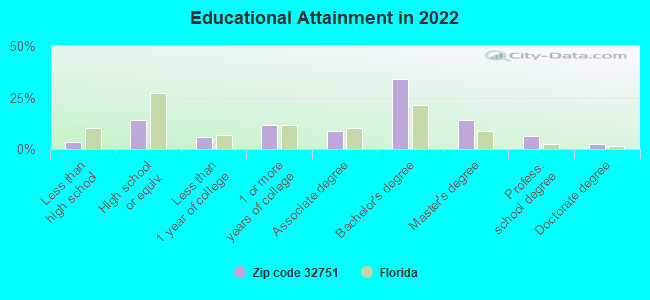
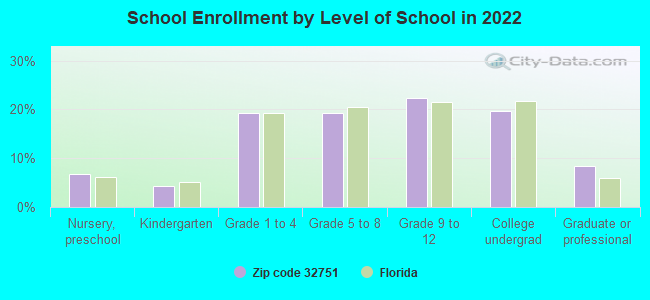
Private vs. public school enrollment:
Students in private schools in grades 1 to 8 (elementary and middle school): 673
Here:
34.8%
Florida:
15.8%
Students in private schools in grades 9 to 12 (high school): 236
Here:
21.2%
Florida:
12.9%
Students in private undergraduate colleges: 152
Here:
15.8%
Florida:
23.6%
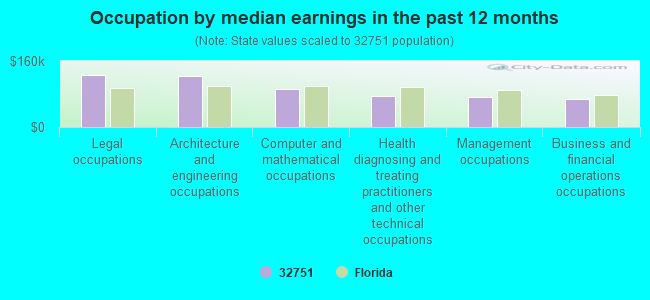
Occupation by median earnings in the past 12 months ($)
125,231Legal occupations
123,517Architecture and engineering occupations
92,232Computer and mathematical occupations
74,055Health diagnosing and treating practitioners and other technical occupations
72,814Management occupations
68,308Business and financial operations occupations
Companies with biggest federal contracts located in this zip code (MAITLAND, FL):
MARTIN K EBY CONSTRUCTION COM (2601 MAITLAND CENTER PARKW) : $19,204,899 in 31 contractsfrom 2000 to 2003
Contracts for Construction of Structures and Facilities -- Highways, Roads, Streets, Bridges, and Railways (includes resurfacing) by U.S. Army Corps of Engineers - civil program financing only Signed by year:2000: $6,001,000; 2001: $7,096,002; 2002: $6,095,309; 2003: $12,588; 2004: $0; 2005: $0; 2006: $0.
Biggest contracts:
$6,000,000 with U.S. Army Corps of Engineers - civil program financing only for Construction of Structures and Facilities -- Highways, Roads, Streets, Bridges, and Railways (includes resurfacing). Signed on 2000-11-30. Completion date: 2002-07-26.
$4,000,000, same as above.Signed on 2002-01-18. Completion date: 2002-12-31.
$2,758,000, same as above.Signed on 2001-09-18. Completion date: 2002-07-26.
$2,000,000, same as above.Signed on 2001-10-19. Completion date: 2002-12-31.
C D M ENGINEERS & CONSTRUCTION (2301 MTLAND CTR PKWY 30) 2 employees, $110000 revenue: $12,818,749 in 54 contractsfrom 2000 to 2006
Contracts for Construction of Structures and Facilities -- Water Supply Facilities, Construction of Structures and Facilities -- Sewage and Waste Facilities, Utilities, Architect - Engineer Services (including landscaping, interior layout, and designing) by National Park Service, NASA Signed by year:2000: $1,848,000; 2001: $132,000; 2002: $2,782,033; 2003: $7,421,813; 2004: $190,929; 2005: $443,974; 2006: $0.
Biggest contracts:
$3,524,000 with National Park Service for Construction of Structures and Facilities -- Water Supply Facilities. Signed on 2003-09-15. Completion date: 2005-01-15.
$3,473,000, same as above.Signed on 2003-09-15. Completion date: 2005-01-15.
$2,138,000, same as above.Signed on 2002-09-15. Completion date: 2003-10-15.
$1,796,000 with NASA for Construction of Structures and Facilities -- Sewage and Waste Facilities. Signed on 2000-01-15. Completion date: 2001-01-15.
AT&T WIRELESS SERVICES OF FLOR (2400 MAITLAND CENTER BLVD) : $1,245,106 in 76 contractsfrom 2002 to 2005
Contracts for Telephone and/or Communications Services (includes Telegraph, Telex, and Cablevision Services), Other ADP and Telecommunications Services (includes data storage on tapes, compact disks, etc.), Maintenance, Repair and Rebuilding of Equipment -- Miscellaneous by Navy, Army Signed by year:2000: $0; 2001: $0; 2002: $31,363; 2003: $429,511; 2004: $560,891; 2005: $223,341; 2006: $0.
Biggest contracts:
$139,916 with Navy for Telephone and/or Communications Services (includes Telegraph, Telex, and Cablevision Services). Taking place in NC. Signed on 2005-01-18. Completion date: 2005-09-30.
$74,319, same as above.Signed on 2005-01-10. Completion date: 2005-09-30.
$54,642 with Navy for Telephone and/or Communications Services (includes Telegraph, Telex, and Cablevision Services). Taking place in NJ. Signed on 2003-08-08. Completion date: 2004-08-24.
$44,029, same as above.Signed on 2004-09-21. Completion date: 2005-09-24.
HAYNES MASSA & ASSOCIATES, INC (601 S LAKE DESTINY DRIVE; small business) : $557,454 in 18 contractsfrom 2001 to 2005
Contracts for Legal Services, Expert Witness, Technical Assistance by Navy, Offices, Boards and Divisions (includes Attorney General, Deputy Attorney General, etc.) Signed by year:2000: $0; 2001: $20,304; 2002: $241,595; 2003: $66,954; 2004: $162,821; 2005: $65,780; 2006: $0.
Biggest contracts:
$127,750 with Navy for Legal Services. Taking place in WA. Signed on 2002-07-26. Completion date: 2003-07-25.
$93,106 with Navy for Legal Services. Taking place in CA. Signed on 2002-04-03. Completion date: 2002-09-30.
$66,954, same as above.Signed on 2003-11-26. Completion date: 2004-09-30.
$61,934 with Offices, Boards and Divisions (includes Attorney General, Deputy Attorney General, etc.) for Expert Witness. Signed on 2004-09-30. Completion date: 2005-11-30.
PNL COMMERCIAL CORP (1367 EAST HORATIO STREET; small business) : $509,143 in 4 contractsfrom 2000 to 2002
$468,000 with Air Force for Maintenance, Repair or Alteration of Real Property -- Other Non-Building Facilities. Signed on 2001-05-04. Completion date: 2001-05-02.
$24,566, same as above.Signed on 2000-06-12. Completion date: 2000-06-12.
$15,458, same as above.Signed on 2002-02-20. Completion date: 2002-02-28.
$1,119, same as above.Signed on 2001-10-09. Completion date: 2001-10-18.
BRIGHT HOUSE NETWORKS LLC (2251 LUCIEN WAY STE 320) : $271,768 in 15 contractsfrom 2003 to 2006
Contracts for Telephone and/or Communications Services (includes Telegraph, Telex, and Cablevision Services), Other Utilities, Other ADP and Telecommunications Services (includes data storage on tapes, compact disks, etc.), ADP Telecommunications and Transmission Services, and moreby Air Force, Department of Veterans Affairs, Drug Enforcement Administration Signed by year:2000: $0; 2001: $0; 2002: $0; 2003: $64,919; 2004: $118,785; 2005: $92,110; 2006: -$4,046.
Biggest contracts:
$73,000 with Air Force for Telephone and/or Communications Services (includes Telegraph, Telex, and Cablevision Services). Signed on 2005-10-01. Completion date: 2006-09-30.
$64,919 with Air Force for Other Utilities. Signed on 2003-10-01. Completion date: 2004-09-30.
$61,763 with Air Force for Other ADP and Telecommunications Services (includes data storage on tapes, compact disks, etc.). Signed on 2004-10-01. Completion date: 2005-09-30.
$43,402 with Air Force for Other Utilities. Signed on 2004-09-24. Completion date: 2004-11-23.
NANOSTEEL COMPANY, THE (485 N KELLER RD STE 100; small business) : $228,426 in 4 contractsfrom 2003 to 2005
$200,000 with Department of Defense for Other Defense -- Applied Research and Exploratory Development (R&D). Signed on 2003-07-18. Completion date: 2004-07-17.
$22,926 with Navy for Additive Metal Materials. Signed on 2005-06-21. Completion date: 2005-06-21.
$3,000 with Army for Wire, Nonelectrical. Signed on 2003-06-11. Completion date: 2003-07-11.
$2,500, same as above.Signed on 2003-09-09. Completion date: 2003-10-10.
WESTERN WIRELESS CORPORATION (2400 MTLAND CTR PKWY 11) : $136,000 in 5 contractsfrom 2000 to 2001
Contracts for Telephone and Telegraph Equipment by NASA Signed by year:2000: $177,000; 2001: -$41,000; 2002: $0; 2003: $0; 2004: $0; 2005: $0; 2006: $0.
Biggest contracts:
$72,000 with NASA for Telephone and Telegraph Equipment. Signed on 2000-03-15. Completion date: 2000-09-15.
$45,000, same as above.Signed on 2000-05-15. Completion date: 2000-09-15.
$30,000, same as above.Signed on 2000-09-15. Completion date: 2000-09-15.
$30,000, same as above.Signed on 2000-07-15. Completion date: 2000-09-15.
MOTOR & GENERATOR INSTITUTE (202 QUAYSIDE CIRCLE #201; small business) : $93,800 in 5 contractsfrom 2002 to 2006
Contracts for Technical Representation Services -- Electric Wire, and Power and Distribution Equipment, Program Management/Support Services, Personal Care Services (includes such services as barber and beauty shop, shoe repairs, tailoring, etc.) by Army Signed by year:2000: $0; 2001: $0; 2002: $45,000; 2003: $0; 2004: $20,000; 2005: $20,000; 2006: $8,800.
Biggest contracts:
$45,000 with Army for Technical Representation Services -- Electric Wire, and Power and Distribution Equipment. Taking place in DC. Signed on 2002-05-28. Completion date: 2002-09-30.
$20,000 with Army for Program Management/Support Services. Signed on 2005-03-31. Completion date: 2004-11-09.
$20,000, same as above.Signed on 2004-09-25. Completion date: 2004-11-09.
$8,800 with Army for Personal Care Services (includes such services as barber and beauty shop, shoe repairs, tailoring, etc.). Taking place in CA. Signed on 2006-02-03. Completion date: 2006-02-09.
ORANGTREE LITHOTRIPSY LTD (670 N ORLANDO AVE STE 103; small business) : $88,400 in 20 contractsfrom 2003 to 2006
Contracts for Surgery Services by Navy Signed by year:2000: $0; 2001: $0; 2002: $0; 2003: $10,400; 2004: $28,600; 2005: $39,000; 2006: $10,400.
Biggest contracts:
$10,400 with Navy for Surgery Services. Signed on 2006-01-30. Completion date: 2006-01-31.
$10,400, same as above.Signed on 2005-07-26. Completion date: 2005-07-26.
$10,400, same as above.Signed on 2003-10-29. Completion date: 2003-10-28.
$7,800, same as above.Signed on 2004-10-27. Completion date: 2004-10-26.
Top industries in this zip code by the number of employees in 2005:
Administrative and Support and Waste Management and Remediation Services: Temporary Help Services (over 1000 employees: 1 establishment, 500-999 employees: 1 establishment, 250-499 employees: 1 establishment, 100-249 employees: 2 establishments, 50-99 employees: 5 establishments, 20-49 employees: 4 establishments, 1-4 employees: 3 establishments)
Finance and Insurance: Direct Property and Casualty Insurance Carriers (500-999: 1, 100-249: 1, 50-99: 2, 20-49: 4, 10-19: 2, 5-9: 4, 1-4: 7)
Construction: Commercial and Institutional Building Construction (250-499: 2, 100-249: 1, 50-99: 1, 20-49: 2, 10-19: 4, 5-9: 1, 1-4: 1)
Finance and Insurance: Direct Title Insurance Carriers (500-999: 1, 100-249: 1, 20-49: 2, 10-19: 2, 5-9: 1, 1-4: 3)
Management of Companies and Enterprises: Corporate, Subsidiary, and Regional Managing Offices (100-249: 3, 50-99: 3, 20-49: 6, 10-19: 3, 5-9: 2, 1-4: 4)
Finance and Insurance: Real Estate Credit (100-249: 2, 50-99: 3, 20-49: 8, 10-19: 6, 5-9: 5, 1-4: 19)
Educational Services: Colleges, Universities, and Professional Schools (500-999: 1, 5-9: 2)
Information: Cable and Other Program Distribution (500-999: 1)
Health Care and Social Assistance: Offices of Physicians (except Mental Health Specialists) (100-249: 1, 20-49: 8, 10-19: 10, 5-9: 15, 1-4: 15)
Finance and Insurance: Mortgage and Nonmortgage Loan Brokers (250-499: 1, 50-99: 1, 20-49: 2, 10-19: 1, 1-4: 9)
People in group quarters in 2010:
131 people in nursing facilities/skilled-nursing facilities
44 people in residential treatment centers for adults
33 people in other noninstitutional facilities
5 people in group homes intended for adults
People in group quarters in 2000:
124 people in nursing homes
73 people in other noninstitutional group quarters
Fatal accident statistics in 2014:
Fatal accident count: 1
Vehicles involved in fatal accidents: 1
Fatal accidents caused by drunken drivers: 0
Fatalities: 1
Persons involved in fatal accidents: 1
Pedestrians involved in fatal accidents: 1
Fatal accident statistics in 2013:
Fatal accident count: 1
Vehicles involved in fatal accidents: 2
Fatal accidents caused by drunken drivers: 0
Fatalities: 1
Persons involved in fatal accidents: 2
Pedestrians involved in fatal accidents: 0
Home Mortgage Disclosure Act Aggregated Statistics For Year 2009 (Based on 7 full and 16 partial tracts)
A) FHA, FSA/RHS & VA Home Purchase Loans
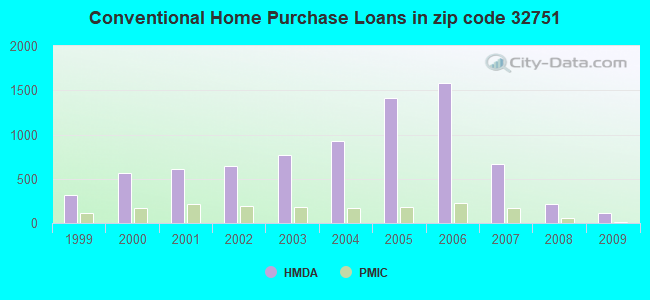
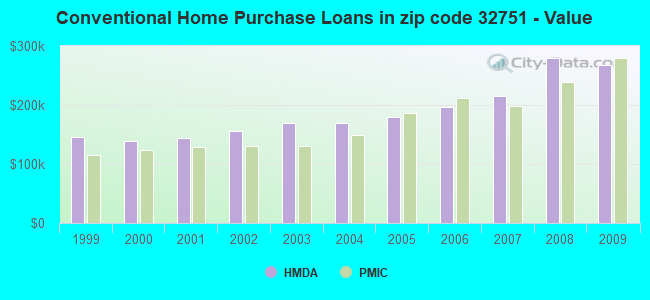
B) Conventional Home Purchase Loans
C) Refinancings
D) Home Improvement Loans
E) Loans on Dwellings For 5+ Families
F) Non-occupant Loans on < 5 Family Dwellings (A B C & D)
G) Loans On Manufactured Home Dwelling (A B C & D)
Number
Average Value
Number
Average Value
Number
Average Value
Number
Average Value
Number
Average Value
Number
Average Value
Number
Average Value
LOANS ORIGINATED
97
$176,113
111
$267,605
473
$219,782
14
$134,465
0
$0
32
$127,787
0
$0
APPLICATIONS APPROVED, NOT ACCEPTED
4
$145,125
8
$397,671
55
$255,485
7
$252,431
1
$17,754,000
4
$55,585
0
$0
APPLICATIONS DENIED
25
$178,969
33
$171,814
278
$220,946
11
$116,695
0
$0
27
$153,709
0
$0
APPLICATIONS WITHDRAWN
23
$120,953
16
$140,903
114
$236,099
3
$107,183
0
$0
14
$143,671
1
$176,890
FILES CLOSED FOR INCOMPLETENESS
9
$135,060
4
$156,685
54
$246,891
4
$223,060
0
$0
11
$184,716
0
$0
Aggregated Statistics For Year 2008 (Based on 7 full and 16 partial tracts)
A) FHA, FSA/RHS & VA Home Purchase Loans
B) Conventional Home Purchase Loans
C) Refinancings
D) Home Improvement Loans
E) Loans on Dwellings For 5+ Families
F) Non-occupant Loans on < 5 Family Dwellings (A B C & D)
G) Loans On Manufactured Home Dwelling (A B C & D)
Number
Average Value
Number
Average Value
Number
Average Value
Number
Average Value
Number
Average Value
Number
Average Value
Number
Average Value
LOANS ORIGINATED
53
$215,038
220
$278,881
409
$222,866
50
$155,551
3
$5,905,990
62
$161,606
1
$26,900
APPLICATIONS APPROVED, NOT ACCEPTED
3
$281,703
35
$203,574
87
$233,173
10
$188,594
1
$8,424,320
10
$127,858
1
$72,500
APPLICATIONS DENIED
16
$176,906
92
$192,973
322
$217,048
52
$176,923
0
$0
52
$143,574
2
$41,510
APPLICATIONS WITHDRAWN
5
$256,206
37
$253,622
116
$206,958
7
$139,801
0
$0
11
$111,243
0
$0
FILES CLOSED FOR INCOMPLETENESS
2
$187,395
8
$256,965
35
$190,090
3
$133,333
0
$0
3
$177,653
0
$0
Aggregated Statistics For Year 2007 (Based on 7 full and 16 partial tracts)
A) FHA, FSA/RHS & VA Home Purchase Loans
B) Conventional Home Purchase Loans
C) Refinancings
D) Home Improvement Loans
E) Loans on Dwellings For 5+ Families
F) Non-occupant Loans on < 5 Family Dwellings (A B C & D)
G) Loans On Manufactured Home Dwelling (A B C & D)
Number
Average Value
Number
Average Value
Number
Average Value
Number
Average Value
Number
Average Value
Number
Average Value
Number
Average Value
LOANS ORIGINATED
15
$215,747
668
$215,430
774
$224,404
78
$115,843
3
$12,977,170
203
$157,667
2
$79,060
APPLICATIONS APPROVED, NOT ACCEPTED
2
$186,580
113
$164,271
141
$231,658
25
$127,832
0
$0
62
$124,505
2
$67,300
APPLICATIONS DENIED
5
$183,738
234
$169,141
487
$209,369
74
$129,662
1
$299,980
184
$148,232
1
$54,590
APPLICATIONS WITHDRAWN
3
$176,693
130
$201,224
207
$225,469
13
$191,841
0
$0
82
$178,944
0
$0
FILES CLOSED FOR INCOMPLETENESS
0
$0
42
$211,042
93
$217,757
2
$88,320
0
$0
15
$150,557
0
$0
Aggregated Statistics For Year 2006 (Based on 7 full and 16 partial tracts)
A) FHA, FSA/RHS & VA Home Purchase Loans
B) Conventional Home Purchase Loans
C) Refinancings
D) Home Improvement Loans
E) Loans on Dwellings For 5+ Families
F) Non-occupant Loans on < 5 Family Dwellings (A B C & D)
G) Loans On Manufactured Home Dwelling (A B C & D)
Number
Average Value
Number
Average Value
Number
Average Value
Number
Average Value
Number
Average Value
Number
Average Value
Number
Average Value
LOANS ORIGINATED
13
$177,301
1,586
$196,367
1,037
$200,092
108
$116,056
2
$167,455
452
$159,574
2
$27,815
APPLICATIONS APPROVED, NOT ACCEPTED
2
$161,925
260
$177,129
171
$189,316
24
$95,057
0
$0
101
$151,908
1
$18,960
APPLICATIONS DENIED
3
$180,937
386
$140,990
428
$177,860
77
$102,969
0
$0
131
$136,161
4
$164,942
APPLICATIONS WITHDRAWN
4
$158,582
266
$162,742
328
$177,149
21
$144,023
0
$0
96
$139,402
2
$134,000
FILES CLOSED FOR INCOMPLETENESS
0
$0
67
$197,267
88
$178,216
7
$36,194
0
$0
29
$183,081
0
$0
Aggregated Statistics For Year 2005 (Based on 7 full and 16 partial tracts)
A) FHA, FSA/RHS & VA Home Purchase Loans
B) Conventional Home Purchase Loans
C) Refinancings
D) Home Improvement Loans
E) Loans on Dwellings For 5+ Families
F) Non-occupant Loans on < 5 Family Dwellings (A B C & D)
G) Loans On Manufactured Home Dwelling (A B C & D)
Number
Average Value
Number
Average Value
Number
Average Value
Number
Average Value
Number
Average Value
Number
Average Value
Number
Average Value
LOANS ORIGINATED
11
$126,658
1,417
$179,837
1,052
$193,620
102
$121,967
1
$16,887,920
461
$135,396
2
$78,510
APPLICATIONS APPROVED, NOT ACCEPTED
4
$138,195
142
$173,703
158
$161,158
23
$148,873
0
$0
52
$129,986
6
$51,387
APPLICATIONS DENIED
4
$98,070
258
$153,803
420
$164,245
61
$80,079
0
$0
105
$150,081
5
$66,368
APPLICATIONS WITHDRAWN
4
$142,195
242
$198,853
365
$163,962
38
$129,117
0
$0
65
$153,248
0
$0
FILES CLOSED FOR INCOMPLETENESS
4
$133,115
48
$149,670
104
$152,156
4
$91,788
0
$0
19
$131,297
0
$0
Aggregated Statistics For Year 2004 (Based on 7 full and 16 partial tracts)
A) FHA, FSA/RHS & VA Home Purchase Loans
B) Conventional Home Purchase Loans
C) Refinancings
D) Home Improvement Loans
E) Loans on Dwellings For 5+ Families
F) Non-occupant Loans on < 5 Family Dwellings (A B C & D)
G) Loans On Manufactured Home Dwelling (A B C & D)
Number
Average Value
Number
Average Value
Number
Average Value
Number
Average Value
Number
Average Value
Number
Average Value
Number
Average Value
LOANS ORIGINATED
30
$133,248
925
$169,708
860
$146,642
59
$108,482
1
$5,648,410
178
$124,822
0
$0
APPLICATIONS APPROVED, NOT ACCEPTED
2
$139,085
109
$167,549
134
$169,818
22
$65,428
0
$0
36
$124,547
1
$16,820
APPLICATIONS DENIED
3
$97,923
146
$137,255
401
$141,224
93
$65,032
0
$0
41
$144,822
8
$78,346
APPLICATIONS WITHDRAWN
2
$108,140
100
$162,408
336
$133,520
18
$62,482
0
$0
32
$119,096
2
$152,445
FILES CLOSED FOR INCOMPLETENESS
1
$147,690
23
$209,560
73
$125,008
6
$82,953
0
$0
5
$104,410
0
$0
Aggregated Statistics For Year 2003 (Based on 7 full and 16 partial tracts)
A) FHA, FSA/RHS & VA Home Purchase Loans
B) Conventional Home Purchase Loans
C) Refinancings
D) Home Improvement Loans
F) Non-occupant Loans on < 5 Family Dwellings (A B C & D)
Number
Average Value
Number
Average Value
Number
Average Value
Number
Average Value
Number
Average Value
LOANS ORIGINATED
39
$102,572
772
$170,019
2,060
$148,335
56
$56,973
181
$104,842
APPLICATIONS APPROVED, NOT ACCEPTED
5
$120,410
86
$139,448
227
$138,290
18
$28,779
27
$110,807
APPLICATIONS DENIED
12
$90,391
103
$105,761
522
$135,115
52
$37,747
55
$84,020
APPLICATIONS WITHDRAWN
8
$112,494
103
$171,405
435
$128,422
11
$46,432
37
$90,949
FILES CLOSED FOR INCOMPLETENESS
2
$87,510
23
$124,438
83
$146,716
6
$145,162
6
$102,567
Aggregated Statistics For Year 2002 (Based on 7 full and 14 partial tracts)
A) FHA, FSA/RHS & VA Home Purchase Loans
B) Conventional Home Purchase Loans
C) Refinancings
D) Home Improvement Loans
E) Loans on Dwellings For 5+ Families
F) Non-occupant Loans on < 5 Family Dwellings (A B C & D)
Number
Average Value
Number
Average Value
Number
Average Value
Number
Average Value
Number
Average Value
Number
Average Value
LOANS ORIGINATED
58
$101,813
648
$155,770
1,338
$153,241
66
$43,517
1
$1,571,530
139
$92,910
APPLICATIONS APPROVED, NOT ACCEPTED
1
$84,570
67
$160,957
154
$131,030
24
$40,983
0
$0
23
$80,968
APPLICATIONS DENIED
10
$75,177
72
$131,370
349
$111,420
40
$45,090
0
$0
35
$76,871
APPLICATIONS WITHDRAWN
5
$56,562
85
$121,080
213
$132,492
25
$37,487
1
$198,240
26
$88,883
FILES CLOSED FOR INCOMPLETENESS
2
$62,890
29
$166,221
52
$141,891
2
$23,810
0
$0
2
$52,485
Aggregated Statistics For Year 2001 (Based on 7 full and 14 partial tracts)
A) FHA, FSA/RHS & VA Home Purchase Loans
B) Conventional Home Purchase Loans
C) Refinancings
D) Home Improvement Loans
E) Loans on Dwellings For 5+ Families
F) Non-occupant Loans on < 5 Family Dwellings (A B C & D)
Number
Average Value
Number
Average Value
Number
Average Value
Number
Average Value
Number
Average Value
Number
Average Value
LOANS ORIGINATED
96
$92,176
610
$143,585
982
$144,489
80
$53,030
2
$8,853,620
90
$86,755
APPLICATIONS APPROVED, NOT ACCEPTED
1
$132,630
48
$179,461
96
$115,303
21
$42,730
0
$0
13
$89,669
APPLICATIONS DENIED
10
$102,030
107
$91,469
360
$94,474
79
$29,818
0
$0
42
$58,597
APPLICATIONS WITHDRAWN
8
$71,448
70
$133,957
206
$119,920
19
$21,559
0
$0
13
$113,436
FILES CLOSED FOR INCOMPLETENESS
2
$126,220
17
$119,250
44
$103,950
5
$23,310
0
$0
4
$93,488
Aggregated Statistics For Year 2000 (Based on 7 full and 14 partial tracts)
A) FHA, FSA/RHS & VA Home Purchase Loans
B) Conventional Home Purchase Loans
C) Refinancings
D) Home Improvement Loans
F) Non-occupant Loans on < 5 Family Dwellings (A B C & D)
Number
Average Value
Number
Average Value
Number
Average Value
Number
Average Value
Number
Average Value
LOANS ORIGINATED
82
$87,129
568
$139,110
213
$102,962
87
$40,107
64
$90,651
APPLICATIONS APPROVED, NOT ACCEPTED
11
$89,798
102
$105,031
59
$67,677
37
$41,696
6
$88,165
APPLICATIONS DENIED
15
$82,137
85
$74,954
206
$62,854
64
$21,198
23
$68,436
APPLICATIONS WITHDRAWN
14
$88,864
68
$123,185
121
$59,994
21
$43,754
9
$58,117
FILES CLOSED FOR INCOMPLETENESS
1
$94,260
24
$84,565
58
$89,942
0
$0
4
$59,308
Aggregated Statistics For Year 1999 (Based on 4 full and 8 partial tracts)
A) FHA, FSA/RHS & VA Home Purchase Loans
B) Conventional Home Purchase Loans
C) Refinancings
D) Home Improvement Loans
E) Loans on Dwellings For 5+ Families
F) Non-occupant Loans on < 5 Family Dwellings (A B C & D)
2002 - 2018 National Fire Incident Reporting System (NFIRS) incidents
Based on the data from the years 2002 - 2018 the average number of fire incidents per year is 51. The highest number of fires - 75 took place in 2006, and the least - 36 in 2015. The data has a rising trend.
When looking into fire subcategories, the most reports belonged to: Structure Fires (38.7%), and Outside Fires (34.4%).
Fire incident types reported to NFIRS in Zip Code 32751


 Nearest zip codes: 32730, 32789, 32701, 32714, 32707, 32804.


 Based on the data from the years 2002 - 2018 the average number of fire incidents per year is 51. The highest number of fires - 75 took place in 2006, and the least - 36 in 2015. The data has a rising trend.
 When looking into fire subcategories, the most reports belonged to: Structure Fires (38.7%), and Outside Fires (34.4%).