Estimated zip code population in 2022: 25,002 Zip code population in 2010: 18,617 Zip code population in 2000: 14,216
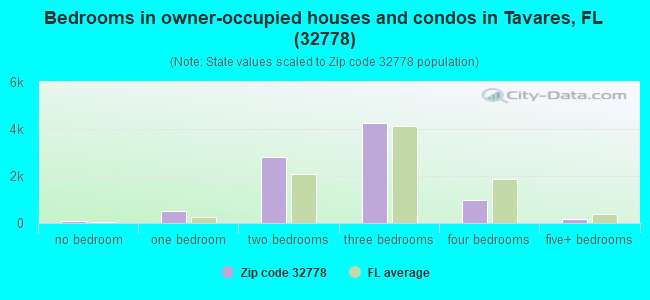
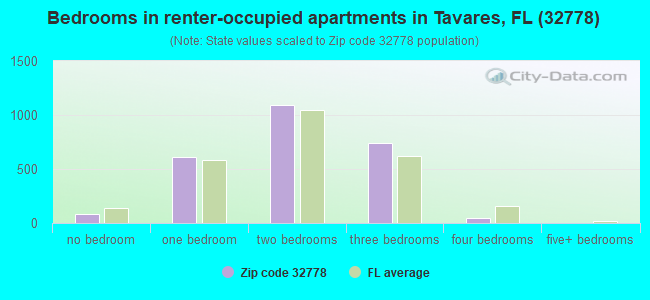
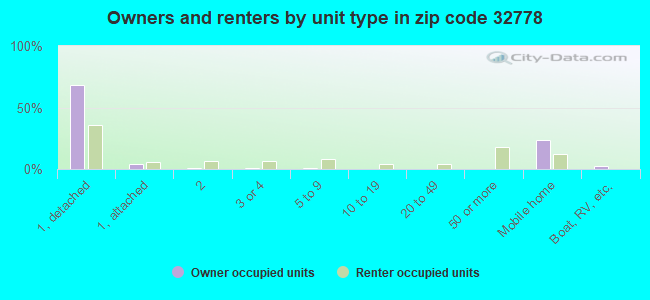
Houses and condos: 13,072 Renter-occupied apartments: 2,582
% of renters here:
23%
State:
33%
March 2022 cost of living index in zip code 32778: 90.8 (less than average, U.S. average is 100)
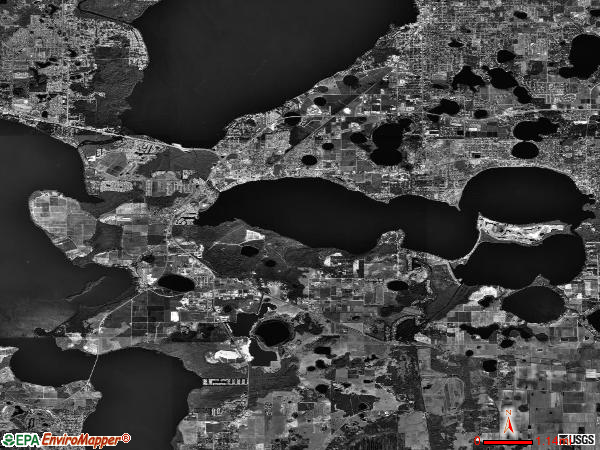
Land area: 25.1 sq. mi. Water area: 16.7 sq. mi.
Population density: 997 people per square mile
(low).
OSM Map
General Map
Google Map
MSN Map
OSM Map
General Map
Google Map
MSN Map
OSM Map
General Map
Google Map
MSN Map
OSM Map
General Map
Google Map
MSN Map
Please wait while loading the map...
Real estate property taxes paid for housing units in 2022:
This zip code:
0.8% ($2,041)
Florida:
0.7% ($2,529)
Median real estate property taxes paid for housing units with mortgages in 2022: $2,331 (0.8%) Median real estate property taxes paid for housing units with no mortgage in 2022: $1,549 (0.8%)
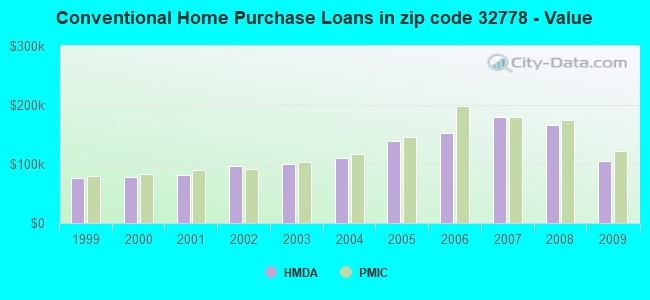
Estimated median house/condo value in 2022: $254,002
32778:
$254,002
Florida:
$354,100
According to our research of Florida and other state lists, there were 38 registered sex offenders living in 32778 zip code as of April 27, 2024. The ratio of all residents to sex offenders in zip code 32778 is 543 to 1. The ratio of registered sex offenders to all residents in this zip code is near the state average.
Median resident age:
This zip code:
53.9 years
Florida median age:
42.7 years
Average household size:
This zip code:
2.1 people
Florida:
2.5 people
Averages for the 2020 tax year for zip code 32778, filed in 2021:
Average Adjusted Gross Income (AGI) in 2020: $60,031 (Individual Income Tax Returns)
Here:
$60,031
State:
$82,200
Salary/wage: $48,786 (reported on 70.8% of returns)
Here:
$48,786
State:
$58,347
(% of AGI for various income ranges: 1112.0% for AGIs below $25k, 3278.7% for AGIs $25k-50k, 5989.3% for AGIs $50k-75k, 8023.3% for AGIs $75k-100k, 13952.4% for AGIs $100k-200k, 68762.2% for AGIs over 200k)
Taxable interest for individuals: $2,030 (reported on 28.9% of returns)
This zip code:
$2,030
Florida:
$4,272
(% of AGI for various income ranges: 26.3% for AGIs below $25k, 34.8% for AGIs $25k-50k, 55.9% for AGIs $50k-75k, 88.1% for AGIs $75k-100k, 254.5% for AGIs $100k-200k, 2295.6% for AGIs over 200k)
Ordinary dividends: $7,669 (reported on 19.8% of returns)
Here:
$7,669
State:
$15,863
(% of AGI for various income ranges: 37.2% for AGIs below $25k, 62.7% for AGIs $25k-50k, 148.3% for AGIs $50k-75k, 197.8% for AGIs $75k-100k, 801.8% for AGIs $100k-200k, 6741.1% for AGIs over 200k)
Net capital gain/loss in AGI: +$23,682 (reported on 18.3% of returns)
Here:
+$23,682
State:
+$62,983
(% of AGI for various income ranges: 7.8% for AGIs below $25k, 35.0% for AGIs $25k-50k, 156.2% for AGIs $50k-75k, 248.1% for AGIs $75k-100k, 1063.7% for AGIs $100k-200k, 40977.8% for AGIs over 200k)
Profit/loss from business: +$8,898 (reported on 14.7% of returns)
Here:
+$8,898
State:
+$9,719
(% of AGI for various income ranges: 103.3% for AGIs below $25k, 91.0% for AGIs $25k-50k, 122.5% for AGIs $50k-75k, 207.5% for AGIs $75k-100k, 403.1% for AGIs $100k-200k, 4537.8% for AGIs over 200k)
Taxable individual retirement arrangement distribution: $19,001 (reported on 14.3% of returns)
32778:
$19,001
Florida:
$24,823
(% of AGI for various income ranges: 99.2% for AGIs below $25k, 172.6% for AGIs $25k-50k, 284.5% for AGIs $50k-75k, 603.5% for AGIs $75k-100k, 1516.3% for AGIs $100k-200k, 6636.7% for AGIs over 200k)
Total itemized deductions: $33,763 (reported on 5.4% of returns)
Here:
$33,763
State:
$45,393
(% of AGI for various income ranges: 48.7% for AGIs below $25k, 100.1% for AGIs $25k-50k, 232.7% for AGIs $50k-75k, 401.9% for AGIs $75k-100k, 764.3% for AGIs $100k-200k, 6642.2% for AGIs over 200k)
Charity contributions: $14,151 (reported on 4.0% of returns)
Here:
$14,151
State:
$20,178
(% of AGI for various income ranges: 3.9% for AGIs below $25k, 12.8% for AGIs $25k-50k, 40.8% for AGIs $50k-75k, 63.8% for AGIs $75k-100k, 222.2% for AGIs $100k-200k, 3957.8% for AGIs over 200k)
Taxes paid: $5,697 (reported on 5.2% of returns)
32778:
$5,697
State:
$6,967
(% of AGI for various income ranges: 5.2% for AGIs below $25k, 16.6% for AGIs $25k-50k, 40.8% for AGIs $50k-75k, 76.1% for AGIs $75k-100k, 140.6% for AGIs $100k-200k, 926.7% for AGIs over 200k)
Earned income credit: $2,337 (reported on 17.5% of returns)
Here:
$2,337
State:
$2,306
(% of AGI for various income ranges: 106.1% for AGIs below $25k, 66.3% for AGIs $25k-50k, 1.7% for AGIs $50k-75k)
Percentage of individuals using paid preparers for their 2020 taxes: 92.6%
Here:
93%
State:
92%
(% for various income ranges: 91.8% for AGIs below $25k, 93.6% for AGIs $25k-50k, 92.9% for AGIs $50k-75k, 93.2% for AGIs $75k-100k, 92.1% for AGIs $100k-200k, 91.4% for AGIs over 200k)
Averages for the 2012 tax year for zip code 32778, filed in 2013:
Average Adjusted Gross Income (AGI) in 2012: $47,171 (Individual Income Tax Returns)
Here:
$47,171
State:
$60,316
Salary/wage: $36,884 (reported on 69.2% of returns)
Here:
$36,884
State:
$45,277
(% of AGI for various income ranges: 60.1% for AGIs below $25k, 64.6% for AGIs $25k-50k, 56.7% for AGIs $50k-75k, 54.9% for AGIs $75k-100k, 51.1% for AGIs $100k-200k, 35.5% for AGIs over 200k)
Taxable interest for individuals: $2,339 (reported on 36.8% of returns)
This zip code:
$2,339
Florida:
$3,587
(% of AGI for various income ranges: 2.6% for AGIs below $25k, 1.3% for AGIs $25k-50k, 1.8% for AGIs $50k-75k, 1.8% for AGIs $75k-100k, 1.6% for AGIs $100k-200k, 2.3% for AGIs over 200k)
Ordinary dividends: $6,122 (reported on 25.1% of returns)
Here:
$6,122
State:
$12,831
(% of AGI for various income ranges: 5.5% for AGIs below $25k, 2.4% for AGIs $25k-50k, 2.1% for AGIs $50k-75k, 2.0% for AGIs $75k-100k, 3.7% for AGIs $100k-200k, 4.7% for AGIs over 200k)
Net capital gain/loss in AGI: +$5,481 (reported on 19.9% of returns)
Here:
+$5,481
State:
+$33,493
(% of AGI for various income ranges: 0.3% for AGIs $25k-50k, 1.0% for AGIs $50k-75k, 1.2% for AGIs $75k-100k, 3.2% for AGIs $100k-200k, 8.8% for AGIs over 200k)
Profit/loss from business: +$6,899 (reported on 13.5% of returns)
Here:
+$6,899
State:
+$10,012
(% of AGI for various income ranges: 5.8% for AGIs below $25k, 2.0% for AGIs $25k-50k, 0.9% for AGIs $50k-75k, 1.0% for AGIs $75k-100k, 2.3% for AGIs $100k-200k, 0.8% for AGIs over 200k)
Taxable individual retirement arrangement distribution: $14,704 (reported on 19.2% of returns)
32778:
$14,704
Florida:
$21,544
(% of AGI for various income ranges: 6.0% for AGIs below $25k, 4.7% for AGIs $25k-50k, 6.2% for AGIs $50k-75k, 6.6% for AGIs $75k-100k, 8.2% for AGIs $100k-200k, 3.8% for AGIs over 200k)
Total itemized deductions: $20,903 (23% of AGI, reported on 22.8% of returns)
Here:
$20,903
State:
$25,533
Here:
23.3% of AGI
State:
18.0% of AGI
(% of AGI for various income ranges: 10.4% for AGIs below $25k, 10.6% for AGIs $25k-50k, 9.6% for AGIs $50k-75k, 10.0% for AGIs $75k-100k, 11.1% for AGIs $100k-200k, 8.5% for AGIs over 200k)
Charity contributions: $4,512 (reported on 18.0% of returns)
Here:
$4,512
State:
$5,698
(% of AGI for various income ranges: 1.0% for AGIs below $25k, 1.1% for AGIs $25k-50k, 1.5% for AGIs $50k-75k, 1.8% for AGIs $75k-100k, 2.2% for AGIs $100k-200k, 2.6% for AGIs over 200k)
Taxes paid: $4,375 (reported on 22.3% of returns)
32778:
$4,375
State:
$6,203
(% of AGI for various income ranges: 1.6% for AGIs below $25k, 1.5% for AGIs $25k-50k, 1.7% for AGIs $50k-75k, 2.0% for AGIs $75k-100k, 2.8% for AGIs $100k-200k, 2.7% for AGIs over 200k)
Earned income credit: $2,228 (reported on 18.6% of returns)
Here:
$2,228
State:
$2,372
(% of AGI for various income ranges: 5.7% for AGIs below $25k, 0.9% for AGIs $25k-50k)
Percentage of individuals using paid preparers for their 2012 taxes: 46.0%
Here:
46%
State:
54%
(% for various income ranges: 41.2% for AGIs below $25k, 42.8% for AGIs $25k-50k, 48.7% for AGIs $50k-75k, 53.2% for AGIs $75k-100k, 65.1% for AGIs $100k-200k, 78.6% for AGIs over 200k)
Averages for the 2004 tax year for zip code 32778, filed in 2005:
Average Adjusted Gross Income (AGI) in 2004: $40,222 (Individual Income Tax Returns)
Here:
$40,222
State:
$50,523
Salary/wage: $33,015 (reported on 70.2% of returns)
Here:
$33,015
State:
$39,563
(% of AGI for various income ranges: 129.8% for AGIs below $10k, 58.1% for AGIs $10k-25k, 62.0% for AGIs $25k-50k, 63.1% for AGIs $50k-75k, 59.8% for AGIs $75k-100k, 45.7% for AGIs over 100k)
Taxable interest for individuals: $2,579 (reported on 50.3% of returns)
This zip code:
$2,579
Florida:
$3,211
(% of AGI for various income ranges: 12.5% for AGIs below $10k, 4.8% for AGIs $10k-25k, 2.9% for AGIs $25k-50k, 2.3% for AGIs $50k-75k, 2.5% for AGIs $75k-100k, 3.4% for AGIs over 100k)
Taxable dividends: $3,382 (reported on 31.2% of returns)
Here:
$3,382
State:
$6,129
(% of AGI for various income ranges: 11.5% for AGIs below $10k, 3.6% for AGIs $10k-25k, 1.9% for AGIs $25k-50k, 2.0% for AGIs $50k-75k, 2.4% for AGIs $75k-100k, 3.0% for AGIs over 100k)
Net capital gain/loss: +$9,542 (reported on 25.2% of returns)
Here:
+$9,542
State:
+$27,205
(% of AGI for various income ranges: -6.3% for AGIs below $10k, 0.6% for AGIs $10k-25k, 1.2% for AGIs $25k-50k, 1.9% for AGIs $50k-75k, 3.8% for AGIs $75k-100k, 16.6% for AGIs over 100k)
Profit/loss from business: +$10,164 (reported on 12.3% of returns)
Here:
+$10,164
State:
+$10,634
(% of AGI for various income ranges: 13.4% for AGIs below $10k, 3.8% for AGIs $10k-25k, 2.7% for AGIs $25k-50k, 2.0% for AGIs $50k-75k, 2.4% for AGIs $75k-100k, 3.8% for AGIs over 100k)
Profit/loss from farming: +$1,897 (reported on 0.4% of returns)
Here:
+$1,897
State:
-$6,005
IRA payment deduction: $3,540 (reported on 2.8% of returns)
32778:
$3,540
Florida:
$3,082
(% of AGI for various income ranges: 0.2% for AGIs $10k-25k, 0.3% for AGIs $25k-50k, 0.2% for AGIs $50k-75k, 0.2% for AGIs $75k-100k, 0.2% for AGIs over 100k)
Self-employed pension: $11,350 (reported on 0.3% of returns)
Here:
$11,350
Florida:
$15,857
Total itemized deductions: $16,867 (24% of AGI, reported on 26.8% of returns)
Here:
$16,867
State:
$20,370
Here:
23.6% of AGI
State:
20.7% of AGI
(% of AGI for various income ranges: 28.3% for AGIs below $10k, 10.3% for AGIs $10k-25k, 11.4% for AGIs $25k-50k, 11.5% for AGIs $50k-75k, 13.8% for AGIs $75k-100k, 9.4% for AGIs over 100k)
Charity contributions deductions: $3,719 (5% of AGI, reported on 22.1% of returns)
Here:
$3,719
State:
$4,064
Here:
4.9% of AGI
State:
3.8% of AGI
(% of AGI for various income ranges: 1.6% for AGIs below $10k, 1.1% for AGIs $10k-25k, 1.6% for AGIs $25k-50k, 1.7% for AGIs $50k-75k, 2.7% for AGIs $75k-100k, 2.7% for AGIs over 100k)
Total tax: $5,813 (reported on 74.3% of returns)
32778:
$5,813
State:
$9,431
(% of AGI for various income ranges: 4.4% for AGIs below $10k, 3.5% for AGIs $10k-25k, 6.9% for AGIs $25k-50k, 9.0% for AGIs $50k-75k, 10.7% for AGIs $75k-100k, 18.5% for AGIs over 100k)
Earned income credit: $1,706 (reported on 14.2% of returns)
Here:
$1,706
State:
$1,808
Percentage of individuals using paid preparers for their 2004 taxes: 59.4%
Here:
59%
State:
60%
(% for various income ranges: 52.6% for AGIs below $10k, 61.3% for AGIs $10k-25k, 58.1% for AGIs $25k-50k, 57.7% for AGIs $50k-75k, 63.4% for AGIs $75k-100k, 74.8% for AGIs over 100k)
Likely homosexual households (counted as self-reported same-sex unmarried-partner households)
Lesbian couples: 0.2% of all households
Gay men: 0.0% of all households
Household received Food Stamps/SNAP in the past 12 months: 1,182 Household did not receive Food Stamps/SNAP in the past 12 months: 10,264
Women who had a birth in the past 12 months: 134 (65 now married, 65 unmarried) Women who did not have a birth in the past 12 months: 4,083 (1,700 now married, 2,383 unmarried)
Housing units in zip code 32778 with a mortgage: 3,896 (151 second mortgage, 86 both second mortgage and home equity loan) Houses without a mortgage: 28
Median monthly owner costs for units with a mortgage: $1,493 Median monthly owner costs for units without a mortgage: $508
Residents with income below the poverty level in 2022:
This zip code:
11.9%
Whole state:
12.7%
Residents with income below 50% of the poverty level in 2022:
This zip code:
6.7%
Whole state:
6.6%
Median number of rooms in houses and condos:
Here:
5.6
State:
5.9
Median number of rooms in apartments:
Here:
4.3
State:
4.2
Notable locations in this zip code not listed on our city pages
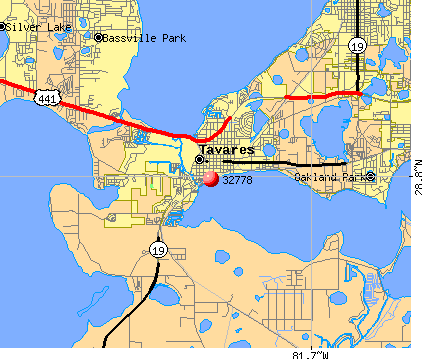
Notable locations in zip code 32778: Twin Rivers Golf Club (A), Turtle Creek Golf Club (B), Taveres Center (C), Doctor Argin A Boggus Stadium (D), Deer Island Country Club (E), Tavares Public Library (F), Lake County Historical Museum (G), Lake County Judicial Center (H), Lake County Administration Building (I), Lake County Court House (J), Tavares School Media Center (K), Lake Tech Institute of Public Safety (L), Tavares Fire Department Station 2 (M), Woodlea Road Water Reclamation Facility (N), Lake County Library Services (O), Lake County Agricultural Center (P), Tavares National Guard Armory (Q), Lake County School Board (R), Tavares Fire Department Station 1 (S), Lake County Tax Collector's Branch Office (T). Display/hide their locations on the map
Churches in zip code 32778 include: Oviedo Congregation of Jehovahs Witnesses (A), Union Congregational Church (B), Trinity Chapel Mennonite Church (C), Tavares Church of the Nazarene (D), Tavares Church of God (E), Praise Tabernacle Church (F), Mid - Lakes Christian Church (G), Friendship Church (H), Liberty Baptist Church (I). Display/hide their locations on the map
Lakes and reservoirs: Lake Beauclair (A), Lake Newark (B), Lake Idamere (C), Lake Juniata (D), King Lake (E), Pretty Lake (F), Lake Virginia (G), Dague Lake (H). Display/hide their locations on the map
Parks in zip code 32778 include: Summerall Park (1), Trimble Park (2), Wooten Park (3), Woodlea Sports Complex (4), Fred Stover Park Sports Complex (5), Ridge Park (6). Display/hide their locations on the map
In group quarters: 1,037 (-1 institutionalized population)
Size of family households: 4,348 2-persons, 1,038 3-persons, 933 4-persons, 459 5-persons, 172 6-persons, 9 7-or-more-persons
Size of nonfamily households: 3,876 1-person, 533 2-persons, 36 3-persons
2,450 married couples with children.
1,083 single-parent households (260 men, 823 women).
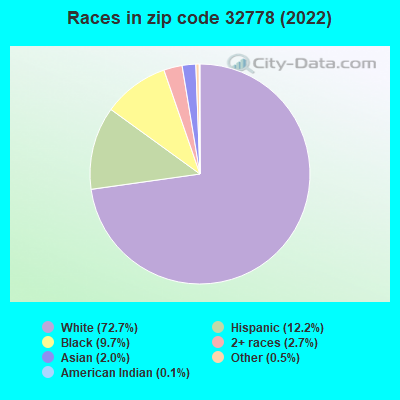
86.8% of residents of 32778 zip code speak English at home.
10.8% of residents speak Spanish at home (59% very well, 19% well, 11% not well, 11% not at all).
2.0% of residents speak other Indo-European language at home (70% very well, 17% well, 13% not well).
0.6% of residents speak Asian or Pacific Island language at home (67% very well, 24% well, 9% not well).
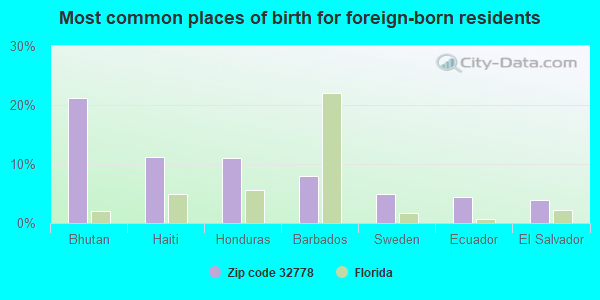
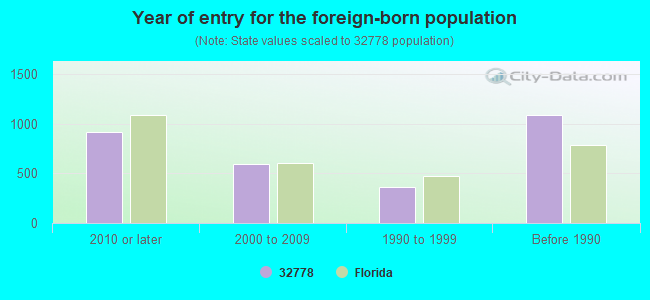
Foreign born population: 2,153 (8.6%) (62.5% of them are naturalized citizens)
This zip code:
8.6%
Whole state:
21.7%
21%Bhutan
11%Haiti
11%Honduras
8%Barbados
5%Sweden
4%Ecuador
4%El Salvador
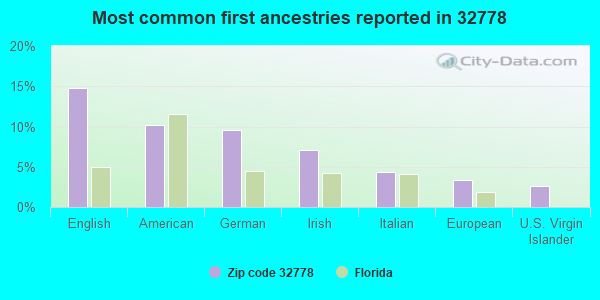
15%English
10%American
10%German
7%Irish
4%Italian
3%European
3%U.S. Virgin Islander
Year of entry for the foreign-born population
9142010 or later
5912000 to 2009
3621990 to 1999
1,086Before 1990
Major facilities with environmental interests located in this zip code:
IMPERIAL HOMES OF CENTRAL FLORIDA (29425 HWY 561 in TAVARES, FL)
STATE MASTER (FDM) - CHAZ-FLR000013680, HAZARDOUS WASTE REGULATION PROGRAM (Resource Conservation and Recovery Act (tracking hazardous waste)) Business SIC classification: GENERAL CONTRACTORS-SINGLE-FAMILY HOUSES Organizations: NON NOTIFIED (CONTACT/OWNER)
COUNTY SUPERINTENDENT'S OFFICE (201 WEST BURLEIGH BLVD. in TAVARES, FL)
(National Center for Education Statistics) - STATE ID-9001 Organizations: LAKE COUNTY SCHOOL DISTRICT (SCHOOL DISTRICT)
NONSCHOOL EXCEPTIONAL EDUCATION (201 W. BURLEIGH BOULEVARD in TAVARES, FL)
(National Center for Education Statistics) - STATE ID-9004 Organizations: LAKE COUNTY SCHOOL DISTRICT (SCHOOL DISTRICT)
LAKE COUNTY ACER PROGRAM (551 WEST MAIN STREET in TAVARES, FL)
(National Center for Education Statistics) - STATE ID-9013 Organizations: LAKE COUNTY SCHOOL DISTRICT (SCHOOL DISTRICT)
CITY OF TAVARES (100 N DISSTON AVE in TAVARES, FL)
National Pollutant Discharge Elimination System NON-MAJOR (Tracking pollutant discharge elimination systems) - permit (Resource Conservation and Recovery Act (tracking hazardous waste)) Organizations: NON NOTIFIER (CONTACT/OWNER)
Alternative names: CITY OF TAVARES UTILITIES
ADD LANES/RECONSTRUCT SR 426 (ADD LANES/RECONSTRUCT SR 500 F in TAVARES, FL)
National Pollutant Discharge Elimination System NON-MAJOR (Tracking pollutant discharge elimination systems) - permit Organizations: FREDERICK BIRNIE (CONTACT/OWNER)
LAKESHORE DRIVE - PHASE III (LAKESHORE DRIVE BETWEEN BAY RD in TAVARES, FL)
National Pollutant Discharge Elimination System NON-MAJOR (Tracking pollutant discharge elimination systems) - permit Organizations: ROY SCHULTZ (CONTACT/OWNER)
S.N. KNIGHT NORTH,AREA2,LAKE G (EAST SHORE LAKE GRIFFIN-YALE G in NEAR LEESBURG, FL)
National Pollutant Discharge Elimination System NON-MAJOR (Tracking pollutant discharge elimination systems) - permit Organizations: MARK SOWARDS (CONTACT/OWNER)
ROYAL HARBOR LIGHTHOUSE PLAZA (E SIDE SR 19 in TAVARES, FL)
National Pollutant Discharge Elimination System NON-MAJOR (Tracking pollutant discharge elimination systems) - permit Organizations: JIM DEITCH (CONTACT/OWNER)
ROYAL HARBOR PHASE 5 (E SIDE SR 19 in TAVARES, FL)
National Pollutant Discharge Elimination System NON-MAJOR (Tracking pollutant discharge elimination systems) - permit Organizations: JIM DEITCH (CONTACT/OWNER)
LAKESHORE DRIVE CR 452 PHASE I (LAKESHORE DRIVE STA. 11+31.61 in TAVARES, FL)
National Pollutant Discharge Elimination System NON-MAJOR (Tracking pollutant discharge elimination systems) - permit Organizations: JOHN GIBBS (CONTACT/OWNER)
84 LUMBER EXPANSION (CR 561 in TAVARES, FL)
National Pollutant Discharge Elimination System NON-MAJOR (Tracking pollutant discharge elimination systems) - permit Organizations: JIM ZAUNICK (CONTACT/OWNER)
AG CARRIERS (13341 SOUTHRIDGE INDUSTRIAL DR in TAVARES, FL)
(Resource Conservation and Recovery Act (tracking hazardous waste)) Organizations: NON NOTIFIER (CONTACT/OWNER)
Housing units lacking complete plumbing facilities: 0.4% Housing units lacking complete kitchen facilities: 2.7%
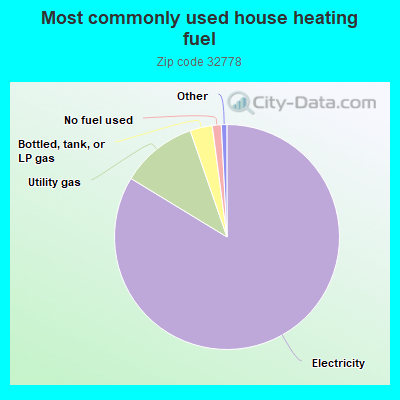
83.8%Electricity
11.0%Utility gas
3.2%Bottled, tank, or LP gas
1.3%No fuel used
Population in 1990: 12,131. Population change in the 1990s: +2,085 (+17.2%).
Place of birth for U.S.-born residents:
This state: 7,721
Northeast: 5,142
Midwest: 5,390
South: 2,971
West: 713
52% of the 32778 zip code residents lived in the same house 5 years ago. Out of people who lived in different houses, 50% lived in this county. Out of people who lived in different counties, 50% lived in Florida.
87% of the 32778 zip code residents lived in the same house 1 year ago. Out of people who lived in different houses, 38% moved from this county. Out of people who lived in different houses, 33% moved from different county within same state. Out of people who lived in different houses, 23% moved from different state. Out of people who lived in different houses, 6% moved from abroad.
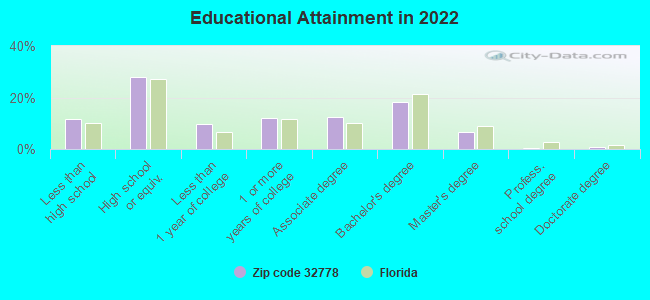
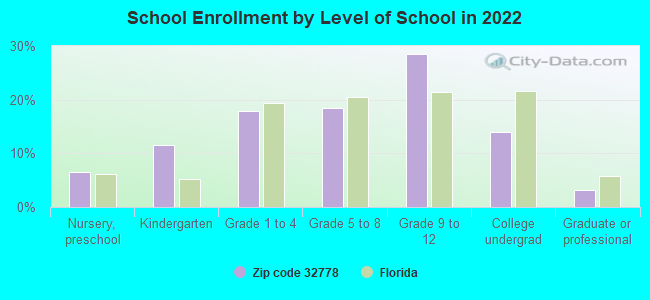
Private vs. public school enrollment:
Students in private schools in grades 1 to 8 (elementary and middle school): 470
Here:
32.3%
Florida:
15.8%
Students in private schools in grades 9 to 12 (high school): 219
Here:
19.3%
Florida:
12.9%
Students in private undergraduate colleges: 90
Here:
16.4%
Florida:
23.6%
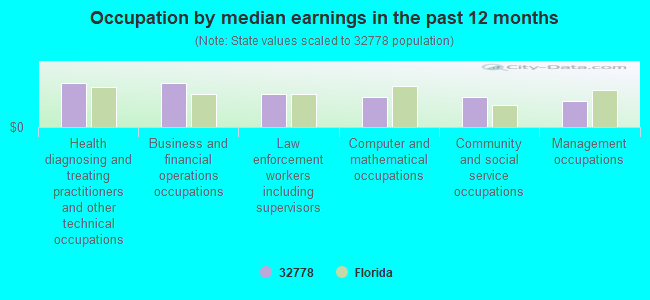
Occupation by median earnings in the past 12 months ($)
101,613Health diagnosing and treating practitioners and other technical occupations
100,600Business and financial operations occupations
77,005Law enforcement workers including supervisors
69,249Computer and mathematical occupations
68,867Community and social service occupations
61,004Management occupations
Top industries in this zip code by the number of employees in 2005:
Health Care and Social Assistance: General Medical and Surgical Hospitals (over 1000 employees: 1 establishment)
Health Care and Social Assistance: Home Health Care Services (250-499: 1, 100-249: 1, 10-19: 1, 1-4: 1)
Health Care and Social Assistance: Offices of Physicians (except Mental Health Specialists) (20-49: 3, 10-19: 5, 5-9: 4, 1-4: 12)
Professional, Scientific, and Technical Services: Offices of Lawyers (10-19: 2, 5-9: 7, 1-4: 25)
2002 - 2018 National Fire Incident Reporting System (NFIRS) incidents
Based on the data from the years 2002 - 2018 the average number of fire incidents per year is 71. The highest number of reported fire incidents - 124 took place in 2018, and the least - 51 in 2003. The data has an increasing trend.
When looking into fire subcategories, the most reports belonged to: Outside Fires (45.4%), and Structure Fires (32.8%).
Fire incident types reported to NFIRS in Zip Code 32778


+$1,897
-$6,005
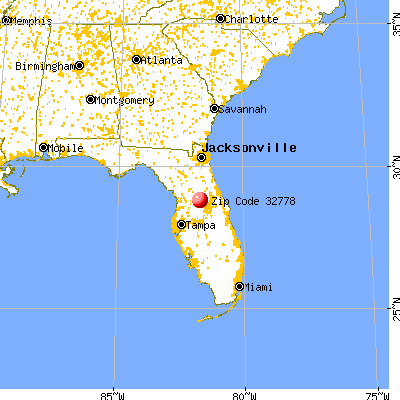
 Nearest zip codes: 34705, 32757, 32726, 34737, 34797, 32735.
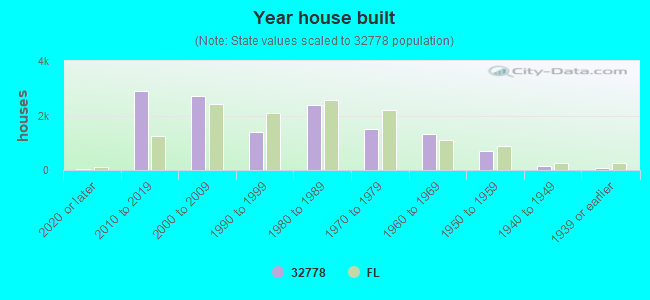


 Based on the data from the years 2002 - 2018 the average number of fire incidents per year is 71. The highest number of reported fire incidents - 124 took place in 2018, and the least - 51 in 2003. The data has an increasing trend.
 When looking into fire subcategories, the most reports belonged to: Outside Fires (45.4%), and Structure Fires (32.8%).