Estimated zip code population in 2022: 28,389 Zip code population in 2010: 24,969 Zip code population in 2000: 26,867
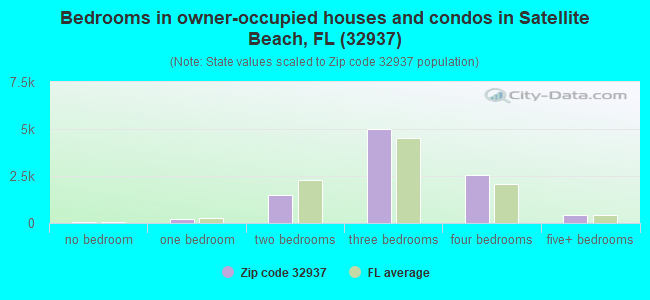
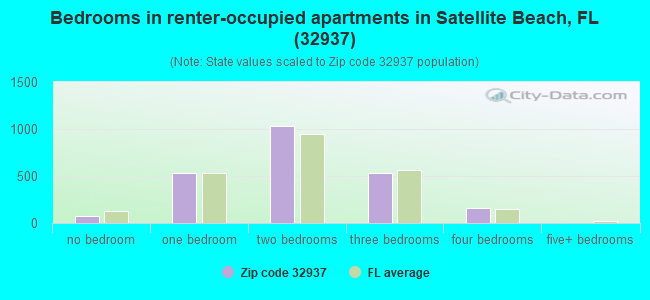
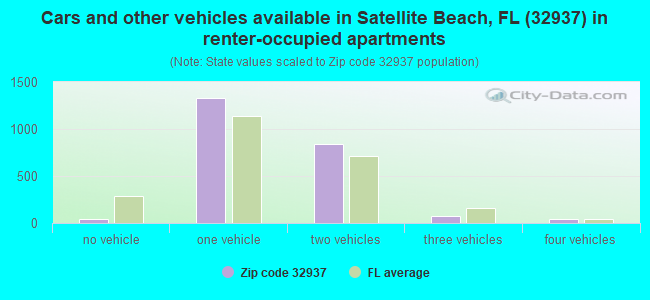
Houses and condos: 13,791 Renter-occupied apartments: 2,339
% of renters here:
19%
State:
33%
March 2022 cost of living index in zip code 32937: 91.3 (less than average, U.S. average is 100)
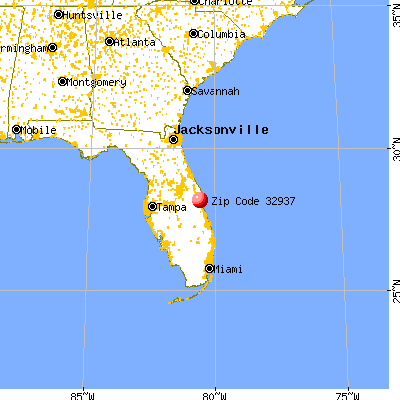
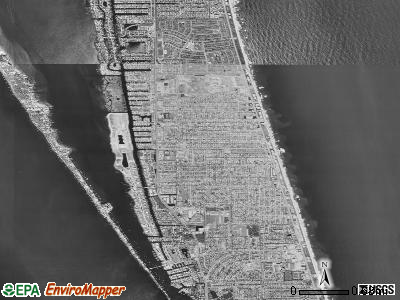
Land area: 6.7 sq. mi. Water area: 3.7 sq. mi.
Population density: 4,223 people per square mile
(average).
OSM Map
General Map
Google Map
MSN Map
OSM Map
General Map
Google Map
MSN Map
OSM Map
General Map
Google Map
MSN Map
OSM Map
General Map
Google Map
MSN Map
Please wait while loading the map...
Real estate property taxes paid for housing units in 2022:
This zip code:
0.7% ($3,268)
Florida:
0.7% ($2,529)
Median real estate property taxes paid for housing units with mortgages in 2022: $3,472 (0.7%) Median real estate property taxes paid for housing units with no mortgage in 2022: $3,057 (0.7%)
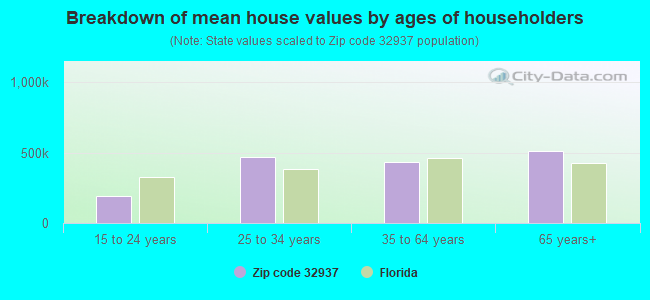
Estimated median house/condo value in 2022: $474,557
32937:
$474,557
Florida:
$354,100
According to our research of Florida and other state lists, there were 10 registered sex offenders living in 32937 zip code as of April 27, 2024. The ratio of all residents to sex offenders in zip code 32937 is 2,670 to 1. The ratio of registered sex offenders to all residents in this zip code is much lower than the state average.
Median resident age:
This zip code:
47.0 years
Florida median age:
42.7 years
Average household size:
This zip code:
2.4 people
Florida:
2.5 people
Averages for the 2020 tax year for zip code 32937, filed in 2021:
Average Adjusted Gross Income (AGI) in 2020: $121,673 (Individual Income Tax Returns)
Here:
$121,673
State:
$82,200
Salary/wage: $92,070 (reported on 72.2% of returns)
Here:
$92,070
State:
$58,347
(% of AGI for various income ranges: 1122.2% for AGIs below $25k, 3304.3% for AGIs $25k-50k, 5772.1% for AGIs $50k-75k, 8488.1% for AGIs $75k-100k, 16590.1% for AGIs $100k-200k, 90071.5% for AGIs over 200k)
Taxable interest for individuals: $2,750 (reported on 44.5% of returns)
This zip code:
$2,750
Florida:
$4,272
(% of AGI for various income ranges: 38.4% for AGIs below $25k, 55.9% for AGIs $25k-50k, 82.5% for AGIs $50k-75k, 149.6% for AGIs $75k-100k, 222.5% for AGIs $100k-200k, 1948.1% for AGIs over 200k)
Ordinary dividends: $10,870 (reported on 34.0% of returns)
Here:
$10,870
State:
$15,863
(% of AGI for various income ranges: 57.6% for AGIs below $25k, 104.4% for AGIs $25k-50k, 241.8% for AGIs $50k-75k, 318.4% for AGIs $75k-100k, 610.3% for AGIs $100k-200k, 6900.2% for AGIs over 200k)
Net capital gain/loss in AGI: +$37,072 (reported on 31.6% of returns)
Here:
+$37,072
State:
+$62,983
(% of AGI for various income ranges: 31.3% for AGIs below $25k, 79.1% for AGIs $25k-50k, 192.9% for AGIs $50k-75k, 314.0% for AGIs $75k-100k, 953.1% for AGIs $100k-200k, 29810.9% for AGIs over 200k)
Profit/loss from business: +$16,597 (reported on 16.6% of returns)
Here:
+$16,597
State:
+$9,719
(% of AGI for various income ranges: 172.3% for AGIs below $25k, 176.4% for AGIs $25k-50k, 299.5% for AGIs $50k-75k, 309.2% for AGIs $75k-100k, 523.8% for AGIs $100k-200k, 3417.7% for AGIs over 200k)
Taxable individual retirement arrangement distribution: $26,330 (reported on 15.1% of returns)
32937:
$26,330
Florida:
$24,823
(% of AGI for various income ranges: 106.7% for AGIs below $25k, 216.5% for AGIs $25k-50k, 467.0% for AGIs $50k-75k, 549.0% for AGIs $75k-100k, 1140.6% for AGIs $100k-200k, 4232.3% for AGIs over 200k)
Self-employed (Keogh) retirement plans: $28,330 (reported on 0.7% of returns)
32937:
$28,330
Florida:
$29,694
(% of AGI for various income ranges: 33.1% for AGIs $100k-200k, 490.0% for AGIs over 200k)
Total itemized deductions: $37,509 (reported on 11.0% of returns)
Here:
$37,509
State:
$45,393
(% of AGI for various income ranges: 57.6% for AGIs below $25k, 156.9% for AGIs $25k-50k, 377.1% for AGIs $50k-75k, 511.2% for AGIs $75k-100k, 871.0% for AGIs $100k-200k, 6378.7% for AGIs over 200k)
Charity contributions: $14,126 (reported on 8.9% of returns)
Here:
$14,126
State:
$20,178
(% of AGI for various income ranges: 3.0% for AGIs below $25k, 16.9% for AGIs $25k-50k, 42.7% for AGIs $50k-75k, 80.7% for AGIs $75k-100k, 212.4% for AGIs $100k-200k, 2656.6% for AGIs over 200k)
Taxes paid: $7,232 (reported on 10.8% of returns)
32937:
$7,232
State:
$6,967
(% of AGI for various income ranges: 9.4% for AGIs below $25k, 21.8% for AGIs $25k-50k, 74.5% for AGIs $50k-75k, 98.8% for AGIs $75k-100k, 205.9% for AGIs $100k-200k, 1089.4% for AGIs over 200k)
Earned income credit: $1,710 (reported on 9.1% of returns)
Here:
$1,710
State:
$2,306
(% of AGI for various income ranges: 58.6% for AGIs below $25k, 43.9% for AGIs $25k-50k)
Percentage of individuals using paid preparers for their 2020 taxes: 91.5%
Here:
91%
State:
92%
(% for various income ranges: 90.1% for AGIs below $25k, 92.2% for AGIs $25k-50k, 91.8% for AGIs $50k-75k, 91.1% for AGIs $75k-100k, 91.4% for AGIs $100k-200k, 93.9% for AGIs over 200k)
Averages for the 2012 tax year for zip code 32937, filed in 2013:
Average Adjusted Gross Income (AGI) in 2012: $80,533 (Individual Income Tax Returns)
Here:
$80,533
State:
$60,316
Salary/wage: $64,002 (reported on 73.2% of returns)
Here:
$64,002
State:
$45,277
(% of AGI for various income ranges: 67.8% for AGIs below $25k, 65.9% for AGIs $25k-50k, 62.2% for AGIs $50k-75k, 60.8% for AGIs $75k-100k, 66.0% for AGIs $100k-200k, 48.3% for AGIs over 200k)
Taxable interest for individuals: $2,838 (reported on 44.3% of returns)
This zip code:
$2,838
Florida:
$3,587
(% of AGI for various income ranges: 2.4% for AGIs below $25k, 1.3% for AGIs $25k-50k, 1.2% for AGIs $50k-75k, 1.2% for AGIs $75k-100k, 1.2% for AGIs $100k-200k, 2.0% for AGIs over 200k)
Ordinary dividends: $7,800 (reported on 31.6% of returns)
Here:
$7,800
State:
$12,831
(% of AGI for various income ranges: 3.3% for AGIs below $25k, 2.4% for AGIs $25k-50k, 2.4% for AGIs $50k-75k, 2.6% for AGIs $75k-100k, 2.7% for AGIs $100k-200k, 3.7% for AGIs over 200k)
Net capital gain/loss in AGI: +$19,496 (reported on 26.7% of returns)
Here:
+$19,496
State:
+$33,493
(% of AGI for various income ranges: 0.2% for AGIs $25k-50k, 0.6% for AGIs $50k-75k, 1.2% for AGIs $75k-100k, 1.5% for AGIs $100k-200k, 15.2% for AGIs over 200k)
Profit/loss from business: +$15,312 (reported on 15.7% of returns)
Here:
+$15,312
State:
+$10,012
(% of AGI for various income ranges: 8.5% for AGIs below $25k, 3.7% for AGIs $25k-50k, 2.1% for AGIs $50k-75k, 2.1% for AGIs $75k-100k, 2.2% for AGIs $100k-200k, 3.1% for AGIs over 200k)
Taxable individual retirement arrangement distribution: $21,485 (reported on 16.9% of returns)
32937:
$21,485
Florida:
$21,544
(% of AGI for various income ranges: 6.1% for AGIs below $25k, 4.5% for AGIs $25k-50k, 4.2% for AGIs $50k-75k, 4.9% for AGIs $75k-100k, 4.8% for AGIs $100k-200k, 4.1% for AGIs over 200k)
Self-employment retirement plans: $20,300 (reported on 0.5% of returns)
32937:
$20,300
Florida:
$20,611
Total itemized deductions: $25,336 (16% of AGI, reported on 31.7% of returns)
Here:
$25,336
State:
$25,533
Here:
16.0% of AGI
State:
18.0% of AGI
(% of AGI for various income ranges: 12.3% for AGIs below $25k, 10.8% for AGIs $25k-50k, 10.6% for AGIs $50k-75k, 9.9% for AGIs $75k-100k, 10.6% for AGIs $100k-200k, 8.9% for AGIs over 200k)
Charity contributions: $5,637 (reported on 25.5% of returns)
Here:
$5,637
State:
$5,698
(% of AGI for various income ranges: 0.7% for AGIs below $25k, 1.0% for AGIs $25k-50k, 1.1% for AGIs $50k-75k, 1.3% for AGIs $75k-100k, 1.7% for AGIs $100k-200k, 2.5% for AGIs over 200k)
Taxes paid: $6,840 (reported on 31.2% of returns)
32937:
$6,840
State:
$6,203
(% of AGI for various income ranges: 2.2% for AGIs below $25k, 2.0% for AGIs $25k-50k, 2.1% for AGIs $50k-75k, 2.2% for AGIs $75k-100k, 2.9% for AGIs $100k-200k, 3.0% for AGIs over 200k)
Earned income credit: $1,858 (reported on 11.8% of returns)
Here:
$1,858
State:
$2,372
(% of AGI for various income ranges: 4.1% for AGIs below $25k, 0.7% for AGIs $25k-50k)
Percentage of individuals using paid preparers for their 2012 taxes: 47.7%
Here:
48%
State:
54%
(% for various income ranges: 43.7% for AGIs below $25k, 45.2% for AGIs $25k-50k, 47.9% for AGIs $50k-75k, 47.7% for AGIs $75k-100k, 49.7% for AGIs $100k-200k, 74.7% for AGIs over 200k)
Averages for the 2004 tax year for zip code 32937, filed in 2005:
Average Adjusted Gross Income (AGI) in 2004: $60,156 (Individual Income Tax Returns)
Here:
$60,156
State:
$50,523
Salary/wage: $50,805 (reported on 73.3% of returns)
Here:
$50,805
State:
$39,563
(% of AGI for various income ranges: 254.4% for AGIs below $10k, 64.2% for AGIs $10k-25k, 65.0% for AGIs $25k-50k, 61.9% for AGIs $50k-75k, 65.1% for AGIs $75k-100k, 58.0% for AGIs over 100k)
Taxable interest for individuals: $2,515 (reported on 57.8% of returns)
This zip code:
$2,515
Florida:
$3,211
(% of AGI for various income ranges: 18.6% for AGIs below $10k, 3.5% for AGIs $10k-25k, 2.6% for AGIs $25k-50k, 2.3% for AGIs $50k-75k, 2.0% for AGIs $75k-100k, 2.2% for AGIs over 100k)
Taxable dividends: $3,886 (reported on 37.1% of returns)
Here:
$3,886
State:
$6,129
(% of AGI for various income ranges: 14.2% for AGIs below $10k, 3.1% for AGIs $10k-25k, 2.4% for AGIs $25k-50k, 2.0% for AGIs $50k-75k, 2.5% for AGIs $75k-100k, 2.3% for AGIs over 100k)
Net capital gain/loss: +$16,377 (reported on 32.1% of returns)
Here:
+$16,377
State:
+$27,205
(% of AGI for various income ranges: -3.0% for AGIs below $10k, 0.1% for AGIs $10k-25k, 0.7% for AGIs $25k-50k, 1.8% for AGIs $50k-75k, 2.7% for AGIs $75k-100k, 15.5% for AGIs over 100k)
Profit/loss from business: +$14,148 (reported on 14.6% of returns)
Here:
+$14,148
State:
+$10,634
(% of AGI for various income ranges: 9.5% for AGIs below $10k, 5.4% for AGIs $10k-25k, 3.3% for AGIs $25k-50k, 2.0% for AGIs $50k-75k, 2.3% for AGIs $75k-100k, 3.9% for AGIs over 100k)
IRA payment deduction: $3,240 (reported on 3.7% of returns)
32937:
$3,240
Florida:
$3,082
(% of AGI for various income ranges: 1.7% for AGIs below $10k, 0.3% for AGIs $10k-25k, 0.3% for AGIs $25k-50k, 0.3% for AGIs $50k-75k, 0.2% for AGIs $75k-100k, 0.1% for AGIs over 100k)
Self-employed pension: $16,142 (reported on 0.8% of returns)
Here:
$16,142
Florida:
$15,857
Total itemized deductions: $20,947 (21% of AGI, reported on 36.8% of returns)
Here:
$20,947
State:
$20,370
Here:
20.6% of AGI
State:
20.7% of AGI
(% of AGI for various income ranges: 53.8% for AGIs below $10k, 15.7% for AGIs $10k-25k, 15.0% for AGIs $25k-50k, 13.9% for AGIs $50k-75k, 13.9% for AGIs $75k-100k, 10.9% for AGIs over 100k)
Charity contributions deductions: $3,872 (4% of AGI, reported on 32.1% of returns)
Here:
$3,872
State:
$4,064
Here:
3.6% of AGI
State:
3.8% of AGI
(% of AGI for various income ranges: 2.4% for AGIs below $10k, 1.2% for AGIs $10k-25k, 1.4% for AGIs $25k-50k, 1.6% for AGIs $50k-75k, 1.7% for AGIs $75k-100k, 2.6% for AGIs over 100k)
Total tax: $10,901 (reported on 79.5% of returns)
32937:
$10,901
State:
$9,431
(% of AGI for various income ranges: 7.8% for AGIs below $10k, 4.3% for AGIs $10k-25k, 7.2% for AGIs $25k-50k, 9.4% for AGIs $50k-75k, 11.0% for AGIs $75k-100k, 19.8% for AGIs over 100k)
Earned income credit: $1,439 (reported on 9.3% of returns)
Here:
$1,439
State:
$1,808
Percentage of individuals using paid preparers for their 2004 taxes: 53.3%
Here:
53%
State:
60%
(% for various income ranges: 47.9% for AGIs below $10k, 54.7% for AGIs $10k-25k, 54.9% for AGIs $25k-50k, 52.1% for AGIs $50k-75k, 51.5% for AGIs $75k-100k, 58.4% for AGIs over 100k)
Likely homosexual households (counted as self-reported same-sex unmarried-partner households)
Lesbian couples: 0.0% of all households
Gay men: 0.1% of all households
Household received Food Stamps/SNAP in the past 12 months: 358 Household did not receive Food Stamps/SNAP in the past 12 months: 11,693
Women who had a birth in the past 12 months: 282 (264 now married, 28 unmarried) Women who did not have a birth in the past 12 months: 5,055 (2,324 now married, 2,732 unmarried)
Housing units in zip code 32937 with a mortgage: 5,601 (583 second mortgage, 11 home equity loan, 477 both second mortgage and home equity loan) Houses without a mortgage: 178
Median monthly owner costs for units with a mortgage: $2,122 Median monthly owner costs for units without a mortgage: $756
Residents with income below the poverty level in 2022:
This zip code:
8.3%
Whole state:
12.7%
Residents with income below 50% of the poverty level in 2022:
This zip code:
3.8%
Whole state:
6.6%
Median number of rooms in houses and condos:
Here:
6.2
State:
5.9
Median number of rooms in apartments:
Here:
4.4
State:
4.2
Notable locations in this zip code not listed on our city pages
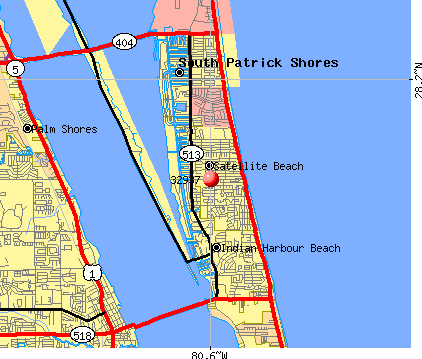
Notable locations in zip code 32937: Shoppers World (A), Patrick Plaza (B), Chabad Jewish Community Center (C), Satellite Beach Public Library (D), Satellite Beach Fire Department (E), Indian Harbour Beach Fire Department (F), Brevard County Fire Rescue Station 62 (G), Satellite Beach Police Department (H). Display/hide their locations on the map
In group quarters: 47 (-1 institutionalized population)
Size of family households: 4,051 2-persons, 1,622 3-persons, 1,243 4-persons, 637 5-persons, 75 6-persons, 55 7-or-more-persons
Size of nonfamily households: 3,576 1-person, 667 2-persons, 11 3-persons
4,202 married couples with children.
1,101 single-parent households (203 men, 898 women).
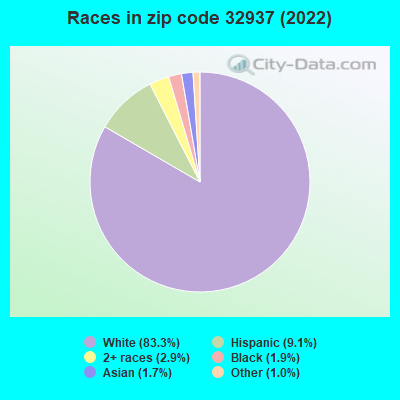
93.4% of residents of 32937 zip code speak English at home.
3.9% of residents speak Spanish at home (79% very well, 11% well, 8% not well, 2% not at all).
1.8% of residents speak other Indo-European language at home (79% very well, 17% well, 4% not well).
0.7% of residents speak Asian or Pacific Island language at home (59% very well, 41% well).
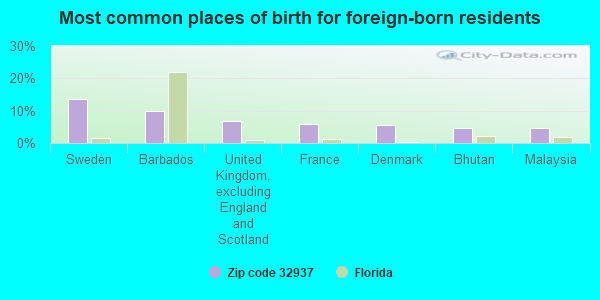
Foreign born population: 1,563 (5.5%) (70.0% of them are naturalized citizens)
This zip code:
5.5%
Whole state:
21.7%
14%Sweden
10%Barbados
7%United Kingdom, excluding England and Scotland
6%France
6%Denmark
5%Bhutan
5%Malaysia
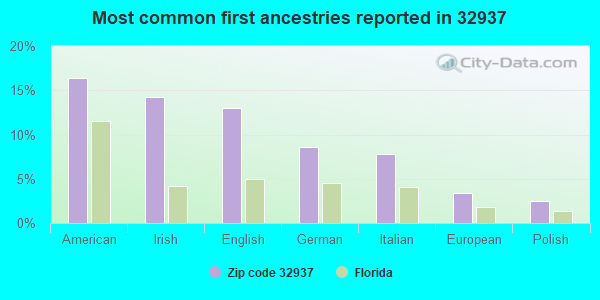
16%American
14%Irish
13%English
9%German
8%Italian
3%European
2%Polish
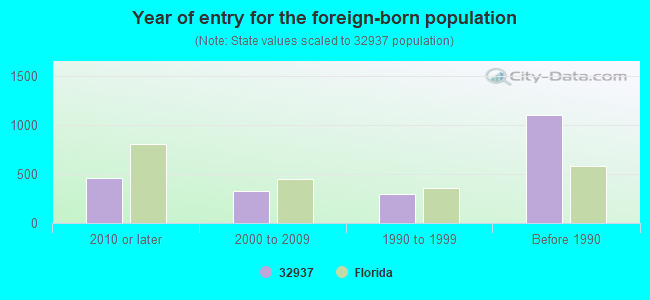
Year of entry for the foreign-born population
4602010 or later
3242000 to 2009
2951990 to 1999
1,100Before 1990
Major facilities with environmental interests located in this zip code:
SCORPION CT WATER TOWER (260 SCORPION CT in SATELLITE BEACH, FL) . Federal Facility
STATE MASTER (FDM) - CHAZ-FLR000072462, HAZARDOUS WASTE REGULATION PROGRAM HAZARDOUS WASTE BIENNIAL REPORTER (Resource Conservation and Recovery Act (tracking hazardous waste)) (Resource Conservation and Recovery Act (tracking hazardous waste)) Business SIC classification: WATER SUPPLY Organizations: US ARMY ENGINEER DIST (CONTACT/OWNER)
, PATRICK AFB (CONTACT/OWNER)
Alternative names: WATER TOWER, CITY OF MELBOURNE
DELAURA MIDDLE SCHOOL (300 JACKSON AVE in SATELLITE BEACH, FL)
(National Center for Education Statistics) - STATE ID-6012 (Resource Conservation and Recovery Act (tracking hazardous waste)) Organizations: ESTES BOBBY DIRECTOR OF PURCHASING (CONTACT/OWNER)
, BREVARD COUNTY SCHOOL DISTRICT (SCHOOL DISTRICT)
Alternative names: BREVARD CO DELAURA JR HIGH
OCEAN BREEZE ELEMENTARY SCHOOL (1101 CHEYENNE DR in INDIAN HARBOUR BEACH, FL)
(National Center for Education Statistics) - STATE ID-6071 Small Quantity Generators, between 100 kg and 1000 kg of hazardous waste/month (Resource Conservation and Recovery Act (tracking hazardous waste)) - notification Organizations: MICHAEL ROGERS, ENG ENV (CONTACT/OWNER)
, BREVARD COUNTY SCHOOL DISTRICT (SCHOOL DISTRICT)
Alternative names: BREVARD CO OCEAN BREEZE ELEMENTARY
SPESSARD L. HOLLAND ELEMENTARY SCHOOL (50 HOLLAND CT in SATELLITE BEACH, FL)
(Geographic Names Information System) (National Center for Education Statistics) - STATE ID-6013 Organizations: BREVARD COUNTY SCHOOL DISTRICT (SCHOOL DISTRICT)
SATELLITE SENIOR HIGH SCHOOL (300 SCORPION COURT in SATELLITE BEACH, FL)
(National Center for Education Statistics) - STATE ID-6011 Organizations: BREVARD COUNTY SCHOOL DISTRICT (SCHOOL DISTRICT)
PATRICK AIR FORCE BASE - SOUTH HOUSING C (121 ALAMANDA AVE. BUILDING 3659 in SATELLITE BEACH, FL) . Federal Facility
HAZARDOUS WASTE BIENNIAL REPORTER (Resource Conservation and Recovery Act (tracking hazardous waste)) Large Quantity Generators, more that 1000 kg of hazardous waste/month (Resource Conservation and Recovery Act (tracking hazardous waste)) Organizations: US AIRFORCE (CONTACT/OPERATOR)
, UNITED STATES AIR FORCE (CONTACT/OWNER)
7-11 #24254 (IW) (1899 S PATRICK DR in INDIAN HARBOR BEACH, FL)
National Pollutant Discharge Elimination System NON-MAJOR (Tracking pollutant discharge elimination systems) - permit Organizations: WILLO SMITH (CONTACT/OWNER)
7-11 #26338 (198 N A1A in SATELLITE BEACH, FL)
National Pollutant Discharge Elimination System NON-MAJOR (Tracking pollutant discharge elimination systems) - permit Organizations: WILLO SMITH (CONTACT/OWNER)
HARBOUR GLENN TOWN HOMES (S PATRICK DRIVE, S OF TOMAHAWK in BREVARD, FL)
National Pollutant Discharge Elimination System NON-MAJOR (Tracking pollutant discharge elimination systems) - permit Organizations: MICHAEL WILLIAMS (CONTACT/OWNER)
PALM SPRINGS CONDOMINIUMS (1942 HWY A1A in INDIAN HARBOUR BCH, FL)
National Pollutant Discharge Elimination System NON-MAJOR (Tracking pollutant discharge elimination systems) - permit Organizations: DAVID KIPPER (CONTACT/OWNER)
ISLAND WALK TOWNHOMES (730 LANIA CIRCLE in MELBOURNE, FL)
National Pollutant Discharge Elimination System NON-MAJOR (Tracking pollutant discharge elimination systems) - permit Organizations: ROBERT ROBB (CONTACT/OWNER)
Alternative names: STUBENHOFER, GERRY J
MIRABELLA (S PATRICK DRIVE, SOUTH OF INDR in INDIAN HARBOR BEACH, FL)
National Pollutant Discharge Elimination System NON-MAJOR (Tracking pollutant discharge elimination systems) - permit Organizations: KEVIN WILLIS (CONTACT/OWNER)
NATURAL ART INC (6060 N HARBOR CITY BLVD in MELBOURNE, FL)
(Resource Conservation and Recovery Act (tracking hazardous waste)) Organizations: DEBBIE DOOLEY, V PRES (CONTACT/OWNER)
Housing units lacking complete plumbing facilities: 1.3% Housing units lacking complete kitchen facilities: 1.9%
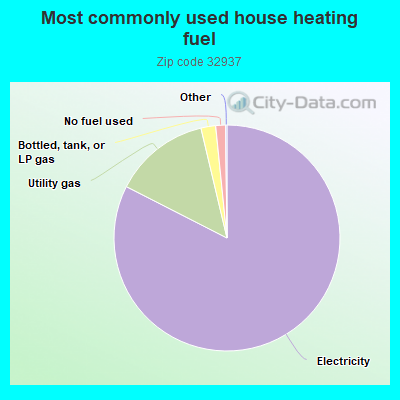
82.6%Electricity
13.8%Utility gas
2.1%Bottled, tank, or LP gas
1.4%No fuel used
Population in 1990: 28,921.
Place of birth for U.S.-born residents:
This state: 8,371
Northeast: 6,990
Midwest: 3,528
South: 5,472
West: 1,723
52% of the 32937 zip code residents lived in the same house 5 years ago. Out of people who lived in different houses, 46% lived in this county. Out of people who lived in different counties, 50% lived in Florida.
89% of the 32937 zip code residents lived in the same house 1 year ago. Out of people who lived in different houses, 48% moved from this county. Out of people who lived in different houses, 9% moved from different county within same state. Out of people who lived in different houses, 40% moved from different state. Out of people who lived in different houses, 1% moved from abroad.
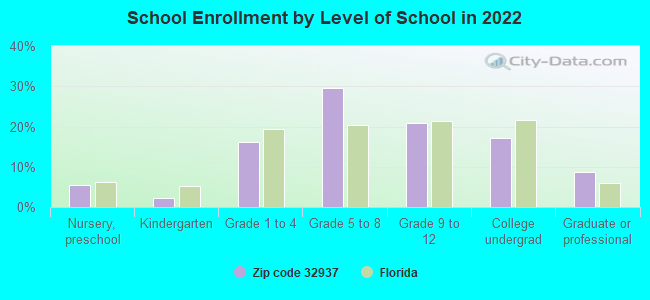
Private vs. public school enrollment:
Students in private schools in grades 1 to 8 (elementary and middle school): 343
Here:
11.1%
Florida:
15.8%
Students in private schools in grades 9 to 12 (high school): 132
Here:
9.4%
Florida:
12.9%
Students in private undergraduate colleges: 261
Here:
22.6%
Florida:
23.6%
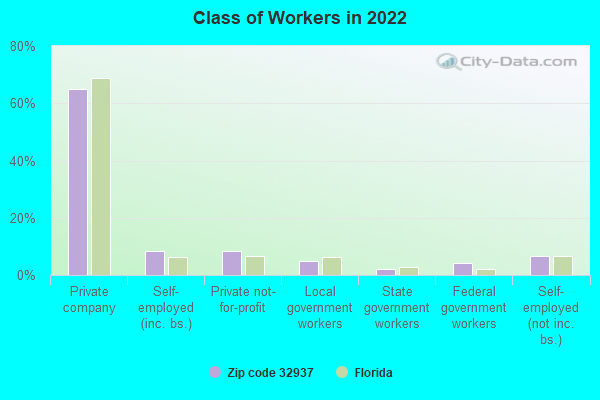
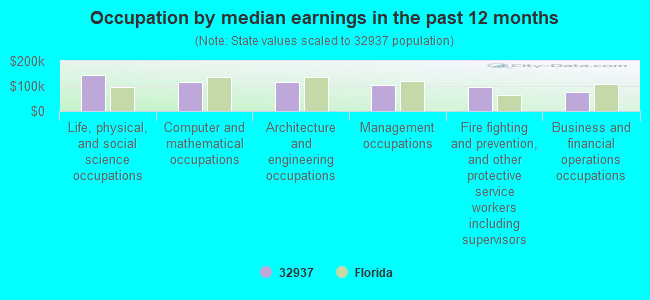
Occupation by median earnings in the past 12 months ($)
143,087Life, physical, and social science occupations
117,223Computer and mathematical occupations
116,699Architecture and engineering occupations
105,389Management occupations
95,619Fire fighting and prevention, and other protective service workers including supervisors
77,612Business and financial operations occupations
Companies with federal contracts located in this zip code:
VE ARD COMPUTER RESEARCH INC (213 HARBOUR DR W in INDIAN HARBOUR, FL; small business) : $657,154 in 21 contractsfrom 1999 to 2005
Contracts for Other ADP and Telecommunications Services (includes data storage on tapes, compact disks, etc.) by Army Signed by year:2000: $96,610; 2001: $98,350; 2002: $100,020; 2003: $101,718; 2004: $15,256; 2005: $150,380; 2006: $0.
Biggest contracts:
$179,720 with Army for Other ADP and Telecommunications Services (includes data storage on tapes, compact disks, etc.). Signed on 2005-10-12. Completion date: 2005-09-30.
$125,200 with Army for Other ADP and Telecommunications Services (includes data storage on tapes, compact disks, etc.). Taking place in TX. Signed on 2004-10-14. Completion date: 2009-09-30.
$101,715, same as above.Signed on 2003-11-18. Completion date: 2004-09-30.
$100,020, same as above.Signed on 2002-10-01. Completion date: 2003-09-30.
WIDEFI CORPORATION (258 SEAVIEW STREET in MELBOURNE, FL; small business) : $370,000 in 2 contractsin 2003
$360,000 with Army for ADP Central Processing Unit (CPU, Computer), Analog. Signed on 2003-08-25. Completion date: 2004-04-25.
$10,000, same as above.Signed on 2003-09-04. Completion date: 2004-04-25.
C & M MECHANICAL, INC (205 WIMICO DRIVE in INDIAN HARBOUR, FL; small business) 50 employees, $0 revenue. : $98,302 in 6 contractsfrom 2000 to 2002
Contracts for Non-nuclear Ship Repair (East) Ship repair (including overhauls and conversions) performed on non-nuclear propelled and nonpropelled ships east of the 108th meridian, Marine Charter for Things by Navy Signed by year:2000: $9,675; 2001: $39,627; 2002: $49,000; 2003: $0; 2004: $0; 2005: $0; 2006: $0.
Biggest contracts:
$32,197 with Navy for Non-nuclear Ship Repair (East) Ship repair (including overhauls and conversions) performed on non-nuclear propelled and nonpropelled ships east of the 108th meridian. Signed on 2001-07-11. Completion date: 2001-09-28.
$32,000 with Navy for Marine Charter for Things. Signed on 2002-11-05. Completion date: 2002-11-15.
$17,000 with Navy for Non-nuclear Ship Repair (East) Ship repair (including overhauls and conversions) performed on non-nuclear propelled and nonpropelled ships east of the 108th meridian. Signed on 2002-12-24. Completion date: 2003-01-03.
$9,675, same as above.Signed on 2000-02-04. Completion date: 2000-02-17.
JENNIFER L. WISHTISCHIN (70 N. OAK DRIVE in SATELLITE BEAC, FL; small business) : $32,445 in 2 contractsin 1999
$32,445 with Air Force for Nursing Services. Signed on 1999-10-19. Completion date: 2000-09-30.
$0, same as above.Signed on 1999-10-19. Completion date: 2000-09-30.
ROBERT E BRISTOW (582 CARRIAGE CIR in SATELLITE BEAC, FL; small business) : $22,400 in 2 contractsin 2004
$12,000 with Air Force for Education Services. Signed on 2004-10-01. Completion date: 2005-09-30.
$10,400, same as above.Signed on 2004-10-01. Completion date: 2005-09-30.
BULLION INTERNATIONAL INC (4100 N RIVERSIDE DR in MELBOURNE, FL; small business)
$15,120 with Army for Badges and Insignia. Taking place in GA. Signed on 2005-06-03. Completion date: 2005-06-15.
ADVANTA TECHNOLOGIES INC (1757 S PATRICK DR in SATELLITE BEAC, FL; small business)
$6,290 with Air Force for ADP Components. Signed on 2005-09-14. Completion date: 2005-10-04.
WATER SAFETY PRODUCTS INC (128 TOMAHAWK DR in SATELLITE BEAC, FL; small business)
$5,583 with Army for Athletic and Sporting Equipment. Signed on 2005-09-30. Completion date: 2005-11-01.
Top industries in this zip code by the number of employees in 2005:
2002 - 2018 National Fire Incident Reporting System (NFIRS) incidents
According to the data from the years 2002 - 2018 the average number of fires per year is 50. The highest number of reported fires - 75 took place in 2006, and the least - 31 in 2018. The data has a declining trend.
When looking into fire subcategories, the most incidents belonged to: Structure Fires (41.4%), and Outside Fires (37.3%).
Fire incident types reported to NFIRS in Zip Code 32937


 Nearest zip codes: 32935, 32925, 32903, 32901, 32934, 32904.


 . Federal Facility
 According to the data from the years 2002 - 2018 the average number of fires per year is 50. The highest number of reported fires - 75 took place in 2006, and the least - 31 in 2018. The data has a declining trend.
 When looking into fire subcategories, the most incidents belonged to: Structure Fires (41.4%), and Outside Fires (37.3%).