Estimated zip code population in 2022: 29,539 Zip code population in 2010: 25,366 Zip code population in 2000: 20,441
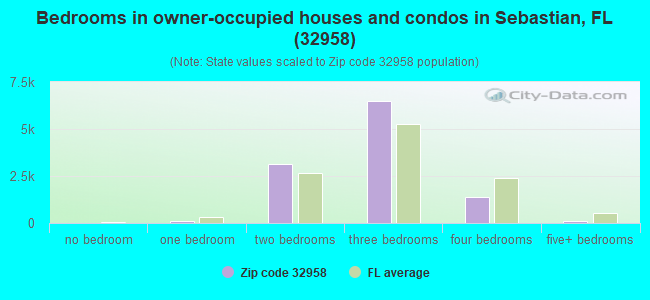
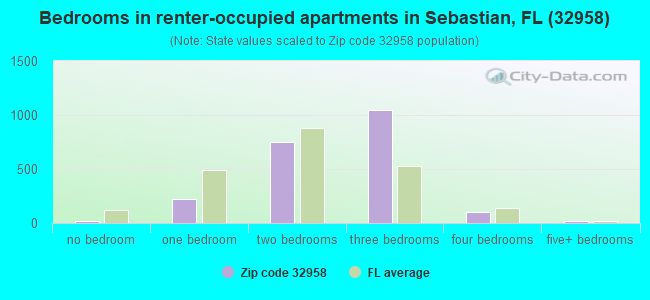
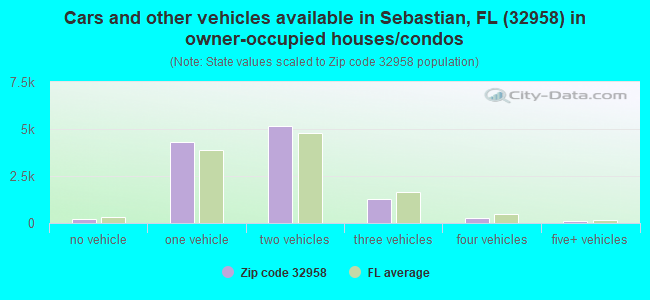
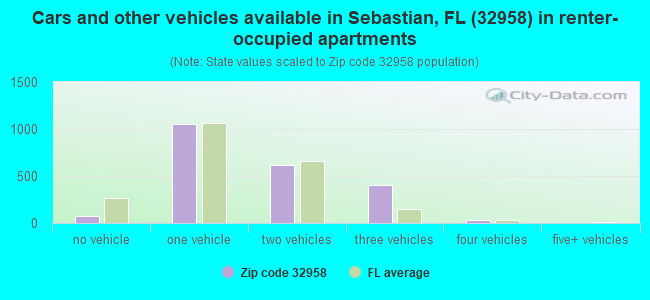
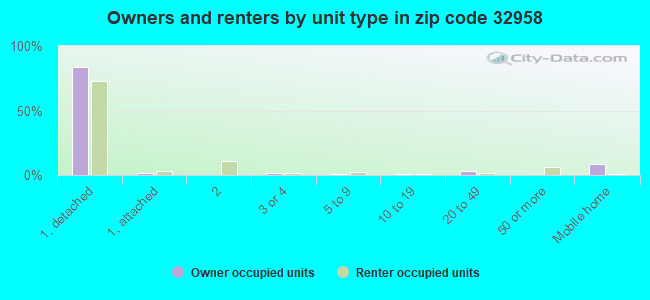
Houses and condos: 15,596 Renter-occupied apartments: 2,195
% of renters here:
16%
State:
33%
March 2022 cost of living index in zip code 32958: 90.3 (less than average, U.S. average is 100)
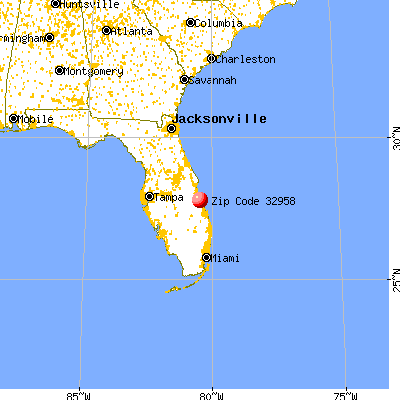
Land area: 27.8 sq. mi. Water area: 4.6 sq. mi.
Population density: 1,061 people per square mile
(low).
OSM Map
General Map
Google Map
MSN Map
OSM Map
General Map
Google Map
MSN Map
OSM Map
General Map
Google Map
MSN Map
OSM Map
General Map
Google Map
MSN Map
Please wait while loading the map...
Real estate property taxes paid for housing units in 2022:
This zip code:
0.6% ($1,877)
Florida:
0.7% ($2,529)
Median real estate property taxes paid for housing units with mortgages in 2022: $1,873 (0.6%) Median real estate property taxes paid for housing units with no mortgage in 2022: $1,878 (0.6%)
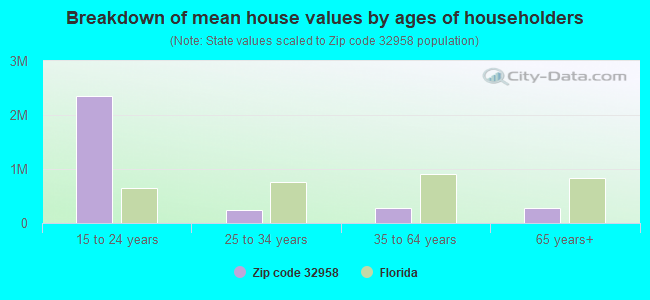
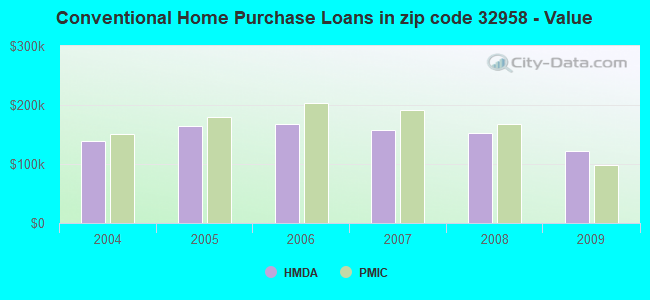
Estimated median house/condo value in 2022: $308,414
32958:
$308,414
Florida:
$354,100
According to our research of Florida and other state lists, there were 36 registered sex offenders living in 32958 zip code as of April 27, 2024. The ratio of all residents to sex offenders in zip code 32958 is 756 to 1. The ratio of registered sex offenders to all residents in this zip code is lower than the state average.
Median resident age:
This zip code:
59.4 years
Florida median age:
42.7 years
Average household size:
This zip code:
2.2 people
Florida:
2.5 people
Averages for the 2020 tax year for zip code 32958, filed in 2021:
Average Adjusted Gross Income (AGI) in 2020: $59,141 (Individual Income Tax Returns)
Here:
$59,141
State:
$82,200
Salary/wage: $46,901 (reported on 66.2% of returns)
Here:
$46,901
State:
$58,347
(% of AGI for various income ranges: 1026.8% for AGIs below $25k, 3048.6% for AGIs $25k-50k, 5222.9% for AGIs $50k-75k, 7084.9% for AGIs $75k-100k, 13404.4% for AGIs $100k-200k, 56624.0% for AGIs over 200k)
Taxable interest for individuals: $1,995 (reported on 34.6% of returns)
This zip code:
$1,995
Florida:
$4,272
(% of AGI for various income ranges: 37.7% for AGIs below $25k, 39.0% for AGIs $25k-50k, 98.6% for AGIs $50k-75k, 143.8% for AGIs $75k-100k, 259.0% for AGIs $100k-200k, 2317.0% for AGIs over 200k)
Ordinary dividends: $5,476 (reported on 24.8% of returns)
Here:
$5,476
State:
$15,863
(% of AGI for various income ranges: 59.0% for AGIs below $25k, 85.3% for AGIs $25k-50k, 161.3% for AGIs $50k-75k, 230.3% for AGIs $75k-100k, 613.7% for AGIs $100k-200k, 4814.0% for AGIs over 200k)
Net capital gain/loss in AGI: +$15,231 (reported on 22.2% of returns)
Here:
+$15,231
State:
+$62,983
(% of AGI for various income ranges: 20.2% for AGIs below $25k, 62.9% for AGIs $25k-50k, 177.6% for AGIs $50k-75k, 380.5% for AGIs $75k-100k, 983.5% for AGIs $100k-200k, 31170.0% for AGIs over 200k)
Profit/loss from business: +$10,029 (reported on 14.3% of returns)
Here:
+$10,029
State:
+$9,719
(% of AGI for various income ranges: 144.8% for AGIs below $25k, 133.1% for AGIs $25k-50k, 182.8% for AGIs $50k-75k, 206.5% for AGIs $75k-100k, 474.1% for AGIs $100k-200k, 3033.0% for AGIs over 200k)
Taxable individual retirement arrangement distribution: $18,406 (reported on 17.2% of returns)
32958:
$18,406
Florida:
$24,823
(% of AGI for various income ranges: 124.0% for AGIs below $25k, 191.8% for AGIs $25k-50k, 475.0% for AGIs $50k-75k, 797.2% for AGIs $75k-100k, 1636.2% for AGIs $100k-200k, 5770.0% for AGIs over 200k)
Self-employed (Keogh) retirement plans: $21,175 (reported on 0.3% of returns)
32958:
$21,175
Florida:
$29,694
(% of AGI for various income ranges: 84.7% for AGIs $100k-200k)
Total itemized deductions: $37,672 (reported on 4.9% of returns)
Here:
$37,672
State:
$45,393
(% of AGI for various income ranges: 47.6% for AGIs below $25k, 115.6% for AGIs $25k-50k, 244.5% for AGIs $50k-75k, 344.8% for AGIs $75k-100k, 571.6% for AGIs $100k-200k, 9562.0% for AGIs over 200k)
Charity contributions: $7,974 (reported on 3.9% of returns)
Here:
$7,974
State:
$20,178
(% of AGI for various income ranges: 3.6% for AGIs below $25k, 11.4% for AGIs $25k-50k, 33.5% for AGIs $50k-75k, 59.2% for AGIs $75k-100k, 132.9% for AGIs $100k-200k, 1699.0% for AGIs over 200k)
Taxes paid: $5,671 (reported on 4.7% of returns)
32958:
$5,671
State:
$6,967
(% of AGI for various income ranges: 8.7% for AGIs below $25k, 15.6% for AGIs $25k-50k, 41.1% for AGIs $50k-75k, 66.2% for AGIs $75k-100k, 120.2% for AGIs $100k-200k, 721.0% for AGIs over 200k)
Earned income credit: $1,929 (reported on 13.5% of returns)
Here:
$1,929
State:
$2,306
(% of AGI for various income ranges: 69.3% for AGIs below $25k, 51.7% for AGIs $25k-50k, 0.9% for AGIs $50k-75k)
Percentage of individuals using paid preparers for their 2020 taxes: 92.7%
Here:
93%
State:
92%
(% for various income ranges: 91.6% for AGIs below $25k, 94.2% for AGIs $25k-50k, 92.5% for AGIs $50k-75k, 92.1% for AGIs $75k-100k, 92.6% for AGIs $100k-200k, 94.7% for AGIs over 200k)
Averages for the 2012 tax year for zip code 32958, filed in 2013:
Average Adjusted Gross Income (AGI) in 2012: $47,408 (Individual Income Tax Returns)
Here:
$47,408
State:
$60,316
Salary/wage: $36,602 (reported on 70.5% of returns)
Here:
$36,602
State:
$45,277
(% of AGI for various income ranges: 61.2% for AGIs below $25k, 64.5% for AGIs $25k-50k, 60.2% for AGIs $50k-75k, 57.5% for AGIs $75k-100k, 56.0% for AGIs $100k-200k, 24.0% for AGIs over 200k)
Taxable interest for individuals: $2,350 (reported on 36.5% of returns)
This zip code:
$2,350
Florida:
$3,587
(% of AGI for various income ranges: 2.3% for AGIs below $25k, 1.3% for AGIs $25k-50k, 1.2% for AGIs $50k-75k, 1.4% for AGIs $75k-100k, 1.8% for AGIs $100k-200k, 3.2% for AGIs over 200k)
Ordinary dividends: $6,245 (reported on 25.2% of returns)
Here:
$6,245
State:
$12,831
(% of AGI for various income ranges: 3.1% for AGIs below $25k, 2.1% for AGIs $25k-50k, 1.9% for AGIs $50k-75k, 2.1% for AGIs $75k-100k, 3.2% for AGIs $100k-200k, 8.2% for AGIs over 200k)
Net capital gain/loss in AGI: +$7,316 (reported on 19.6% of returns)
Here:
+$7,316
State:
+$33,493
(% of AGI for various income ranges: 0.4% for AGIs $25k-50k, 0.7% for AGIs $50k-75k, 1.3% for AGIs $75k-100k, 2.9% for AGIs $100k-200k, 14.0% for AGIs over 200k)
Profit/loss from business: +$10,722 (reported on 14.2% of returns)
Here:
+$10,722
State:
+$10,012
(% of AGI for various income ranges: 7.9% for AGIs below $25k, 3.1% for AGIs $25k-50k, 2.7% for AGIs $50k-75k, 1.9% for AGIs $75k-100k, 1.4% for AGIs $100k-200k, 4.1% for AGIs over 200k)
Taxable individual retirement arrangement distribution: $13,998 (reported on 18.2% of returns)
32958:
$13,998
Florida:
$21,544
(% of AGI for various income ranges: 6.3% for AGIs below $25k, 4.5% for AGIs $25k-50k, 4.6% for AGIs $50k-75k, 5.8% for AGIs $75k-100k, 6.9% for AGIs $100k-200k, 4.4% for AGIs over 200k)
Self-employment retirement plans: $14,733 (reported on 0.3% of returns)
32958:
$14,733
Florida:
$20,611
Total itemized deductions: $19,503 (22% of AGI, reported on 22.4% of returns)
Here:
$19,503
State:
$25,533
Here:
21.7% of AGI
State:
18.0% of AGI
(% of AGI for various income ranges: 9.8% for AGIs below $25k, 8.9% for AGIs $25k-50k, 9.5% for AGIs $50k-75k, 9.3% for AGIs $75k-100k, 10.1% for AGIs $100k-200k, 7.5% for AGIs over 200k)
Charity contributions: $3,061 (reported on 17.6% of returns)
Here:
$3,061
State:
$5,698
(% of AGI for various income ranges: 0.7% for AGIs below $25k, 0.8% for AGIs $25k-50k, 1.2% for AGIs $50k-75k, 1.2% for AGIs $75k-100k, 1.4% for AGIs $100k-200k, 1.5% for AGIs over 200k)
Taxes paid: $4,198 (reported on 22.1% of returns)
32958:
$4,198
State:
$6,203
(% of AGI for various income ranges: 1.6% for AGIs below $25k, 1.5% for AGIs $25k-50k, 1.7% for AGIs $50k-75k, 2.0% for AGIs $75k-100k, 2.7% for AGIs $100k-200k, 2.1% for AGIs over 200k)
Earned income credit: $2,030 (reported on 17.7% of returns)
Here:
$2,030
State:
$2,372
(% of AGI for various income ranges: 5.1% for AGIs below $25k, 1.0% for AGIs $25k-50k)
Percentage of individuals using paid preparers for their 2012 taxes: 49.2%
Here:
49%
State:
54%
(% for various income ranges: 44.6% for AGIs below $25k, 47.9% for AGIs $25k-50k, 52.5% for AGIs $50k-75k, 54.5% for AGIs $75k-100k, 62.2% for AGIs $100k-200k, 81.2% for AGIs over 200k)
Averages for the 2004 tax year for zip code 32958, filed in 2005:
Average Adjusted Gross Income (AGI) in 2004: $39,773 (Individual Income Tax Returns)
Here:
$39,773
State:
$50,523
Salary/wage: $33,162 (reported on 73.0% of returns)
Here:
$33,162
State:
$39,563
(% of AGI for various income ranges: 128.3% for AGIs below $10k, 59.2% for AGIs $10k-25k, 65.2% for AGIs $25k-50k, 63.5% for AGIs $50k-75k, 66.7% for AGIs $75k-100k, 47.9% for AGIs over 100k)
Taxable interest for individuals: $2,048 (reported on 50.8% of returns)
This zip code:
$2,048
Florida:
$3,211
(% of AGI for various income ranges: 13.9% for AGIs below $10k, 4.7% for AGIs $10k-25k, 2.4% for AGIs $25k-50k, 2.2% for AGIs $50k-75k, 2.0% for AGIs $75k-100k, 2.0% for AGIs over 100k)
Taxable dividends: $2,530 (reported on 31.0% of returns)
Here:
$2,530
State:
$6,129
(% of AGI for various income ranges: 9.2% for AGIs below $10k, 2.9% for AGIs $10k-25k, 1.8% for AGIs $25k-50k, 1.7% for AGIs $50k-75k, 1.5% for AGIs $75k-100k, 1.9% for AGIs over 100k)
Net capital gain/loss: +$10,525 (reported on 25.6% of returns)
Here:
+$10,525
State:
+$27,205
(% of AGI for various income ranges: -2.4% for AGIs below $10k, -0.1% for AGIs $10k-25k, 1.2% for AGIs $25k-50k, 2.4% for AGIs $50k-75k, 4.2% for AGIs $75k-100k, 21.6% for AGIs over 100k)
Profit/loss from business: +$10,785 (reported on 13.6% of returns)
Here:
+$10,785
State:
+$10,634
(% of AGI for various income ranges: -0.9% for AGIs below $10k, 5.2% for AGIs $10k-25k, 3.0% for AGIs $25k-50k, 2.9% for AGIs $50k-75k, 2.5% for AGIs $75k-100k, 5.3% for AGIs over 100k)
IRA payment deduction: $3,220 (reported on 3.2% of returns)
32958:
$3,220
Florida:
$3,082
(% of AGI for various income ranges: 0.3% for AGIs $10k-25k, 0.3% for AGIs $25k-50k, 0.3% for AGIs $50k-75k, 0.2% for AGIs $75k-100k, 0.2% for AGIs over 100k)
Self-employed pension: $16,515 (reported on 0.3% of returns)
Here:
$16,515
Florida:
$15,857
Total itemized deductions: $17,275 (27% of AGI, reported on 30.5% of returns)
Here:
$17,275
State:
$20,370
Here:
27.2% of AGI
State:
20.7% of AGI
(% of AGI for various income ranges: 35.6% for AGIs below $10k, 14.0% for AGIs $10k-25k, 15.5% for AGIs $25k-50k, 12.7% for AGIs $50k-75k, 12.7% for AGIs $75k-100k, 10.4% for AGIs over 100k)
Charity contributions deductions: $2,323 (3% of AGI, reported on 25.0% of returns)
Here:
$2,323
State:
$4,064
Here:
3.5% of AGI
State:
3.8% of AGI
(% of AGI for various income ranges: 1.8% for AGIs below $10k, 1.2% for AGIs $10k-25k, 1.5% for AGIs $25k-50k, 1.5% for AGIs $50k-75k, 1.6% for AGIs $75k-100k, 1.5% for AGIs over 100k)
Total tax: $5,311 (reported on 75.2% of returns)
32958:
$5,311
State:
$9,431
(% of AGI for various income ranges: 5.0% for AGIs below $10k, 3.8% for AGIs $10k-25k, 6.4% for AGIs $25k-50k, 8.9% for AGIs $50k-75k, 10.8% for AGIs $75k-100k, 17.4% for AGIs over 100k)
Earned income credit: $1,558 (reported on 12.7% of returns)
Here:
$1,558
State:
$1,808
Percentage of individuals using paid preparers for their 2004 taxes: 57.8%
Here:
58%
State:
60%
(% for various income ranges: 51.8% for AGIs below $10k, 57.7% for AGIs $10k-25k, 57.8% for AGIs $25k-50k, 59.0% for AGIs $50k-75k, 60.1% for AGIs $75k-100k, 72.1% for AGIs over 100k)
Likely homosexual households (counted as self-reported same-sex unmarried-partner households)
Lesbian couples: 0.2% of all households
Gay men: 0.0% of all households
Household received Food Stamps/SNAP in the past 12 months: 749 Household did not receive Food Stamps/SNAP in the past 12 months: 12,782
Women who had a birth in the past 12 months: 102 (107 now married, 0 unmarried) Women who did not have a birth in the past 12 months: 3,817 (1,897 now married, 1,921 unmarried)
Housing units in zip code 32958 with a mortgage: 5,496 (325 second mortgage, 148 both second mortgage and home equity loan) Houses without a mortgage: 391
Median monthly owner costs for units with a mortgage: $1,506 Median monthly owner costs for units without a mortgage: $493
Residents with income below the poverty level in 2022:
This zip code:
8.7%
Whole state:
12.7%
Residents with income below 50% of the poverty level in 2022:
This zip code:
3.8%
Whole state:
6.6%
Median number of rooms in houses and condos:
Here:
5.6
State:
5.9
Median number of rooms in apartments:
Here:
5.0
State:
4.2
Notable locations in this zip code not listed on our city pages
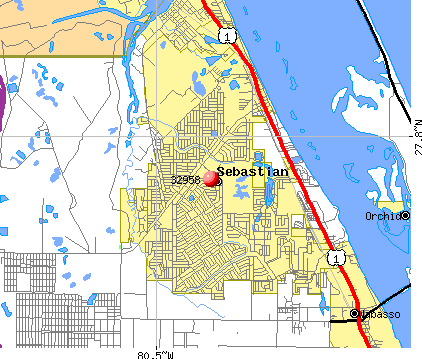
Notable locations in zip code 32958: The Golf Club of Jupiter (A), Roseland Plaza (B), Barefoot Bay Commercial Center (C), Sebastian Center (D), Donald MacDonald State Camp Ground (E), Mel Fisher's Treasure Museum (F), Sebastian Area Historical Society Museum (G), Indian River County Fire Rescue Station 8 (H), Indian River County Fire Rescue Station 9 (I), Sebastian Police Department (J). Display/hide their locations on the map
Churches in zip code 32958 include: United Church of Sebastian (A), Trinity Lutheran Church (B), Sebastian River Baptist Church (C), Sebastian Church of God (D), Sebastian Christian Church (E), Saint Sebastian Catholic Church (F), Saint Elizabeths Episcopal Church (G), Riverside Church Assembly of God (H), Kingdom Hall of Jehovahs Witnesses (I). Display/hide their locations on the map
In group quarters: 96 (-1 institutionalized population)
Size of family households: 6,115 2-persons, 1,130 3-persons, 897 4-persons, 233 5-persons, 29 6-persons, 79 7-or-more-persons
Size of nonfamily households: 4,326 1-person, 618 2-persons, 21 3-persons
2,041 married couples with children.
901 single-parent households (237 men, 664 women).
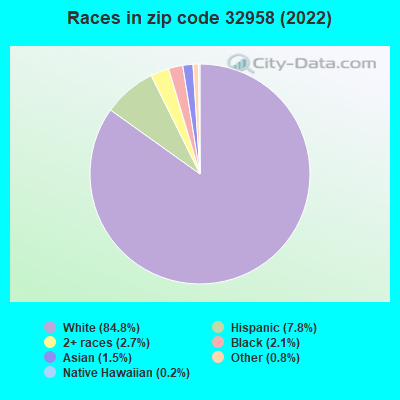
91.1% of residents of 32958 zip code speak English at home.
5.4% of residents speak Spanish at home (69% very well, 25% well, 6% not well, 1% not at all).
2.7% of residents speak other Indo-European language at home (68% very well, 29% well, 3% not well).
0.5% of residents speak Asian or Pacific Island language at home (100% very well).
0.6% of residents speak other language at home (89% very well, 11% well).
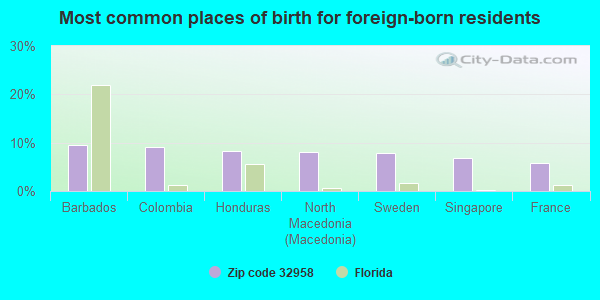
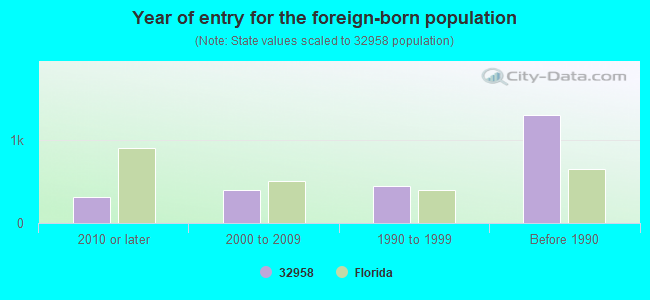
Foreign born population: 2,141 (7.3%) (73.7% of them are naturalized citizens)
This zip code:
7.3%
Whole state:
21.7%
9%Barbados
9%Colombia
8%Honduras
8%North Macedonia (Macedonia)
8%Sweden
7%Singapore
6%France
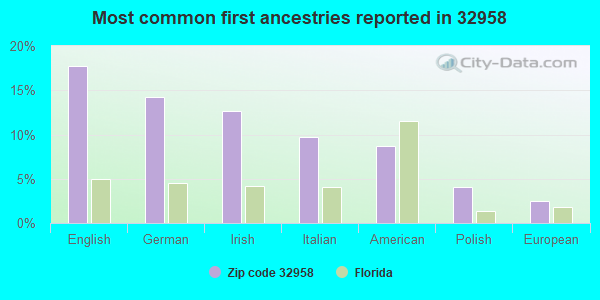
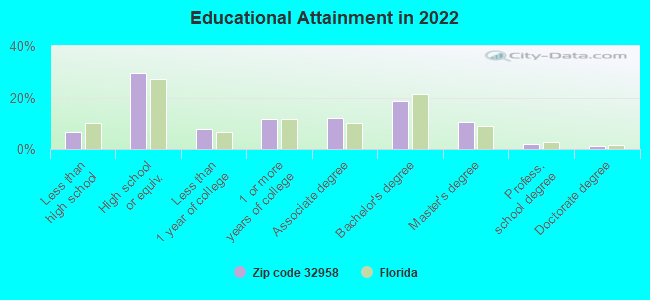
18%English
14%German
13%Irish
10%Italian
9%American
4%Polish
3%European
Year of entry for the foreign-born population
3162010 or later
3972000 to 2009
4431990 to 1999
1,296Before 1990
Major facilities with environmental interests located in this zip code:
SEBASTIAN ELEMENTARY SCHOOL (400 STATE HWY 512 in SEBASTIAN, FL)
(Geographic Names Information System) (National Center for Education Statistics) - STATE ID-0191 Organizations: INDIAN RIVER COUNTY SCHOOL DISTRICT (SCHOOL DISTRICT)
MACHO PRODUCTS INCORPORATED (10045 102ND TERR. in SEBASTIAN, FL)
AIR MAJOR (AIRS/AFS) CRITERIA AND HAZARDOUS AIR POLLUTANT INVENTORY (Inventory of air pollution sources) National Pollutant Discharge Elimination System NON-MAJOR (Tracking pollutant discharge elimination systems) - permit Small Quantity Generators, between 100 kg and 1000 kg of hazardous waste/month (Resource Conservation and Recovery Act (tracking hazardous waste)) - notification TRI REPORTER (Tracking of toxic chemicals releasing facilities) Business SIC classification: FABRICATED RUBBER PRODUCTS; PLASTICS FOAM PRODUCTS; SPORTING AND ATHLETIC GOODS Organizations: NARAYANA HATHAWAY (CONTACT/OWNER)
, CLIVE PARKER (CONTACT/OWNER)
SEBASTIAN RIVER LANDINGS (ROUTE 512 & ROUTE 510 in SEBASTIAN, FL)
National Pollutant Discharge Elimination System NON-MAJOR (Tracking pollutant discharge elimination systems) - permit National Pollutant Discharge Elimination System NON-MAJOR (Tracking pollutant discharge elimination systems) - permit Organizations: TIMOTHY JELUS (CONTACT/OWNER)
, RICHARD BROWN (CONTACT/OWNER)
PELICAN ISLAND ELEMENTARY SCHOOL (1355 SCHUMANN DR in SEBASTIAN, FL)
(Geographic Names Information System) (National Center for Education Statistics) - STATE ID-0121 Organizations: INDIAN RIVER COUNTY SCHOOL DISTRICT (SCHOOL DISTRICT)
LIBERTY MAGNET SCHOOL (FORMERLY NORTH CO (8955 85TH STREET in SEBASTIAN, FL)
(National Center for Education Statistics) - STATE ID-0301 Organizations: INDIAN RIVER COUNTY SCHOOL DISTRICT (SCHOOL DISTRICT)
SEBASTIAN RIVER SENIOR HIGH SCHOOL (9001 NINTIETH AVE in SEBASTIAN, FL)
(National Center for Education Statistics) - STATE ID-0291 Organizations: INDIAN RIVER COUNTY SCHOOL DISTRICT (SCHOOL DISTRICT)
SEBASTIAN RIVER MIDDLE SCHOOL (9400 COUNTY ROAD 512 in SEBASTIAN, FL)
(National Center for Education Statistics) - STATE ID-0171 Organizations: INDIAN RIVER COUNTY SCHOOL DISTRICT (SCHOOL DISTRICT)
SEBASTIAN JUNIOR HIGH CHARTER SCHOOL (103 TRACY DRIVE in SEBASTIAN, FL)
(National Center for Education Statistics) - STATE ID-5005 Organizations: INDIAN RIVER COUNTY SCHOOL DISTRICT (SCHOOL DISTRICT)
SEBASTIAN TRAILER PARK (HARRISON ST & INDIAN RIVER DR in SEBASTIAN, FL)
(Integrated Compliance Information System) - ICIS-04-1985-0002, FORMAL ENFORCEMENT ACTION Business SIC classification: OPERATORS OF RESIDENTIAL MOBILE HOME SITES
SEBASTIAN MUNICIPAL AIRPORT (1225 MAIN ST in SEBASTIAN, FL)
National Pollutant Discharge Elimination System NON-MAJOR (Tracking pollutant discharge elimination systems) - permit National Pollutant Discharge Elimination System NON-MAJOR (Tracking pollutant discharge elimination systems) - permit Business SIC classification: AIRPORTS, FLYING FIELDS, AND AIRPORT TERMINAL SERVICES Organizations: JOHN VAN ANTWERP (CONTACT/OWNER)
Alternative names: CITY OF SEBASTIAN, J&S AVIATION
GRAND OAKS ESTATES (13605 OLD DIXIE HWY. in SEBASTIAN, FL)
National Pollutant Discharge Elimination System NON-MAJOR (Tracking pollutant discharge elimination systems) - permit Organizations: DAN HESS (CONTACT/OWNER)
CUMBERLAND FARMS #1051 (IW) (951 FELLSMERE RD in SEBASTIAN, FL)
National Pollutant Discharge Elimination System NON-MAJOR (Tracking pollutant discharge elimination systems) - permit Small Quantity Generators, between 100 kg and 1000 kg of hazardous waste/month (Resource Conservation and Recovery Act (tracking hazardous waste)) - notification Organizations: JOYCE SCHULTZ, DEALER (CONTACT/OWNER)
SEBASTIAN CROSSINGS SUBDIVISIO (NWC 510/512 in SEBASTIAN, FL)
National Pollutant Discharge Elimination System NON-MAJOR (Tracking pollutant discharge elimination systems) - permit Organizations: MATTHEW MARKOFSKY (CONTACT/OWNER)
Housing units lacking complete plumbing facilities: 0.6% Housing units lacking complete kitchen facilities: 1.1%
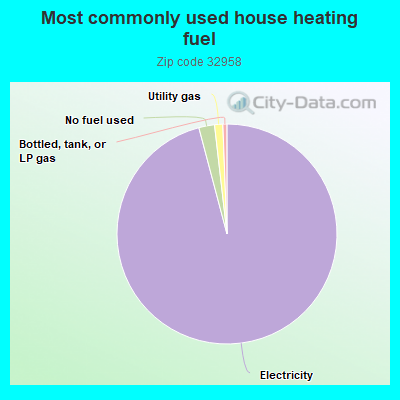
95.5%Electricity
2.3%No fuel used
1.2%Utility gas
0.6%Bottled, tank, or LP gas
Population in 1990: 14,084. Population change in the 1990s: +6,357 (+45.1%).
Place of birth for U.S.-born residents:
This state: 7,549
Northeast: 10,429
Midwest: 4,385
South: 3,544
West: 1,008
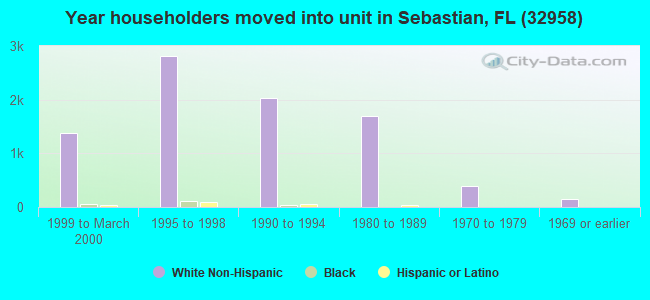
50% of the 32958 zip code residents lived in the same house 5 years ago. Out of people who lived in different houses, 36% lived in this county. Out of people who lived in different counties, 50% lived in Florida.
87% of the 32958 zip code residents lived in the same house 1 year ago. Out of people who lived in different houses, 33% moved from this county. Out of people who lived in different houses, 28% moved from different county within same state. Out of people who lived in different houses, 33% moved from different state. Out of people who lived in different houses, 9% moved from abroad.
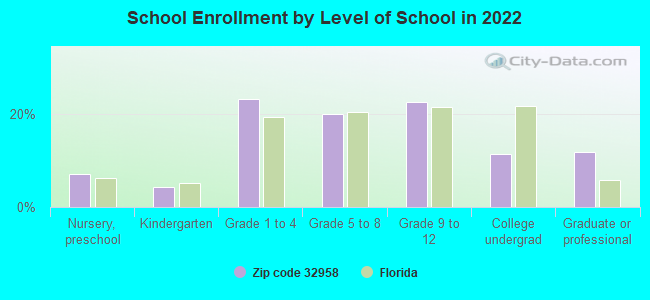
Private vs. public school enrollment:
Students in private schools in grades 1 to 8 (elementary and middle school): 304
Here:
17.3%
Florida:
15.8%
Students in private schools in grades 9 to 12 (high school): 30
Here:
3.3%
Florida:
12.9%
Students in private undergraduate colleges: 40
Here:
9.0%
Florida:
23.6%
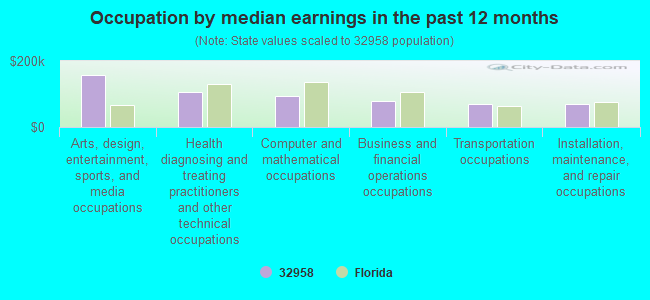
Occupation by median earnings in the past 12 months ($)
157,076Arts, design, entertainment, sports, and media occupations
107,059Health diagnosing and treating practitioners and other technical occupations
93,948Computer and mathematical occupations
78,296Business and financial operations occupations
70,984Transportation occupations
70,900Installation, maintenance, and repair occupations
Companies with federal contracts located in this zip code:
GEORGE W RUMBA (2600 KELLY DR in SEBASTIAN, FL; small business) : $3,930 in 5 contractsfrom 2002 to 2003
Contracts for Facilities Operations Support Services by U.S. Army Corps of Engineers - civil program financing only, Army Signed by year:2000: $0; 2001: $0; 2002: $1,872; 2003: $2,058; 2004: $0; 2005: $0; 2006: $0.
Biggest contracts:
$2,444 with U.S. Army Corps of Engineers - civil program financing only for Facilities Operations Support Services. Taking place in MA. Signed on 2002-05-22. Completion date: 2002-10-14.
$1,974, same as above.Signed on 2003-01-31. Completion date: 2003-07-12.
$42 with Army for Facilities Operations Support Services. Taking place in MA. Signed on 2003-10-15. Completion date: 2003-07-12.
$42 with U.S. Army Corps of Engineers - civil program financing only for Facilities Operations Support Services. Taking place in MA. Signed on 2003-10-15. Completion date: 2003-07-12.
Top industries in this zip code by the number of employees in 2005:
Health Care and Social Assistance: General Medical and Surgical Hospitals (500-999 employees: 1 establishment)
2002 - 2018 National Fire Incident Reporting System (NFIRS) incidents
Based on the data from the years 2002 - 2018 the average number of fire incidents per year is 60. The highest number of reported fires - 100 took place in 2004, and the least - 35 in 2007. The data has a declining trend.
When looking into fire subcategories, the most reports belonged to: Outside Fires (65.4%), and Structure Fires (21.3%).
Fire incident types reported to NFIRS in Zip Code 32958


 Nearest zip codes: 32970, 32976, 32967, 32963, 32949, 32951.


 Based on the data from the years 2002 - 2018 the average number of fire incidents per year is 60. The highest number of reported fires - 100 took place in 2004, and the least - 35 in 2007. The data has a declining trend.
 When looking into fire subcategories, the most reports belonged to: Outside Fires (65.4%), and Structure Fires (21.3%).