Estimated zip code population in 2022: 11,840 Zip code population in 2010: 10,673 Zip code population in 2000: 10,543
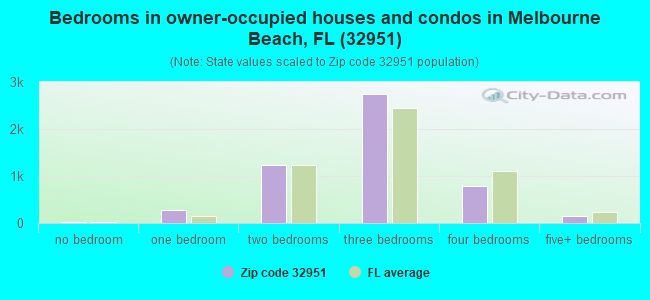
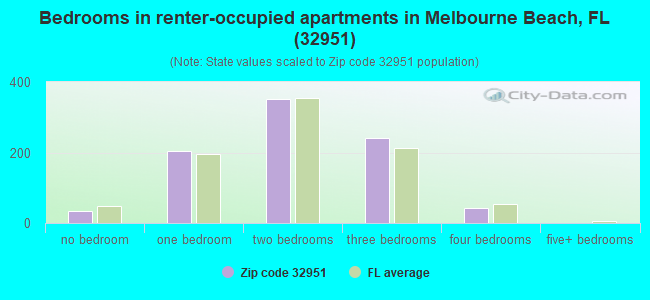
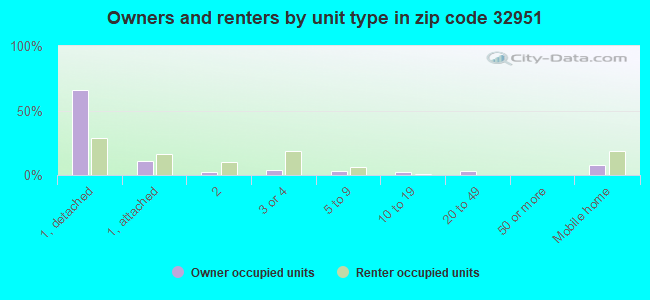
Houses and condos: 7,906 Renter-occupied apartments: 877
% of renters here:
14%
State:
33%
March 2022 cost of living index in zip code 32951: 92.6 (less than average, U.S. average is 100)
Land area: 8.1 sq. mi. Water area: 21.4 sq. mi.
Population density: 1,457 people per square mile
(low).
OSM Map
General Map
Google Map
MSN Map
OSM Map
General Map
Google Map
MSN Map
OSM Map
General Map
Google Map
MSN Map
OSM Map
General Map
Google Map
MSN Map
Please wait while loading the map...
Real estate property taxes paid for housing units in 2022:
This zip code:
0.6% ($3,435)
Florida:
0.7% ($2,529)
Median real estate property taxes paid for housing units with mortgages in 2022: $3,820 (0.7%) Median real estate property taxes paid for housing units with no mortgage in 2022: $3,247 (0.6%)
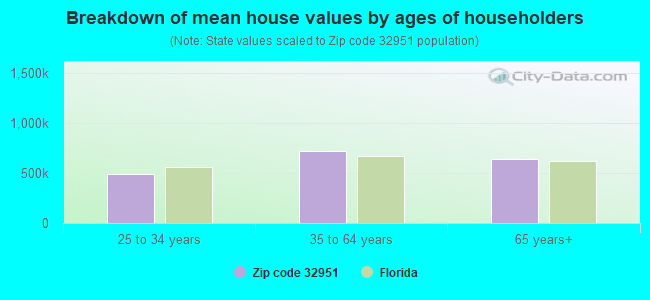
Estimated median house/condo value in 2022: $550,055
32951:
$550,055
Florida:
$354,100
According to our research of Florida and other state lists, there was 1 registered sex offender living in 32951 zip code as of April 27, 2024. The ratio of all residents to sex offenders in zip code 32951 is 11,488 to 1. The ratio of registered sex offenders to all residents in this zip code is much lower than the state average.
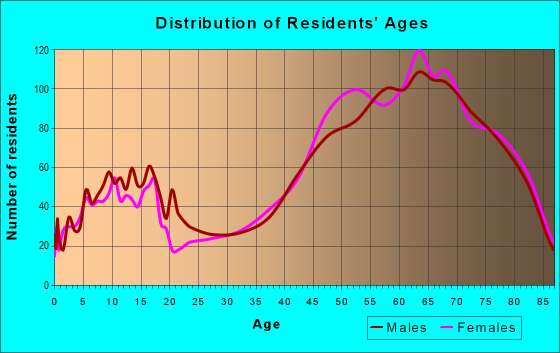
Median resident age:
This zip code:
62.4 years
Florida median age:
42.7 years
Average household size:
This zip code:
2.0 people
Florida:
2.5 people
Averages for the 2020 tax year for zip code 32951, filed in 2021:
Average Adjusted Gross Income (AGI) in 2020: $132,784 (Individual Income Tax Returns)
Here:
$132,784
State:
$82,200
Salary/wage: $103,580 (reported on 60.1% of returns)
Here:
$103,580
State:
$58,347
(% of AGI for various income ranges: 989.0% for AGIs below $25k, 2948.0% for AGIs $25k-50k, 4618.9% for AGIs $50k-75k, 6699.4% for AGIs $75k-100k, 14615.3% for AGIs $100k-200k, 79450.0% for AGIs over 200k)
Taxable interest for individuals: $4,197 (reported on 55.0% of returns)
This zip code:
$4,197
Florida:
$4,272
(% of AGI for various income ranges: 63.2% for AGIs below $25k, 145.5% for AGIs $25k-50k, 261.4% for AGIs $50k-75k, 322.6% for AGIs $75k-100k, 451.9% for AGIs $100k-200k, 2793.1% for AGIs over 200k)
Ordinary dividends: $16,391 (reported on 47.6% of returns)
Here:
$16,391
State:
$15,863
(% of AGI for various income ranges: 151.3% for AGIs below $25k, 338.4% for AGIs $25k-50k, 572.2% for AGIs $50k-75k, 719.7% for AGIs $75k-100k, 1274.4% for AGIs $100k-200k, 11410.0% for AGIs over 200k)
Net capital gain/loss in AGI: +$39,358 (reported on 44.3% of returns)
Here:
+$39,358
State:
+$62,983
(% of AGI for various income ranges: 56.1% for AGIs below $25k, 203.7% for AGIs $25k-50k, 348.4% for AGIs $50k-75k, 731.3% for AGIs $75k-100k, 1794.5% for AGIs $100k-200k, 32373.8% for AGIs over 200k)
Profit/loss from business: +$21,109 (reported on 17.5% of returns)
Here:
+$21,109
State:
+$9,719
(% of AGI for various income ranges: 151.4% for AGIs below $25k, 347.5% for AGIs $25k-50k, 492.2% for AGIs $50k-75k, 694.8% for AGIs $75k-100k, 838.4% for AGIs $100k-200k, 3501.2% for AGIs over 200k)
Taxable individual retirement arrangement distribution: $32,739 (reported on 22.6% of returns)
32951:
$32,739
Florida:
$24,823
(% of AGI for various income ranges: 162.6% for AGIs below $25k, 468.0% for AGIs $25k-50k, 892.7% for AGIs $50k-75k, 1291.6% for AGIs $75k-100k, 2443.5% for AGIs $100k-200k, 6288.8% for AGIs over 200k)
Self-employed (Keogh) retirement plans: $33,422 (reported on 1.6% of returns)
32951:
$33,422
Florida:
$29,694
(% of AGI for various income ranges: 203.9% for AGIs $75k-100k, 913.8% for AGIs over 200k)
Total itemized deductions: $38,502 (reported on 15.6% of returns)
Here:
$38,502
State:
$45,393
(% of AGI for various income ranges: 147.7% for AGIs below $25k, 286.1% for AGIs $25k-50k, 513.8% for AGIs $50k-75k, 817.4% for AGIs $75k-100k, 1457.7% for AGIs $100k-200k, 7107.3% for AGIs over 200k)
Charity contributions: $13,057 (reported on 13.0% of returns)
Here:
$13,057
State:
$20,178
(% of AGI for various income ranges: 8.2% for AGIs below $25k, 31.8% for AGIs $25k-50k, 76.8% for AGIs $50k-75k, 60.3% for AGIs $75k-100k, 305.6% for AGIs $100k-200k, 2767.7% for AGIs over 200k)
Taxes paid: $7,587 (reported on 15.5% of returns)
32951:
$7,587
State:
$6,967
(% of AGI for various income ranges: 22.9% for AGIs below $25k, 60.0% for AGIs $25k-50k, 107.3% for AGIs $50k-75k, 151.3% for AGIs $75k-100k, 317.6% for AGIs $100k-200k, 1315.0% for AGIs over 200k)
Earned income credit: $1,569 (reported on 5.6% of returns)
Here:
$1,569
State:
$2,306
(% of AGI for various income ranges: 41.2% for AGIs below $25k, 30.6% for AGIs $25k-50k)
Percentage of individuals using paid preparers for their 2020 taxes: 90.1%
Here:
90%
State:
92%
(% for various income ranges: 88.3% for AGIs below $25k, 90.5% for AGIs $25k-50k, 88.1% for AGIs $50k-75k, 91.5% for AGIs $75k-100k, 90.8% for AGIs $100k-200k, 92.2% for AGIs over 200k)
Averages for the 2012 tax year for zip code 32951, filed in 2013:
Average Adjusted Gross Income (AGI) in 2012: $89,767 (Individual Income Tax Returns)
Here:
$89,767
State:
$60,316
Salary/wage: $72,430 (reported on 61.8% of returns)
Here:
$72,430
State:
$45,277
(% of AGI for various income ranges: 57.6% for AGIs below $25k, 49.6% for AGIs $25k-50k, 43.9% for AGIs $50k-75k, 42.8% for AGIs $75k-100k, 57.8% for AGIs $100k-200k, 47.5% for AGIs over 200k)
Taxable interest for individuals: $4,867 (reported on 56.3% of returns)
This zip code:
$4,867
Florida:
$3,587
(% of AGI for various income ranges: 3.8% for AGIs below $25k, 2.9% for AGIs $25k-50k, 2.5% for AGIs $50k-75k, 2.1% for AGIs $75k-100k, 2.0% for AGIs $100k-200k, 4.1% for AGIs over 200k)
Ordinary dividends: $8,976 (reported on 45.5% of returns)
Here:
$8,976
State:
$12,831
(% of AGI for various income ranges: 7.8% for AGIs below $25k, 5.0% for AGIs $25k-50k, 4.0% for AGIs $50k-75k, 4.7% for AGIs $75k-100k, 3.8% for AGIs $100k-200k, 4.7% for AGIs over 200k)
Net capital gain/loss in AGI: +$14,906 (reported on 40.3% of returns)
Here:
+$14,906
State:
+$33,493
(% of AGI for various income ranges: 0.2% for AGIs below $25k, 1.3% for AGIs $25k-50k, 1.4% for AGIs $50k-75k, 1.6% for AGIs $75k-100k, 3.1% for AGIs $100k-200k, 13.1% for AGIs over 200k)
Profit/loss from business: +$18,969 (reported on 17.9% of returns)
Here:
+$18,969
State:
+$10,012
(% of AGI for various income ranges: 9.1% for AGIs below $25k, 4.0% for AGIs $25k-50k, 3.7% for AGIs $50k-75k, 3.0% for AGIs $75k-100k, 3.6% for AGIs $100k-200k, 3.6% for AGIs over 200k)
Taxable individual retirement arrangement distribution: $24,735 (reported on 25.2% of returns)
32951:
$24,735
Florida:
$21,544
(% of AGI for various income ranges: 9.5% for AGIs below $25k, 8.5% for AGIs $25k-50k, 7.6% for AGIs $50k-75k, 8.6% for AGIs $75k-100k, 7.4% for AGIs $100k-200k, 5.6% for AGIs over 200k)
Self-employment retirement plans: $16,983 (reported on 1.2% of returns)
32951:
$16,983
Florida:
$20,611
Total itemized deductions: $26,376 (17% of AGI, reported on 41.4% of returns)
Here:
$26,376
State:
$25,533
Here:
17.5% of AGI
State:
18.0% of AGI
(% of AGI for various income ranges: 21.8% for AGIs below $25k, 17.4% for AGIs $25k-50k, 15.7% for AGIs $50k-75k, 14.1% for AGIs $75k-100k, 12.0% for AGIs $100k-200k, 9.1% for AGIs over 200k)
Charity contributions: $3,833 (reported on 34.5% of returns)
Here:
$3,833
State:
$5,698
(% of AGI for various income ranges: 0.9% for AGIs below $25k, 1.6% for AGIs $25k-50k, 1.3% for AGIs $50k-75k, 1.5% for AGIs $75k-100k, 1.7% for AGIs $100k-200k, 1.4% for AGIs over 200k)
Taxes paid: $8,068 (reported on 40.8% of returns)
32951:
$8,068
State:
$6,203
(% of AGI for various income ranges: 4.7% for AGIs below $25k, 3.8% for AGIs $25k-50k, 4.0% for AGIs $50k-75k, 3.8% for AGIs $75k-100k, 3.7% for AGIs $100k-200k, 3.4% for AGIs over 200k)
Earned income credit: $1,467 (reported on 7.5% of returns)
Here:
$1,467
State:
$2,372
(% of AGI for various income ranges: 2.5% for AGIs below $25k, 0.3% for AGIs $25k-50k)
Percentage of individuals using paid preparers for their 2012 taxes: 55.5%
Here:
55%
State:
54%
(% for various income ranges: 46.6% for AGIs below $25k, 53.3% for AGIs $25k-50k, 61.8% for AGIs $50k-75k, 56.1% for AGIs $75k-100k, 58.9% for AGIs $100k-200k, 74.4% for AGIs over 200k)
Averages for the 2004 tax year for zip code 32951, filed in 2005:
Average Adjusted Gross Income (AGI) in 2004: $76,764 (Individual Income Tax Returns)
Here:
$76,764
State:
$50,523
Salary/wage: $58,399 (reported on 62.9% of returns)
Here:
$58,399
State:
$39,563
(% of AGI for various income ranges: 219.6% for AGIs below $10k, 48.4% for AGIs $10k-25k, 47.3% for AGIs $25k-50k, 48.9% for AGIs $50k-75k, 54.1% for AGIs $75k-100k, 45.6% for AGIs over 100k)
Taxable interest for individuals: $3,739 (reported on 69.1% of returns)
This zip code:
$3,739
Florida:
$3,211
(% of AGI for various income ranges: 42.1% for AGIs below $10k, 7.6% for AGIs $10k-25k, 4.7% for AGIs $25k-50k, 4.1% for AGIs $50k-75k, 3.0% for AGIs $75k-100k, 2.6% for AGIs over 100k)
Taxable dividends: $5,323 (reported on 51.7% of returns)
Here:
$5,323
State:
$6,129
(% of AGI for various income ranges: 41.8% for AGIs below $10k, 6.3% for AGIs $10k-25k, 4.6% for AGIs $25k-50k, 3.6% for AGIs $50k-75k, 3.5% for AGIs $75k-100k, 3.1% for AGIs over 100k)
Net capital gain/loss: +$21,641 (reported on 46.2% of returns)
Here:
+$21,641
State:
+$27,205
(% of AGI for various income ranges: -3.6% for AGIs below $10k, 0.2% for AGIs $10k-25k, 1.6% for AGIs $25k-50k, 3.2% for AGIs $50k-75k, 3.6% for AGIs $75k-100k, 19.2% for AGIs over 100k)
Profit/loss from business: +$19,553 (reported on 17.6% of returns)
Here:
+$19,553
State:
+$10,634
(% of AGI for various income ranges: 38.9% for AGIs below $10k, 8.3% for AGIs $10k-25k, 4.3% for AGIs $25k-50k, 3.8% for AGIs $50k-75k, 3.2% for AGIs $75k-100k, 4.4% for AGIs over 100k)
IRA payment deduction: $3,504 (reported on 4.6% of returns)
32951:
$3,504
Florida:
$3,082
(% of AGI for various income ranges: 1.7% for AGIs below $10k, 0.6% for AGIs $10k-25k, 0.4% for AGIs $25k-50k, 0.3% for AGIs $50k-75k, 0.3% for AGIs $75k-100k, 0.1% for AGIs over 100k)
Self-employed pension: $19,679 (reported on 1.6% of returns)
Here:
$19,679
Florida:
$15,857
(% of AGI for various income ranges: 0.6% for AGIs $10k-25k, 0.2% for AGIs $50k-75k, 0.2% for AGIs $75k-100k, 0.5% for AGIs over 100k)
Total itemized deductions: $25,738 (22% of AGI, reported on 47.9% of returns)
Here:
$25,738
State:
$20,370
Here:
22.4% of AGI
State:
20.7% of AGI
(% of AGI for various income ranges: 102.3% for AGIs below $10k, 25.6% for AGIs $10k-25k, 24.3% for AGIs $25k-50k, 21.1% for AGIs $50k-75k, 18.2% for AGIs $75k-100k, 12.4% for AGIs over 100k)
Charity contributions deductions: $3,454 (3% of AGI, reported on 41.9% of returns)
Here:
$3,454
State:
$4,064
Here:
2.9% of AGI
State:
3.8% of AGI
(% of AGI for various income ranges: 4.2% for AGIs below $10k, 1.7% for AGIs $10k-25k, 1.6% for AGIs $25k-50k, 1.9% for AGIs $50k-75k, 1.9% for AGIs $75k-100k, 1.9% for AGIs over 100k)
Total tax: $14,772 (reported on 79.8% of returns)
32951:
$14,772
State:
$9,431
(% of AGI for various income ranges: 13.6% for AGIs below $10k, 4.4% for AGIs $10k-25k, 6.9% for AGIs $25k-50k, 9.2% for AGIs $50k-75k, 10.6% for AGIs $75k-100k, 19.4% for AGIs over 100k)
Earned income credit: $1,145 (reported on 6.2% of returns)
Here:
$1,145
State:
$1,808
Percentage of individuals using paid preparers for their 2004 taxes: 61.1%
Here:
61%
State:
60%
(% for various income ranges: 54.7% for AGIs below $10k, 60.2% for AGIs $10k-25k, 61.5% for AGIs $25k-50k, 61.4% for AGIs $50k-75k, 62.1% for AGIs $75k-100k, 66.5% for AGIs over 100k)
Household received Food Stamps/SNAP in the past 12 months: 69 Household did not receive Food Stamps/SNAP in the past 12 months: 6,052
Women who had a birth in the past 12 months: 160 (150 now married, 16 unmarried) Women who did not have a birth in the past 12 months: 821 (479 now married, 342 unmarried)
Housing units in zip code 32951 with a mortgage: 1,817 (165 second mortgage, 156 both second mortgage and home equity loan) Houses without a mortgage: 56
Median monthly owner costs for units with a mortgage: $2,386 Median monthly owner costs for units without a mortgage: $752
Residents with income below the poverty level in 2022:
This zip code:
7.1%
Whole state:
12.7%
Residents with income below 50% of the poverty level in 2022:
This zip code:
3.3%
Whole state:
6.6%
Median number of rooms in houses and condos:
Here:
5.9
State:
5.9
Median number of rooms in apartments:
Here:
4.6
State:
4.2
Notable locations in this zip code not listed on our city pages
Notable locations in zip code 32951: Sebastian Inlet North Jetty Light (A), Melbourne Beach Volunteer Fire Department (B), Brevard County Fire Rescue Station 64 (C), Brevard County Fire Rescue Station 65 (D), Melbourne Beach Police Department (E). Display/hide their locations on the map
Size of family households: 2,814 2-persons, 418 3-persons, 324 4-persons, 153 5-persons, 24 6-persons
Size of nonfamily households: 2,055 1-person, 272 2-persons
1,157 married couples with children.
69 single-parent households (54 men, 15 women).
95.4% of residents of 32951 zip code speak English at home.
2.1% of residents speak Spanish at home (72% very well, 19% well, 9% not well).
2.9% of residents speak other Indo-European language at home (84% very well, 16% well).
0.1% of residents speak Asian or Pacific Island language at home (100% very well).
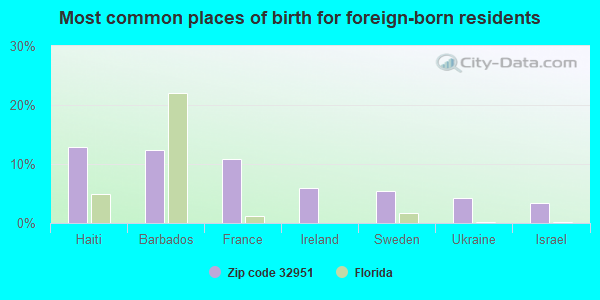
Foreign born population: 712 (6.0%) (75.4% of them are naturalized citizens)
This zip code:
6.0%
Whole state:
21.7%
13%Haiti
12%Barbados
11%France
6%Ireland
5%Sweden
4%Ukraine
3%Israel
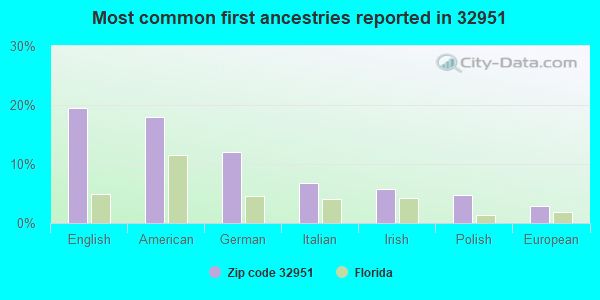
20%English
18%American
12%German
7%Italian
6%Irish
5%Polish
3%European
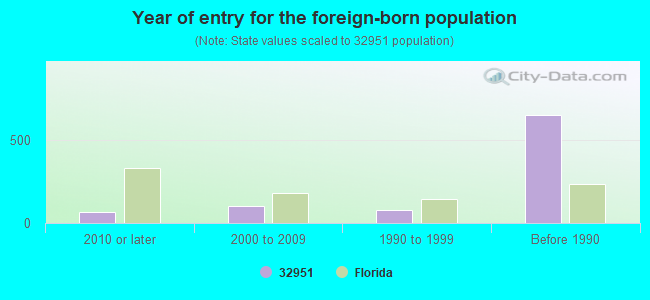
Year of entry for the foreign-born population
632010 or later
992000 to 2009
791990 to 1999
647Before 1990
Facilities with environmental interests located in this zip code:
SOUTH BEACHES REGIONAL WASTEWATER TREATMENT PLANT (2800 SOUTH A1A in MELBOURNE BEACH, FL)
STATE MASTER (FDM) - WAFR-FL0040622, DOMESTIC WASTEWATER PROGRAM, WAFR-FLR05F666, NPDES STORMWATER PROGRAM, NPDES STORMWATER PERMIT National Pollutant Discharge Elimination System NON-MAJOR (Tracking pollutant discharge elimination systems) - permit Business SIC classification: SEWERAGE SYSTEMS Organizations: BREVARD COUNTY WATER RESOURCES DEPT., BREVARD COUNTY UTIL SERV DEPARTMENT, BCUD (CONTACT/APPLICANT)
, BREVARD COUNTY WATER RESOURCES DEPARTMENT (CONTACT/APPLICANT)
, BREVARD COUNTY UTILITIES (CONTACT/APPLICANT)
, RICHARD MARTENS (CONTACT/OWNER)
, BREVARD COUNTY, WATER RESOURCES DEPARTMENT (CONTACT/OWNER)
, BCUD (CONTACT/PERMIT)
, BREVARD COUNTY WATER RESOURCES DEPARTMENT (CONTACT/PERMIT)
Alternative names: BCUD/SOUTH BEACHES
AQUARINA PARCEL A - MARITIME H (SR A1A in MELBOURNE BEACH, FL)
National Pollutant Discharge Elimination System NON-MAJOR (Tracking pollutant discharge elimination systems) - permit Organizations: MEL SCOTT (CONTACT/OWNER)
MELBOURNE BEACH CHEVRON (904 OAK ST in MELBOURNE BEACH, FL)
(Resource Conservation and Recovery Act (tracking hazardous waste)) Organizations: MATTHEW KENDAL, DEALER (CONTACT/OWNER)
OCEAN DUNES CONDOMINIUMS AT AQ (1 WARSTEINER WAY in MELBOURNE BEACH, FL)
National Pollutant Discharge Elimination System NON-MAJOR (Tracking pollutant discharge elimination systems) - permit Organizations: EDDIE THOMAS (CONTACT/OWNER)
PERINI CORP (STATE ROAD A1A in MELBOURNE BEACH, FL)
(Resource Conservation and Recovery Act (tracking hazardous waste)) Organizations: ROBERT G NEAL, MANAGER (CONTACT/OWNER)
AUCHTER IND VAC OF FL INC (751 WASHBURN RD in MELBOURNE, FL)
TRANSPORTER (Resource Conservation and Recovery Act (tracking hazardous waste)) Business NAICS classification: ALL OTHER SUPPORT ACTIVITIES FOR TRANSPORTATION. Organizations: CHARLES AUCHTER, MGR (CONTACT/OWNER)
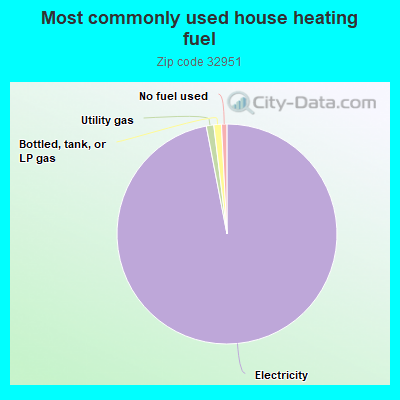
96.3%Electricity
1.1%Utility gas
1.1%Bottled, tank, or LP gas
0.8%No fuel used
Population in 1990: 8,060. Population change in the 1990s: +2,483 (+30.8%).
Place of birth for U.S.-born residents:
This state: 2,230
Northeast: 3,724
Midwest: 2,465
South: 1,845
West: 620
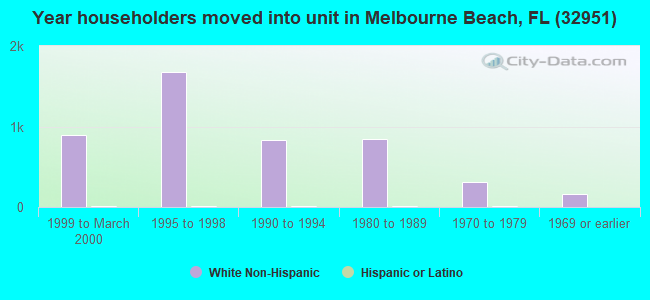
50% of the 32951 zip code residents lived in the same house 5 years ago. Out of people who lived in different houses, 39% lived in this county. Out of people who lived in different counties, 50% lived in Florida.
91% of the 32951 zip code residents lived in the same house 1 year ago. Out of people who lived in different houses, 25% moved from this county. Out of people who lived in different houses, 17% moved from different county within same state. Out of people who lived in different houses, 64% moved from different state.
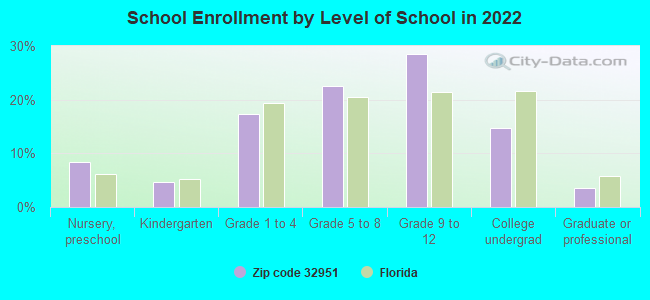
Private vs. public school enrollment:
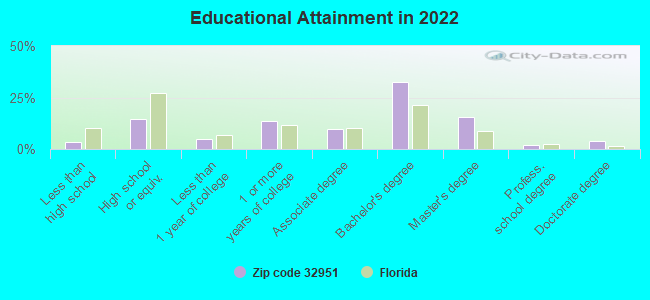
Students in private schools in grades 1 to 8 (elementary and middle school): 103
Here:
21.6%
Florida:
15.8%
Students in private schools in grades 9 to 12 (high school): 42
Here:
12.5%
Florida:
12.9%
Students in private undergraduate colleges: 26
Here:
15.4%
Florida:
23.6%
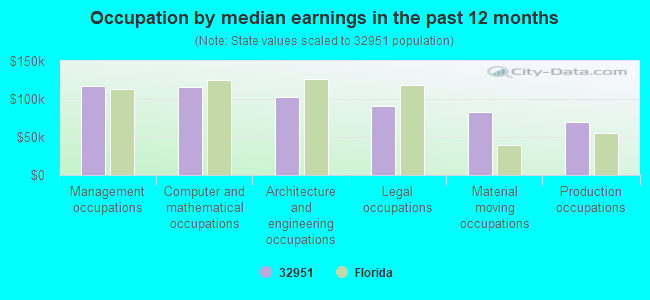
Occupation by median earnings in the past 12 months ($)
116,829Management occupations
116,199Computer and mathematical occupations
102,126Architecture and engineering occupations
90,494Legal occupations
82,838Material moving occupations
70,007Production occupations
Companies with federal contracts located in this zip code (MELBOURNE BEAC, FL):
BUNDSCHUH, CARL MD (809 ATLANTIC ST; small business) : $1,584,658 in 5 contractsfrom 2002 to 2005
Contracts for Radiology Services by Navy Signed by year:2000: $0; 2001: $0; 2002: $384,674; 2003: $400,000; 2004: $400,000; 2005: $399,984; 2006: $0.
Biggest contracts:
$400,000 with Navy for Radiology Services. Taking place in VA. Signed on 2004-10-26. Completion date: 2005-09-30.
$400,000, same as above.Signed on 2003-10-01. Completion date: 2004-09-30.
$400,000, same as above.Signed on 2002-10-01. Completion date: 2002-09-30.
$399,984, same as above.Signed on 2005-10-21. Completion date: 2005-09-30.
ENVIROSPACE SOFTWARE RESEARCH, (280 FLAMINGO DRIVE; small business) : $866,739 in 4 contractsfrom 2001 to 2003
$475,000 with Air Force for Other Defense -- Management and Support (R&D). Signed on 2002-06-04. Completion date: 2004-07-14.
$275,000, same as above.Signed on 2003-01-31. Completion date: 2004-07-14.
$67,736 with Air Force for Other Defense -- Applied Research and Exploratory Development (R&D). Signed on 2001-03-28. Completion date: 2001-12-31.
$49,003 with Army for Other Research and Development -- Management and Support (R&D). Signed on 2002-01-25. Completion date: 2002-07-31.
NOREEN WILLIAMS (6400 FLORIDANA AVE; small business) : $344,040 in 7 contractsfrom 1999 to 2005
Contracts for Other Medical Services, General Health Care Services, Vocational/Technical by Air Force Signed by year:2000: $50,760; 2001: $0; 2002: $56,400; 2003: $60,160; 2004: $60,160; 2005: $65,800; 2006: $0.
Biggest contracts:
$65,800 with Air Force for Other Medical Services. Signed on 2005-10-01. Completion date: 2006-09-30.
$60,160 with Air Force for General Health Care Services. Signed on 2004-10-01. Completion date: 2005-09-30.
$60,160 with Air Force for Vocational/Technical. Signed on 2003-10-01. Completion date: 2008-09-30.
$56,400, same as above.Signed on 2002-10-01. Completion date: 2003-09-30.
SURFBREAK ENGINEERING SCIENCES (207 SURF RD; small business) : $273,229 in 7 contractsfrom 2000 to 2006
Contracts for Other Research and Development -- Applied Research and Exploratory Development (R&D) by U.S. Army Corps of Engineers - civil program financing only, Army Signed by year:2000: $45,000; 2001: $90,000; 2002: $40,000; 2003: $0; 2004: $0; 2005: $0; 2006: $98,229.
Biggest contracts:
$60,000 with U.S. Army Corps of Engineers - civil program financing only for Other Research and Development -- Applied Research and Exploratory Development (R&D). Signed on 2001-03-02. Completion date: 2002-03-01.
$45,000 with Army for Other Research and Development -- Applied Research and Exploratory Development (R&D). Signed on 2000-04-26. Completion date: 2000-10-31.
$43,219, same as above.Signed on 2006-05-02. Completion date: 2006-12-31.
$40,135, same as above.Signed on 2006-04-26. Completion date: 2007-04-26.
Top industries in this zip code by the number of employees in 2005:
Other Services (except Public Administration): Religious Organizations (10-19: 2, 5-9: 2, 1-4: 2)
Health Care and Social Assistance: Offices of Physicians (except Mental Health Specialists) (5-9: 4, 1-4: 9)
Real Estate and Rental and Leasing: Offices of Real Estate Agents and Brokers (1-4: 20)
Other Services (except Public Administration): Other Similar Organizations (except Business, Professional, Labor, and Political Organizations) (10-19: 1, 5-9: 1, 1-4: 5)
Construction: New Single-Family Housing Construction (except Operative Builders) (5-9: 1, 1-4: 9)
Detailed PMIC statistics for the following Tracts:0661.01
, 0661.02
2002 - 2018 National Fire Incident Reporting System (NFIRS) incidents
According to the data from the years 2002 - 2018 the average number of fires per year is 16. The highest number of reported fires - 24 took place in 2002, and the least - 8 in 2008. The data has a declining trend.
When looking into fire subcategories, the most incidents belonged to: Outside Fires (49.6%), and Structure Fires (29.5%).
Fire incident types reported to NFIRS in Zip Code 32951
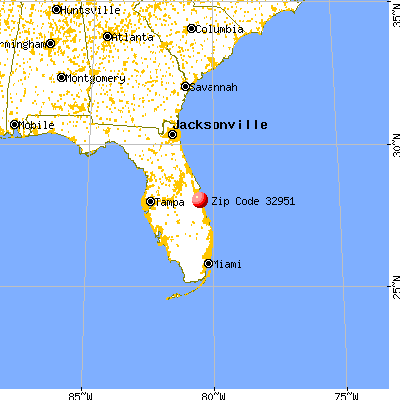


 Nearest zip codes: 32950, 32949, 32976, 32905, 32909, 32958.
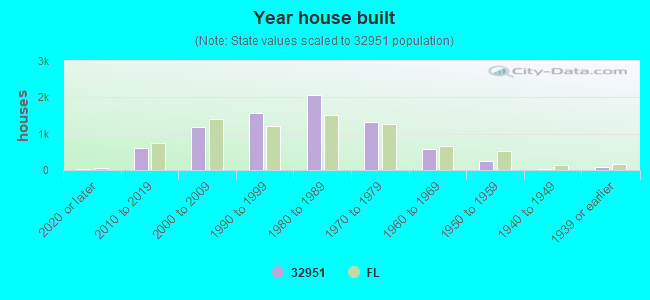


 According to the data from the years 2002 - 2018 the average number of fires per year is 16. The highest number of reported fires - 24 took place in 2002, and the least - 8 in 2008. The data has a declining trend.
 When looking into fire subcategories, the most incidents belonged to: Outside Fires (49.6%), and Structure Fires (29.5%).