Estimated zip code population in 2022: 25,392 Zip code population in 2010: 26,458 Zip code population in 2000: 23,107
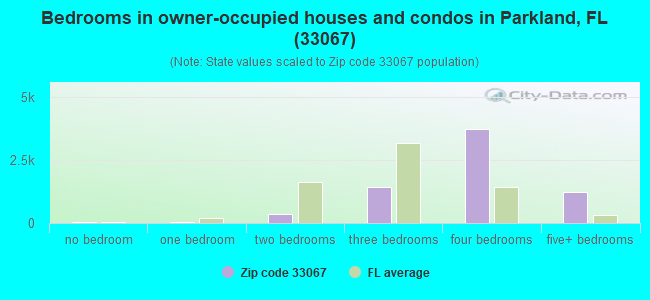
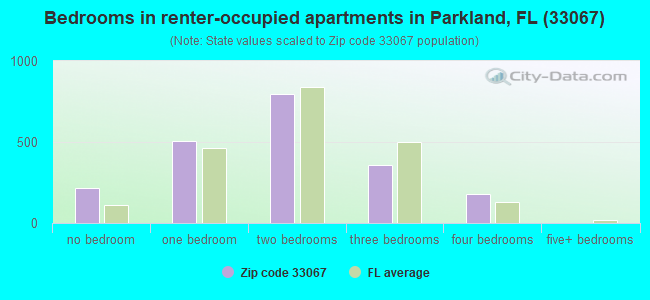
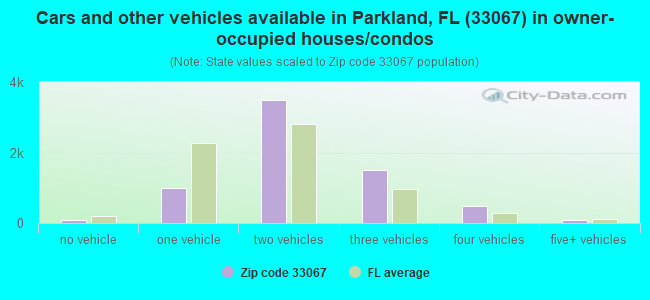
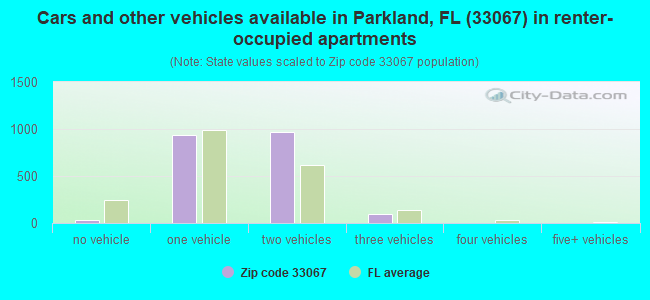
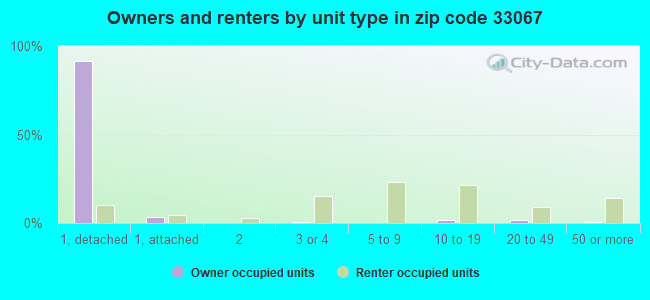
Houses and condos: 9,096 Renter-occupied apartments: 2,038
% of renters here:
23%
State:
33%
March 2022 cost of living index in zip code 33067: 110.1 (more than average, U.S. average is 100)
Land area: 10.6 sq. mi. Water area: 0.3 sq. mi.
Population density: 2,389 people per square mile
(low).
OSM Map
General Map
Google Map
MSN Map
OSM Map
General Map
Google Map
MSN Map
OSM Map
General Map
Google Map
MSN Map
OSM Map
General Map
Google Map
MSN Map
Please wait while loading the map...
Real estate property taxes paid for housing units in 2022:
This zip code:
1.0% ($6,942)
Florida:
0.7% ($2,529)
Median real estate property taxes paid for housing units with mortgages in 2022: $6,930 (1.0%) Median real estate property taxes paid for housing units with no mortgage in 2022: $6,923 (0.9%)
Estimated median house/condo value in 2022: $712,805
33067:
$712,805
Florida:
$354,100
According to our research of Florida and other state lists, there were 5 registered sex offenders living in 33067 zip code as of April 26, 2024. The ratio of all residents to sex offenders in zip code 33067 is 5,707 to 1. The ratio of registered sex offenders to all residents in this zip code is much lower than the state average.
Median resident age:
This zip code:
40.5 years
Florida median age:
42.7 years
Average household size:
This zip code:
2.9 people
Florida:
2.5 people
Averages for the 2020 tax year for zip code 33067, filed in 2021:
Average Adjusted Gross Income (AGI) in 2020: $139,396 (Individual Income Tax Returns)
Here:
$139,396
State:
$82,200
Salary/wage: $98,931 (reported on 81.4% of returns)
Here:
$98,931
State:
$58,347
(% of AGI for various income ranges: 1249.2% for AGIs below $25k, 3826.7% for AGIs $25k-50k, 7076.4% for AGIs $50k-75k, 10500.0% for AGIs $75k-100k, 19479.3% for AGIs $100k-200k, 95737.2% for AGIs over 200k)
Taxable interest for individuals: $5,553 (reported on 33.3% of returns)
This zip code:
$5,553
Florida:
$4,272
(% of AGI for various income ranges: 22.9% for AGIs below $25k, 34.5% for AGIs $25k-50k, 95.7% for AGIs $50k-75k, 134.4% for AGIs $75k-100k, 205.9% for AGIs $100k-200k, 3213.2% for AGIs over 200k)
Ordinary dividends: $11,199 (reported on 28.9% of returns)
Here:
$11,199
State:
$15,863
(% of AGI for various income ranges: 49.3% for AGIs below $25k, 72.9% for AGIs $25k-50k, 137.4% for AGIs $50k-75k, 333.7% for AGIs $75k-100k, 559.0% for AGIs $100k-200k, 5009.1% for AGIs over 200k)
Net capital gain/loss in AGI: +$32,065 (reported on 30.0% of returns)
Here:
+$32,065
State:
+$62,983
(% of AGI for various income ranges: 19.4% for AGIs below $25k, 65.5% for AGIs $25k-50k, 135.2% for AGIs $50k-75k, 371.1% for AGIs $75k-100k, 829.8% for AGIs $100k-200k, 19121.1% for AGIs over 200k)
Profit/loss from business: +$14,823 (reported on 25.1% of returns)
Here:
+$14,823
State:
+$9,719
(% of AGI for various income ranges: 262.3% for AGIs below $25k, 177.0% for AGIs $25k-50k, 297.2% for AGIs $50k-75k, 383.5% for AGIs $75k-100k, 690.1% for AGIs $100k-200k, 4204.0% for AGIs over 200k)
Taxable individual retirement arrangement distribution: $27,591 (reported on 7.7% of returns)
33067:
$27,591
Florida:
$24,823
(% of AGI for various income ranges: 53.4% for AGIs below $25k, 93.1% for AGIs $25k-50k, 149.9% for AGIs $50k-75k, 379.5% for AGIs $75k-100k, 604.9% for AGIs $100k-200k, 2179.3% for AGIs over 200k)
Self-employed (Keogh) retirement plans: $29,567 (reported on 0.7% of returns)
33067:
$29,567
Florida:
$29,694
(% of AGI for various income ranges: 41.0% for AGIs $100k-200k, 368.9% for AGIs over 200k)
Total itemized deductions: $44,061 (reported on 17.3% of returns)
Here:
$44,061
State:
$45,393
(% of AGI for various income ranges: 87.2% for AGIs below $25k, 251.5% for AGIs $25k-50k, 523.1% for AGIs $50k-75k, 1114.6% for AGIs $75k-100k, 1759.5% for AGIs $100k-200k, 9903.2% for AGIs over 200k)
Charity contributions: $12,102 (reported on 14.4% of returns)
Here:
$12,102
State:
$20,178
(% of AGI for various income ranges: 5.2% for AGIs below $25k, 26.1% for AGIs $25k-50k, 63.1% for AGIs $50k-75k, 178.6% for AGIs $75k-100k, 306.5% for AGIs $100k-200k, 2841.2% for AGIs over 200k)
Taxes paid: $8,315 (reported on 17.0% of returns)
33067:
$8,315
State:
$6,967
(% of AGI for various income ranges: 18.6% for AGIs below $25k, 54.1% for AGIs $25k-50k, 124.7% for AGIs $50k-75k, 265.4% for AGIs $75k-100k, 440.7% for AGIs $100k-200k, 1411.6% for AGIs over 200k)
Earned income credit: $2,113 (reported on 11.9% of returns)
Here:
$2,113
State:
$2,306
(% of AGI for various income ranges: 86.4% for AGIs below $25k, 66.7% for AGIs $25k-50k)
Percentage of individuals using paid preparers for their 2020 taxes: 92.4%
Here:
92%
State:
92%
(% for various income ranges: 91.2% for AGIs below $25k, 93.9% for AGIs $25k-50k, 92.4% for AGIs $50k-75k, 92.5% for AGIs $75k-100k, 92.9% for AGIs $100k-200k, 92.3% for AGIs over 200k)
Averages for the 2012 tax year for zip code 33067, filed in 2013:
Average Adjusted Gross Income (AGI) in 2012: $113,825 (Individual Income Tax Returns)
Here:
$113,825
State:
$60,316
Salary/wage: $92,682 (reported on 85.0% of returns)
Here:
$92,682
State:
$45,277
(% of AGI for various income ranges: 76.9% for AGIs below $25k, 82.7% for AGIs $25k-50k, 79.8% for AGIs $50k-75k, 78.5% for AGIs $75k-100k, 79.2% for AGIs $100k-200k, 61.4% for AGIs over 200k)
Taxable interest for individuals: $4,192 (reported on 36.5% of returns)
This zip code:
$4,192
Florida:
$3,587
(% of AGI for various income ranges: 1.7% for AGIs below $25k, 1.0% for AGIs $25k-50k, 1.0% for AGIs $50k-75k, 1.4% for AGIs $75k-100k, 0.9% for AGIs $100k-200k, 1.6% for AGIs over 200k)
Ordinary dividends: $8,275 (reported on 27.4% of returns)
Here:
$8,275
State:
$12,831
(% of AGI for various income ranges: 3.3% for AGIs below $25k, 1.8% for AGIs $25k-50k, 1.7% for AGIs $50k-75k, 1.9% for AGIs $75k-100k, 1.6% for AGIs $100k-200k, 2.1% for AGIs over 200k)
Net capital gain/loss in AGI: +$18,554 (reported on 26.3% of returns)
Here:
+$18,554
State:
+$33,493
(% of AGI for various income ranges: 0.3% for AGIs $25k-50k, 0.1% for AGIs $50k-75k, 0.5% for AGIs $75k-100k, 0.7% for AGIs $100k-200k, 7.1% for AGIs over 200k)
Profit/loss from business: +$11,272 (reported on 20.6% of returns)
Here:
+$11,272
State:
+$10,012
(% of AGI for various income ranges: 12.6% for AGIs below $25k, 4.9% for AGIs $25k-50k, 3.1% for AGIs $50k-75k, 3.0% for AGIs $75k-100k, 2.1% for AGIs $100k-200k, 0.9% for AGIs over 200k)
Taxable individual retirement arrangement distribution: $25,182 (reported on 7.9% of returns)
33067:
$25,182
Florida:
$21,544
(% of AGI for various income ranges: 2.1% for AGIs below $25k, 2.1% for AGIs $25k-50k, 2.2% for AGIs $50k-75k, 2.5% for AGIs $75k-100k, 2.6% for AGIs $100k-200k, 1.2% for AGIs over 200k)
Self-employment retirement plans: $20,900 (reported on 0.7% of returns)
33067:
$20,900
Florida:
$20,611
(% of AGI for various income ranges: 0.2% for AGIs $25k-50k, 0.1% for AGIs $100k-200k, 0.2% for AGIs over 200k)
Total itemized deductions: $32,555 (15% of AGI, reported on 42.2% of returns)
Here:
$32,555
State:
$25,533
Here:
15.3% of AGI
State:
18.0% of AGI
(% of AGI for various income ranges: 14.7% for AGIs below $25k, 14.6% for AGIs $25k-50k, 17.1% for AGIs $50k-75k, 17.2% for AGIs $75k-100k, 15.4% for AGIs $100k-200k, 9.3% for AGIs over 200k)
Charity contributions: $4,737 (reported on 36.0% of returns)
Here:
$4,737
State:
$5,698
(% of AGI for various income ranges: 0.8% for AGIs below $25k, 1.3% for AGIs $25k-50k, 1.6% for AGIs $50k-75k, 1.9% for AGIs $75k-100k, 1.8% for AGIs $100k-200k, 1.4% for AGIs over 200k)
Taxes paid: $10,172 (reported on 41.6% of returns)
33067:
$10,172
State:
$6,203
(% of AGI for various income ranges: 3.5% for AGIs below $25k, 3.4% for AGIs $25k-50k, 4.3% for AGIs $50k-75k, 4.5% for AGIs $75k-100k, 4.3% for AGIs $100k-200k, 3.4% for AGIs over 200k)
Earned income credit: $2,153 (reported on 12.8% of returns)
Here:
$2,153
State:
$2,372
(% of AGI for various income ranges: 5.8% for AGIs below $25k, 0.9% for AGIs $25k-50k)
Percentage of individuals using paid preparers for their 2012 taxes: 67.4%
Here:
67%
State:
54%
(% for various income ranges: 65.7% for AGIs below $25k, 63.5% for AGIs $25k-50k, 66.7% for AGIs $50k-75k, 67.8% for AGIs $75k-100k, 67.3% for AGIs $100k-200k, 80.7% for AGIs over 200k)
Averages for the 2004 tax year for zip code 33067, filed in 2005:
Average Adjusted Gross Income (AGI) in 2004: $102,127 (Individual Income Tax Returns)
Here:
$102,127
State:
$50,523
Salary/wage: $83,443 (reported on 85.6% of returns)
Here:
$83,443
State:
$39,563
(% of AGI for various income ranges: 77.7% for AGIs $10k-25k, 84.9% for AGIs $25k-50k, 79.6% for AGIs $50k-75k, 83.0% for AGIs $75k-100k, 64.8% for AGIs over 100k)
Taxable interest for individuals: $3,202 (reported on 53.1% of returns)
This zip code:
$3,202
Florida:
$3,211
(% of AGI for various income ranges: 3.2% for AGIs $10k-25k, 2.0% for AGIs $25k-50k, 1.6% for AGIs $50k-75k, 1.5% for AGIs $75k-100k, 1.5% for AGIs over 100k)
Taxable dividends: $3,620 (reported on 36.4% of returns)
Here:
$3,620
State:
$6,129
(% of AGI for various income ranges: 2.1% for AGIs $10k-25k, 1.2% for AGIs $25k-50k, 1.7% for AGIs $50k-75k, 1.2% for AGIs $75k-100k, 1.1% for AGIs over 100k)
Net capital gain/loss: +$14,805 (reported on 35.1% of returns)
Here:
+$14,805
State:
+$27,205
(% of AGI for various income ranges: 1.1% for AGIs $10k-25k, 0.7% for AGIs $25k-50k, 1.1% for AGIs $50k-75k, 1.3% for AGIs $75k-100k, 6.2% for AGIs over 100k)
Profit/loss from business: +$17,054 (reported on 18.2% of returns)
Here:
+$17,054
State:
+$10,634
(% of AGI for various income ranges: 10.4% for AGIs $10k-25k, 4.5% for AGIs $25k-50k, 3.9% for AGIs $50k-75k, 3.4% for AGIs $75k-100k, 2.5% for AGIs over 100k)
IRA payment deduction: $3,780 (reported on 4.7% of returns)
33067:
$3,780
Florida:
$3,082
(% of AGI for various income ranges: 0.3% for AGIs $10k-25k, 0.3% for AGIs $25k-50k, 0.4% for AGIs $50k-75k, 0.3% for AGIs $75k-100k, 0.1% for AGIs over 100k)
Self-employed pension: $16,768 (reported on 1.1% of returns)
Here:
$16,768
Florida:
$15,857
(% of AGI for various income ranges: 0.2% for AGIs $10k-25k, 0.1% for AGIs $50k-75k, 0.1% for AGIs $75k-100k, 0.2% for AGIs over 100k)
Total itemized deductions: $26,919 (17% of AGI, reported on 51.2% of returns)
Here:
$26,919
State:
$20,370
Here:
16.6% of AGI
State:
20.7% of AGI
(% of AGI for various income ranges: 18.2% for AGIs $10k-25k, 21.7% for AGIs $25k-50k, 23.9% for AGIs $50k-75k, 21.9% for AGIs $75k-100k, 10.6% for AGIs over 100k)
Charity contributions deductions: $3,893 (2% of AGI, reported on 45.7% of returns)
Here:
$3,893
State:
$4,064
Here:
2.3% of AGI
State:
3.8% of AGI
(% of AGI for various income ranges: 1.2% for AGIs $10k-25k, 1.8% for AGIs $25k-50k, 2.3% for AGIs $50k-75k, 2.5% for AGIs $75k-100k, 1.6% for AGIs over 100k)
Total tax: $25,352 (reported on 79.2% of returns)
33067:
$25,352
State:
$9,431
(% of AGI for various income ranges: 4.8% for AGIs $10k-25k, 6.8% for AGIs $25k-50k, 8.1% for AGIs $50k-75k, 9.2% for AGIs $75k-100k, 23.2% for AGIs over 100k)
Earned income credit: $1,588 (reported on 8.3% of returns)
Here:
$1,588
State:
$1,808
Percentage of individuals using paid preparers for their 2004 taxes: 67.9%
Here:
68%
State:
60%
(% for various income ranges: 66.2% for AGIs below $10k, 65.3% for AGIs $10k-25k, 63.9% for AGIs $25k-50k, 67.2% for AGIs $50k-75k, 67.5% for AGIs $75k-100k, 73.8% for AGIs over 100k)
Likely homosexual households (counted as self-reported same-sex unmarried-partner households)
Lesbian couples: 0.0% of all households
Gay men: 0.2% of all households
Household received Food Stamps/SNAP in the past 12 months: 418 Household did not receive Food Stamps/SNAP in the past 12 months: 8,318
Women who had a birth in the past 12 months: 280 (225 now married, 60 unmarried) Women who did not have a birth in the past 12 months: 5,748 (2,426 now married, 3,322 unmarried)
Housing units in zip code 33067 with a mortgage: 4,610 (682 second mortgage, 68 home equity loan, 616 both second mortgage and home equity loan) Houses without a mortgage: 175
Median monthly owner costs for units with a mortgage: $3,203 Median monthly owner costs for units without a mortgage: $1,315
Residents with income below the poverty level in 2022:
This zip code:
2.5%
Whole state:
12.7%
Residents with income below 50% of the poverty level in 2022:
This zip code:
1.6%
Whole state:
6.6%
Median number of rooms in houses and condos:
Here:
7.2
State:
5.9
Median number of rooms in apartments:
Here:
3.9
State:
4.2
Notable locations in this zip code not listed on our city pages
In group quarters: 27 (-1 institutionalized population)
Size of family households: 2,848 2-persons, 1,578 3-persons, 1,620 4-persons, 601 5-persons, 229 6-persons, 96 7-or-more-persons
Size of nonfamily households: 1,288 1-person, 405 2-persons
4,574 married couples with children.
1,277 single-parent households (496 men, 781 women).
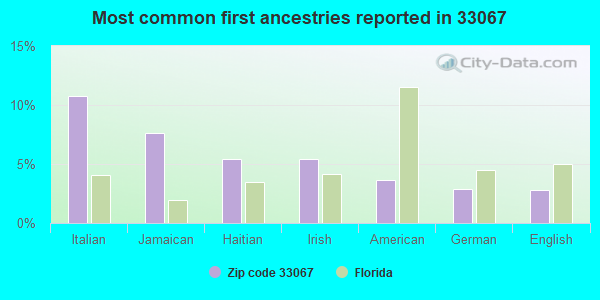
74.4% of residents of 33067 zip code speak English at home.
13.4% of residents speak Spanish at home (69% very well, 22% well, 8% not well).
7.9% of residents speak other Indo-European language at home (82% very well, 14% well, 2% not well, 2% not at all).
2.0% of residents speak Asian or Pacific Island language at home (56% very well, 31% well, 10% not well, 3% not at all).
1.8% of residents speak other language at home (88% very well, 11% well, 1% not at all).
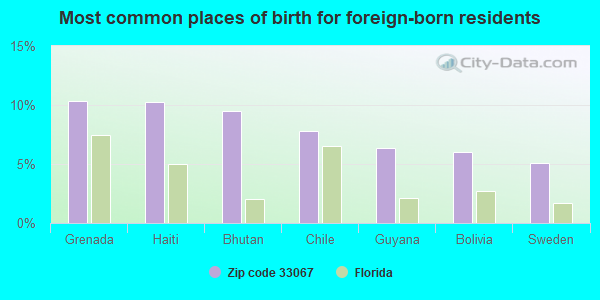
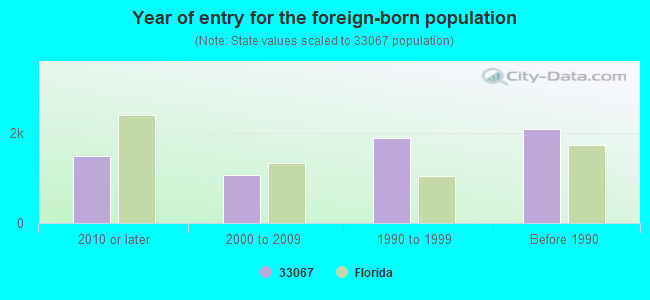
Foreign born population: 6,350 (25.0%) (78.7% of them are naturalized citizens)
Major facilities with environmental interests located in this zip code:
PAVEX CORP (2501 NW 48TH STREET in POMPANO BEACH, FL)
AIR MINOR (AIRS/AFS) (Integrated Compliance Information System) - ICIS-04-2000-0194, FORMAL ENFORCEMENT ACTION CRITERIA AND HAZARDOUS AIR POLLUTANT INVENTORY (Inventory of air pollution sources) National Pollutant Discharge Elimination System NON-MAJOR (Tracking pollutant discharge elimination systems) - permit (Resource Conservation and Recovery Act (tracking hazardous waste)) Business SIC classification: ASPHALT PAVING MIXTURES AND BLOCKS Organizations: JON CHELLGREN (CONTACT/OWNER)
, BARRY STANLEY (CONTACT/OWNER)
RBM CORPORATION (8178 WILES ROAD in CORAL SPRINGS, FL)
AIR MINOR (AIRS/AFS) (Resource Conservation and Recovery Act (tracking hazardous waste)) Business SIC classification: DRYCLEANING PLANTS, EXCEPT RUG CLEANING Organizations: NURUDDIN RAJWANY, VP (CONTACT/OWNER)
Alternative names: PINK FLAMINGO CLEANERS
PARK SPRINGS ELEMENTARY SCHOOL (5800 NW 66TH TER in CORAL SPRINGS, FL)
(National Center for Education Statistics) - STATE ID-3171 Organizations: BROWARD COUNTY SCHOOL DISTRICT (SCHOOL DISTRICT)
RIVERGLADES ELEMENTARY SCHOOL (7400 PARKSIDE DR in PARKLAND, FL)
(National Center for Education Statistics) - STATE ID-2891 Organizations: BROWARD COUNTY SCHOOL DISTRICT (SCHOOL DISTRICT)
CORAL PARK ELEMENTARY SCHOOL (8401 WESTVIEW DR in CORAL SPRINGS, FL)
(National Center for Education Statistics) - STATE ID-3041 Organizations: BROWARD COUNTY SCHOOL DISTRICT (SCHOOL DISTRICT)
HAMILTON RESIDENCE (5815 NW 79TH WAY in PARKLAND, FL)
National Pollutant Discharge Elimination System NON-MAJOR (Tracking pollutant discharge elimination systems) - permit Organizations: PAUL BREWER (CONTACT/OWNER)
HERNANDEZ RESIDENCE (6392 NW 72 WAY in PARKLAND, FL)
National Pollutant Discharge Elimination System NON-MAJOR (Tracking pollutant discharge elimination systems) - permit Organizations: PAUL BREWER (CONTACT/OWNER)
COSTELLO RESIDENCE (5812 NW 79TH WAY in PARKLAND, FL)
National Pollutant Discharge Elimination System NON-MAJOR (Tracking pollutant discharge elimination systems) - permit Organizations: PAUL BREWER (CONTACT/OWNER)
AUDI OF AMERICA-SERVICE & SALE (SWC OF SAWGRASS EXP. & SR 7 in CORAL SPRINGS, FL)
National Pollutant Discharge Elimination System NON-MAJOR (Tracking pollutant discharge elimination systems) - permit Organizations: BRIAN KITAIN (CONTACT/OWNER)
IMPERIAL AUTOMOTIVE (10802 WILES RD in CORAL SPRINGS, FL)
(Resource Conservation and Recovery Act (tracking hazardous waste)) Organizations: ANTHONY RENELLA (CONTACT/OWNER)
J CHIRICHIGNO PROPERTIES (6423 NW 63RD WAY in PARKLAND, FL)
National Pollutant Discharge Elimination System NON-MAJOR (Tracking pollutant discharge elimination systems) - permit Organizations: JERRY CHIRICHIGNO (CONTACT/OWNER)
LOU BACHRODT CHEVORLET/MAZDA (5500 SR 7 in COCONUT CREEK, FL)
National Pollutant Discharge Elimination System NON-MAJOR (Tracking pollutant discharge elimination systems) - permit
MARY HELP OF CHRISTIANS CHURCH (5980 N. UNIVERSITY DRIVE in PARKLAND, FL)
National Pollutant Discharge Elimination System NON-MAJOR (Tracking pollutant discharge elimination systems) - permit Organizations: JOHN FAVALORA (CONTACT/OWNER)
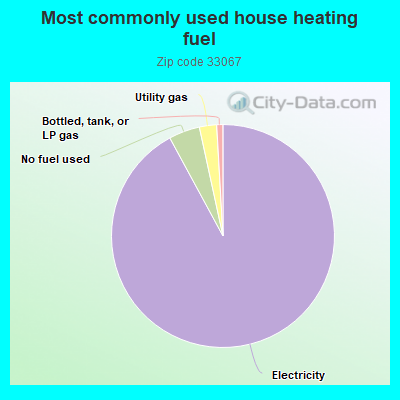
Housing units lacking complete kitchen facilities: 0.4%
92.0%Electricity
4.5%No fuel used
2.5%Utility gas
0.9%Bottled, tank, or LP gas
Population in 1990: 7,227. Population change in the 1990s: +15,880 (+219.7%).
Place of birth for U.S.-born residents:
This state: 10,078
Northeast: 5,292
Midwest: 1,472
South: 1,140
West: 619
45% of the 33067 zip code residents lived in the same house 5 years ago. Out of people who lived in different houses, 57% lived in this county. Out of people who lived in different counties, 50% lived in Florida.
89% of the 33067 zip code residents lived in the same house 1 year ago. Out of people who lived in different houses, 47% moved from this county. Out of people who lived in different houses, 28% moved from different county within same state. Out of people who lived in different houses, 20% moved from different state. Out of people who lived in different houses, 3% moved from abroad.
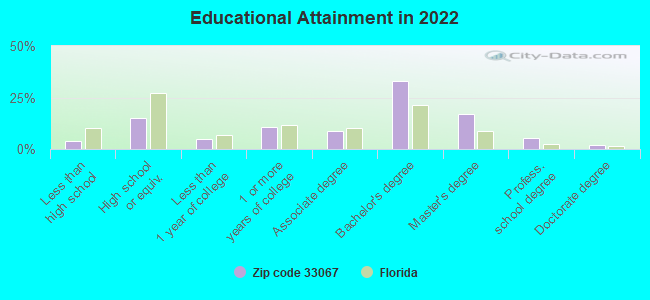
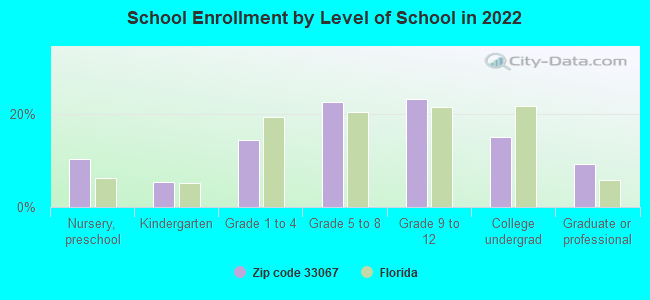
Private vs. public school enrollment:
Students in private schools in grades 1 to 8 (elementary and middle school): 663
Here:
23.3%
Florida:
15.8%
Students in private schools in grades 9 to 12 (high school): 404
Here:
22.7%
Florida:
12.9%
Students in private undergraduate colleges: 267
Here:
23.2%
Florida:
23.6%
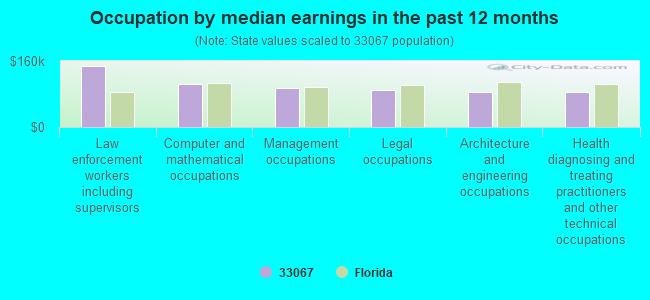
Occupation by median earnings in the past 12 months ($)
148,084Law enforcement workers including supervisors
103,909Computer and mathematical occupations
93,555Management occupations
89,359Legal occupations
85,807Architecture and engineering occupations
85,391Health diagnosing and treating practitioners and other technical occupations
Companies with federal contracts located in this zip code:
EVOLVE INC (5851 HOLMBERG RD, STE 3825 in PARKLAND, FL; small business) : $1,902,255 in 5 contractsfrom 2005 to 2006
Contracts for Training Aids by Navy Signed by year:2000: $0; 2001: $0; 2002: $0; 2003: $0; 2004: $0; 2005: $1,834,217; 2006: $68,038.
Biggest contracts:
$1,074,377 with Navy for Training Aids. Signed on 2005-06-30. Completion date: 2008-12-30.
$474,921, same as above.Signed on 2005-09-08. Completion date: 2008-12-30.
$249,965, same as above.Signed on 2005-09-01. Completion date: 2008-12-30.
$68,038, same as above.Signed on 2006-03-21. Completion date: 2008-12-30.
RELIABLE CUSTODIAL MAINTENANCE (8034 WILES RD in CORAL SPRINGS, FL; small business) 7 employees, $1500000 revenue. 8A Firm, Historically Black College or University, Educational Institution, Woman Owned Business, Minority Owned Business, Black American Owned Business: $567,906 in 68 contractsfrom 2003 to 2006
Contracts for Sets, Kits, Outfits, and Modules, Food Preparation and Serving, Household and Commercial Utility Containers, Pest Control Agents and Disinfectants, Plumbing Fixtures and Accessories, and moreby Bureau of Prisoners/Federal Prison System, Federal Supply Service, Defense Logistics Agency Signed by year:2000: $0; 2001: $0; 2002: $0; 2003: $15,606; 2004: $206,467; 2005: $241,011; 2006: $104,822.
Biggest contracts:
$26,736 with Bureau of Prisoners/Federal Prison System for Sets, Kits, Outfits, and Modules, Food Preparation and Serving. Signed on 2004-12-20. Effective on 2005-01-01. Completion date: 2005-03-31.
$26,438 with Federal Supply Service for Household and Commercial Utility Containers. Taking place in OH. Signed on 2005-09-22. Completion date: 2005-10-25.
$20,380, same as above.Signed on 2004-12-30. Completion date: 2005-02-01.
$19,543 with Defense Logistics Agency for Pest Control Agents and Disinfectants. Signed on 2005-12-19. Completion date: 2006-01-19.
DYNASTY COMPONENTS INC (5933 WEST HILLSBORO BLVD in POMPANO BEACH, FL; small business) : $216,008 in 37 contractsfrom 2005 to 2006
Contracts for Connectors, Electrical, Miscellaneous Electrical and Electronic Components, Lugs, Terminals, and Terminal Strips by Defense Logistics Agency Signed by year:2000: $0; 2001: $0; 2002: $0; 2003: $0; 2004: $0; 2005: $43,802; 2006: $172,206.
Biggest contracts:
$24,725 with Defense Logistics Agency for Connectors, Electrical. Signed on 2006-05-16. Completion date: 2006-07-15.
$12,788, same as above.Signed on 2006-02-28. Completion date: 2006-05-29.
$11,598 with Defense Logistics Agency for Miscellaneous Electrical and Electronic Components. Signed on 2006-01-23. Completion date: 2006-06-23.
$10,507 with Defense Logistics Agency for Connectors, Electrical. Signed on 2006-03-24. Completion date: 2006-05-23.
L H COMPUTER SERVICES (4630 N UNIVERSITY DR in CORAL SPRINGS, FL; small business) : $103,645 in 3 contractsfrom 2001 to 2005
$67,375 with Department of Defense for ADP Support Equipment. Signed on 2002-05-16. Completion date: 2002-06-13.
$27,398 with Defense Logistics Agency for ADP Support Equipment. Signed on 2001-07-18. Completion date: 2001-08-20.
$8,872 with Air Force for ADPE System Configuration. Signed on 2005-05-27. Completion date: 2005-06-30.
Top industries in this zip code by the number of employees in 2005:
Health Care and Social Assistance: Child Day Care Services (100-249 employees: 1 establishment, 50-99 employees: 1 establishment, 20-49 employees: 2 establishments, 10-19 employees: 1 establishment, 1-4 employees: 2 establishments)
2002 - 2018 National Fire Incident Reporting System (NFIRS) incidents
Based on the data from the years 2002 - 2018 the average number of fire incidents per year is 29. The highest number of fire incidents - 49 took place in 2008, and the least - 8 in 2015. The data has a dropping trend.
When looking into fire subcategories, the most incidents belonged to: Outside Fires (50.7%), and Structure Fires (24.8%).
Fire incident types reported to NFIRS in Zip Code 33067


 Nearest zip codes: 33073, 33065, 33428, 33076, 33063, 33071.
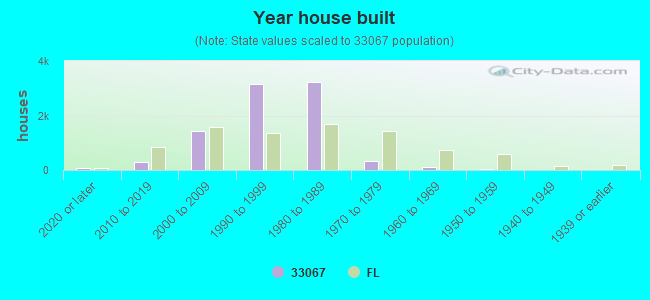


 Based on the data from the years 2002 - 2018 the average number of fire incidents per year is 29. The highest number of fire incidents - 49 took place in 2008, and the least - 8 in 2015. The data has a dropping trend.
 When looking into fire subcategories, the most incidents belonged to: Outside Fires (50.7%), and Structure Fires (24.8%).