Estimated zip code population in 2022: 56,698 Zip code population in 2010: 51,019 Zip code population in 2000: 50,993
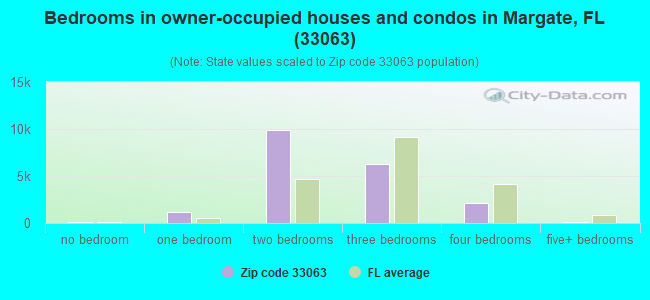
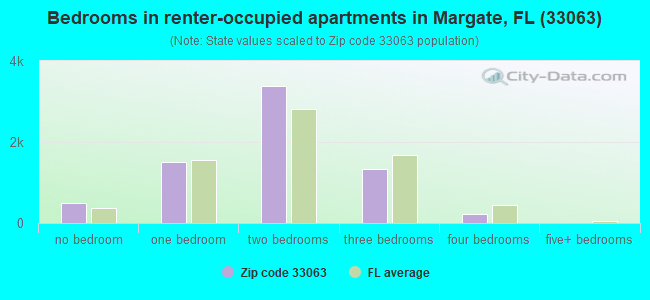
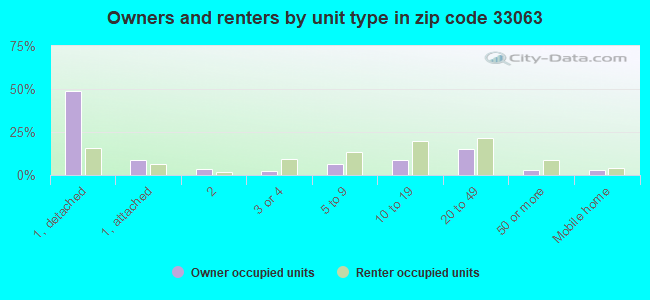
Houses and condos: 28,601 Renter-occupied apartments: 6,902
% of renters here:
26%
State:
33%
March 2022 cost of living index in zip code 33063: 108.4 (more than average, U.S. average is 100)
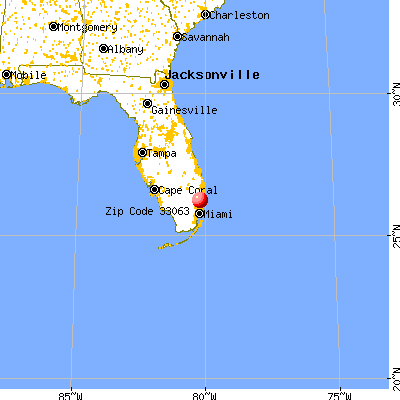
Land area: 8.9 sq. mi. Water area: 0.2 sq. mi.
Population density: 6,369 people per square mile
(high).
OSM Map
General Map
Google Map
MSN Map
OSM Map
General Map
Google Map
MSN Map
OSM Map
General Map
Google Map
MSN Map
OSM Map
General Map
Google Map
MSN Map
Please wait while loading the map...
Real estate property taxes paid for housing units in 2022:
This zip code:
0.7% ($2,154)
Florida:
0.7% ($2,529)
Median real estate property taxes paid for housing units with mortgages in 2022: $2,811 (0.8%) Median real estate property taxes paid for housing units with no mortgage in 2022: $1,194 (0.7%)
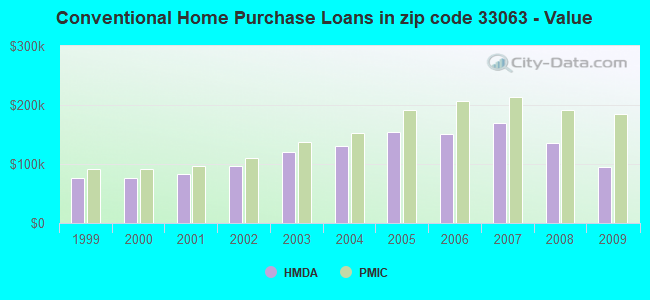
Estimated median house/condo value in 2022: $299,204
33063:
$299,204
Florida:
$354,100
According to our research of Florida and other state lists, there were 20 registered sex offenders living in 33063 zip code as of April 26, 2024. The ratio of all residents to sex offenders in zip code 33063 is 2,725 to 1. The ratio of registered sex offenders to all residents in this zip code is much lower than the state average.
Median resident age:
This zip code:
47.5 years
Florida median age:
42.7 years
Average household size:
This zip code:
2.1 people
Florida:
2.5 people
Averages for the 2020 tax year for zip code 33063, filed in 2021:
Average Adjusted Gross Income (AGI) in 2020: $45,318 (Individual Income Tax Returns)
Here:
$45,318
State:
$82,200
Salary/wage: $44,586 (reported on 79.3% of returns)
Here:
$44,586
State:
$58,347
(% of AGI for various income ranges: 1187.5% for AGIs below $25k, 3825.2% for AGIs $25k-50k, 6837.2% for AGIs $50k-75k, 10278.1% for AGIs $75k-100k, 17492.5% for AGIs $100k-200k, 55197.0% for AGIs over 200k)
Taxable interest for individuals: $1,093 (reported on 16.5% of returns)
This zip code:
$1,093
Florida:
$4,272
(% of AGI for various income ranges: 10.7% for AGIs below $25k, 11.8% for AGIs $25k-50k, 20.0% for AGIs $50k-75k, 36.5% for AGIs $75k-100k, 76.2% for AGIs $100k-200k, 1311.0% for AGIs over 200k)
Ordinary dividends: $2,920 (reported on 11.7% of returns)
Here:
$2,920
State:
$15,863
(% of AGI for various income ranges: 14.9% for AGIs below $25k, 19.5% for AGIs $25k-50k, 51.0% for AGIs $50k-75k, 90.4% for AGIs $75k-100k, 173.1% for AGIs $100k-200k, 1948.0% for AGIs over 200k)
Net capital gain/loss in AGI: +$7,381 (reported on 11.3% of returns)
Here:
+$7,381
State:
+$62,983
(% of AGI for various income ranges: 7.6% for AGIs below $25k, 10.5% for AGIs $25k-50k, 55.4% for AGIs $50k-75k, 135.8% for AGIs $75k-100k, 508.6% for AGIs $100k-200k, 12053.0% for AGIs over 200k)
Profit/loss from business: +$4,040 (reported on 28.5% of returns)
Here:
+$4,040
State:
+$9,719
(% of AGI for various income ranges: 215.4% for AGIs below $25k, 61.2% for AGIs $25k-50k, 78.9% for AGIs $50k-75k, 135.8% for AGIs $75k-100k, 247.4% for AGIs $100k-200k, 3405.0% for AGIs over 200k)
Taxable individual retirement arrangement distribution: $14,712 (reported on 5.5% of returns)
33063:
$14,712
Florida:
$24,823
(% of AGI for various income ranges: 39.6% for AGIs below $25k, 54.3% for AGIs $25k-50k, 130.5% for AGIs $50k-75k, 218.5% for AGIs $75k-100k, 380.6% for AGIs $100k-200k, 4028.0% for AGIs over 200k)
Total itemized deductions: $27,239 (reported on 7.0% of returns)
Here:
$27,239
State:
$45,393
(% of AGI for various income ranges: 34.4% for AGIs below $25k, 155.5% for AGIs $25k-50k, 411.2% for AGIs $50k-75k, 642.4% for AGIs $75k-100k, 1025.4% for AGIs $100k-200k, 4618.0% for AGIs over 200k)
Charity contributions: $6,821 (reported on 5.3% of returns)
Here:
$6,821
State:
$20,178
(% of AGI for various income ranges: 2.9% for AGIs below $25k, 22.3% for AGIs $25k-50k, 66.3% for AGIs $50k-75k, 128.0% for AGIs $75k-100k, 260.8% for AGIs $100k-200k, 1004.0% for AGIs over 200k)
Taxes paid: $5,986 (reported on 6.7% of returns)
33063:
$5,986
State:
$6,967
(% of AGI for various income ranges: 6.8% for AGIs below $25k, 34.9% for AGIs $25k-50k, 89.0% for AGIs $50k-75k, 142.9% for AGIs $75k-100k, 227.7% for AGIs $100k-200k, 599.0% for AGIs over 200k)
Earned income credit: $2,118 (reported on 22.5% of returns)
Here:
$2,118
State:
$2,306
(% of AGI for various income ranges: 112.2% for AGIs below $25k, 67.1% for AGIs $25k-50k, 0.6% for AGIs $50k-75k)
Percentage of individuals using paid preparers for their 2020 taxes: 92.2%
Here:
92%
State:
92%
(% for various income ranges: 91.1% for AGIs below $25k, 93.7% for AGIs $25k-50k, 92.5% for AGIs $50k-75k, 93.1% for AGIs $75k-100k, 92.1% for AGIs $100k-200k, 87.5% for AGIs over 200k)
Averages for the 2012 tax year for zip code 33063, filed in 2013:
Average Adjusted Gross Income (AGI) in 2012: $38,746 (Individual Income Tax Returns)
Here:
$38,746
State:
$60,316
Salary/wage: $37,818 (reported on 81.1% of returns)
Here:
$37,818
State:
$45,277
(% of AGI for various income ranges: 72.9% for AGIs below $25k, 84.8% for AGIs $25k-50k, 80.9% for AGIs $50k-75k, 81.6% for AGIs $75k-100k, 80.3% for AGIs $100k-200k, 49.5% for AGIs over 200k)
Taxable interest for individuals: $1,245 (reported on 22.4% of returns)
This zip code:
$1,245
Florida:
$3,587
(% of AGI for various income ranges: 1.2% for AGIs below $25k, 0.9% for AGIs $25k-50k, 0.5% for AGIs $50k-75k, 0.5% for AGIs $75k-100k, 0.5% for AGIs $100k-200k, 0.7% for AGIs over 200k)
Ordinary dividends: $4,130 (reported on 13.0% of returns)
Here:
$4,130
State:
$12,831
(% of AGI for various income ranges: 1.7% for AGIs below $25k, 1.6% for AGIs $25k-50k, 1.0% for AGIs $50k-75k, 1.0% for AGIs $75k-100k, 1.4% for AGIs $100k-200k, 2.5% for AGIs over 200k)
Net capital gain/loss in AGI: +$1,456 (reported on 9.8% of returns)
Here:
+$1,456
State:
+$33,493
(% of AGI for various income ranges: 0.2% for AGIs $50k-75k, 0.4% for AGIs $75k-100k, 0.5% for AGIs $100k-200k, 4.6% for AGIs over 200k)
Profit/loss from business: +$5,112 (reported on 21.0% of returns)
Here:
+$5,112
State:
+$10,012
(% of AGI for various income ranges: 11.2% for AGIs below $25k, 1.4% for AGIs $25k-50k, 1.3% for AGIs $50k-75k, 1.5% for AGIs $75k-100k, 0.9% for AGIs $100k-200k, 1.1% for AGIs over 200k)
Taxable individual retirement arrangement distribution: $11,216 (reported on 7.9% of returns)
33063:
$11,216
Florida:
$21,544
(% of AGI for various income ranges: 2.7% for AGIs below $25k, 1.8% for AGIs $25k-50k, 1.9% for AGIs $50k-75k, 2.3% for AGIs $75k-100k, 3.7% for AGIs $100k-200k)
Total itemized deductions: $17,657 (27% of AGI, reported on 24.9% of returns)
Here:
$17,657
State:
$25,533
Here:
26.9% of AGI
State:
18.0% of AGI
(% of AGI for various income ranges: 8.3% for AGIs below $25k, 12.1% for AGIs $25k-50k, 12.9% for AGIs $50k-75k, 12.3% for AGIs $75k-100k, 11.5% for AGIs $100k-200k, 7.0% for AGIs over 200k)
Charity contributions: $2,789 (reported on 20.2% of returns)
Here:
$2,789
State:
$5,698
(% of AGI for various income ranges: 0.6% for AGIs below $25k, 1.4% for AGIs $25k-50k, 1.7% for AGIs $50k-75k, 1.6% for AGIs $75k-100k, 1.8% for AGIs $100k-200k, 1.4% for AGIs over 200k)
Taxes paid: $3,240 (reported on 24.1% of returns)
33063:
$3,240
State:
$6,203
(% of AGI for various income ranges: 1.1% for AGIs below $25k, 1.9% for AGIs $25k-50k, 2.3% for AGIs $50k-75k, 2.3% for AGIs $75k-100k, 2.3% for AGIs $100k-200k, 2.0% for AGIs over 200k)
Earned income credit: $2,194 (reported on 24.2% of returns)
Here:
$2,194
State:
$2,372
(% of AGI for various income ranges: 7.4% for AGIs below $25k, 1.0% for AGIs $25k-50k)
Percentage of individuals using paid preparers for their 2012 taxes: 64.6%
Here:
65%
State:
54%
(% for various income ranges: 65.8% for AGIs below $25k, 64.2% for AGIs $25k-50k, 63.7% for AGIs $50k-75k, 61.6% for AGIs $75k-100k, 62.0% for AGIs $100k-200k, 76.9% for AGIs over 200k)
Averages for the 2004 tax year for zip code 33063, filed in 2005:
Average Adjusted Gross Income (AGI) in 2004: $36,844 (Individual Income Tax Returns)
Here:
$36,844
State:
$50,523
Salary/wage: $36,518 (reported on 81.2% of returns)
Here:
$36,518
State:
$39,563
(% of AGI for various income ranges: 80.8% for AGIs below $10k, 72.0% for AGIs $10k-25k, 84.7% for AGIs $25k-50k, 83.4% for AGIs $50k-75k, 85.7% for AGIs $75k-100k, 72.1% for AGIs over 100k)
Taxable interest for individuals: $1,758 (reported on 39.1% of returns)
This zip code:
$1,758
Florida:
$3,211
(% of AGI for various income ranges: 7.7% for AGIs below $10k, 3.8% for AGIs $10k-25k, 1.5% for AGIs $25k-50k, 1.5% for AGIs $50k-75k, 1.1% for AGIs $75k-100k, 1.5% for AGIs over 100k)
Taxable dividends: $2,317 (reported on 19.5% of returns)
Here:
$2,317
State:
$6,129
(% of AGI for various income ranges: 4.9% for AGIs below $10k, 2.2% for AGIs $10k-25k, 1.0% for AGIs $25k-50k, 0.8% for AGIs $50k-75k, 1.0% for AGIs $75k-100k, 1.2% for AGIs over 100k)
Net capital gain/loss: +$3,420 (reported on 16.4% of returns)
Here:
+$3,420
State:
+$27,205
(% of AGI for various income ranges: -4.0% for AGIs below $10k, -0.1% for AGIs $10k-25k, 0.2% for AGIs $25k-50k, 0.9% for AGIs $50k-75k, 1.6% for AGIs $75k-100k, 5.9% for AGIs over 100k)
Profit/loss from business: +$6,465 (reported on 15.9% of returns)
Here:
+$6,465
State:
+$10,634
(% of AGI for various income ranges: 14.0% for AGIs below $10k, 8.0% for AGIs $10k-25k, 2.1% for AGIs $25k-50k, 1.8% for AGIs $50k-75k, 0.9% for AGIs $75k-100k, 1.8% for AGIs over 100k)
IRA payment deduction: $2,804 (reported on 2.6% of returns)
33063:
$2,804
Florida:
$3,082
(% of AGI for various income ranges: 0.2% for AGIs below $10k, 0.2% for AGIs $10k-25k, 0.2% for AGIs $25k-50k, 0.2% for AGIs $50k-75k, 0.2% for AGIs $75k-100k, 0.1% for AGIs over 100k)
Self-employed pension: $8,882 (reported on 0.2% of returns)
Here:
$8,882
Florida:
$15,857
(% of AGI for various income ranges: 0.1% for AGIs below $10k, 0.0% for AGIs $25k-50k, 0.1% for AGIs $50k-75k, 0.2% for AGIs over 100k)
Total itemized deductions: $15,934 (28% of AGI, reported on 35.7% of returns)
Here:
$15,934
State:
$20,370
Here:
27.9% of AGI
State:
20.7% of AGI
(% of AGI for various income ranges: 17.1% for AGIs below $10k, 14.2% for AGIs $10k-25k, 16.6% for AGIs $25k-50k, 16.7% for AGIs $50k-75k, 15.9% for AGIs $75k-100k, 12.4% for AGIs over 100k)
Charity contributions deductions: $2,292 (4% of AGI, reported on 30.5% of returns)
Here:
$2,292
State:
$4,064
Here:
3.8% of AGI
State:
3.8% of AGI
(% of AGI for various income ranges: 0.8% for AGIs below $10k, 1.3% for AGIs $10k-25k, 1.9% for AGIs $25k-50k, 2.1% for AGIs $50k-75k, 2.2% for AGIs $75k-100k, 2.0% for AGIs over 100k)
Total tax: $4,479 (reported on 75.1% of returns)
33063:
$4,479
State:
$9,431
(% of AGI for various income ranges: 3.8% for AGIs below $10k, 4.2% for AGIs $10k-25k, 6.6% for AGIs $25k-50k, 9.1% for AGIs $50k-75k, 10.4% for AGIs $75k-100k, 15.9% for AGIs over 100k)
Earned income credit: $1,581 (reported on 15.8% of returns)
Here:
$1,581
State:
$1,808
Percentage of individuals using paid preparers for their 2004 taxes: 62.6%
Here:
63%
State:
60%
(% for various income ranges: 60.3% for AGIs below $10k, 66.3% for AGIs $10k-25k, 60.5% for AGIs $25k-50k, 62.8% for AGIs $50k-75k, 62.9% for AGIs $75k-100k, 62.4% for AGIs over 100k)
Likely homosexual households (counted as self-reported same-sex unmarried-partner households)
Lesbian couples: 0.0% of all households
Gay men: 0.0% of all households
Household received Food Stamps/SNAP in the past 12 months: 3,372 Household did not receive Food Stamps/SNAP in the past 12 months: 23,205
Women who had a birth in the past 12 months: 432 (236 now married, 189 unmarried) Women who did not have a birth in the past 12 months: 11,376 (4,669 now married, 6,707 unmarried)
Housing units in zip code 33063 with a mortgage: 11,644 (1,121 second mortgage, 19 home equity loan, 778 both second mortgage and home equity loan) Houses without a mortgage: 201
Median monthly owner costs for units with a mortgage: $1,789 Median monthly owner costs for units without a mortgage: $615
Residents with income below the poverty level in 2022:
This zip code:
11.8%
Whole state:
12.7%
Residents with income below 50% of the poverty level in 2022:
This zip code:
7.8%
Whole state:
6.6%
Median number of rooms in houses and condos:
Here:
5.0
State:
5.9
Median number of rooms in apartments:
Here:
4.1
State:
4.2
Notable locations in this zip code not listed on our city pages
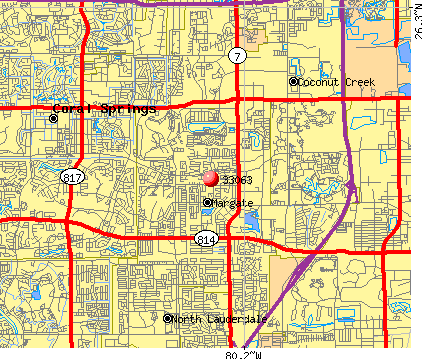
Notable locations in zip code 33063: Rost Plaza (A), Palm Lakes Plaza (B), Margate Village Square (C), Links at Polo Trace Golf Course (D), Links at 434 Golf Course (E), Leza Leisure Lakes Golf and Resort (F), Margate Plaza (G), Coconut Creek Plaza (H), Morell Plaza (I), Margate Catharine Young Branch Library (J), Margate Health Care Center (K), Margate Fire Department Station 1 (L), Coconut Creek Fire Department (M), Margate Fire Department Station 2 (N), Margate Fire Department Station 3 (O), Margate Police Department (P), Margate Police Department - Animal Control (Q), Coconut Creek Police Department (R). Display/hide their locations on the map
Shopping Centers: Palm Lake Shopping Center (1), Crossroads Shopping Center (2), Lakewood Mall (3), Lakewood Mall (4), Margate Village Square Shopping Center (5), Holiday Springs Shopping Center (6), Margate Shopping Center (7). Display/hide their locations on the map
Churches in zip code 33063 include: Saint Vincent de Paul Church (A), Faith Baptist Church of Margate (B), Fountain of Life Assembly of God (C), All Saints Lutheran Church (D), Prince of Peace Lutheran Church-ALC (E), Abundant Life Christian Centre (F), Calvary Life Tabernacle CPC (G), Calvary Presbyterian Church (H), First Christian Church of Margate (I). Display/hide their locations on the map
4,970 married couples with children.
2,585 single-parent households (628 men, 1,957 women).
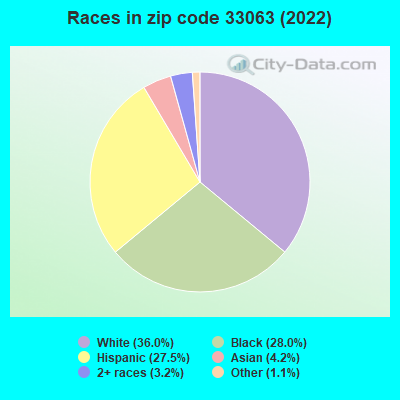
62.9% of residents of 33063 zip code speak English at home.
23.5% of residents speak Spanish at home (61% very well, 24% well, 10% not well, 5% not at all).
10.8% of residents speak other Indo-European language at home (64% very well, 17% well, 17% not well, 2% not at all).
1.9% of residents speak Asian or Pacific Island language at home (29% very well, 12% well, 40% not well, 19% not at all).
1.4% of residents speak other language at home (99% very well, 1% well).
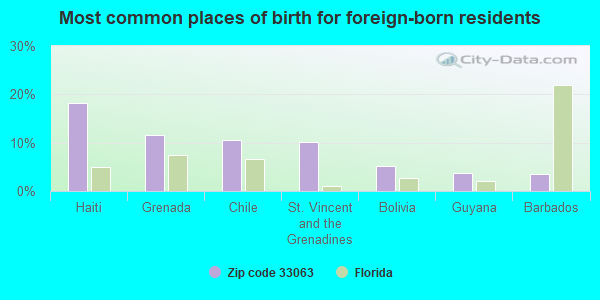
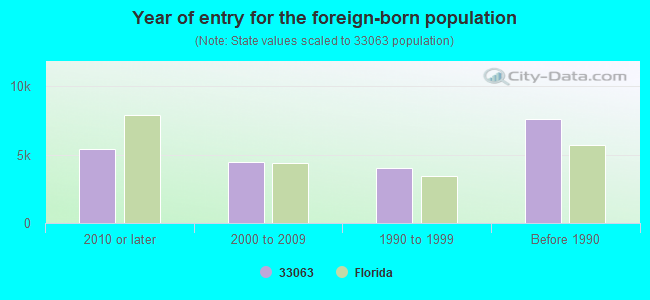
Foreign born population: 20,128 (35.5%) (67.9% of them are naturalized citizens)
Major facilities with environmental interests located in this zip code:
HOME DEPOT #6337 (6101 NW 31ST ST in MARGATE, FL)
STATE MASTER (FDM) - CHAZ-FLD984243634, HAZARDOUS WASTE REGULATION PROGRAM (Resource Conservation and Recovery Act (tracking hazardous waste)) Business SIC classification: LUMBER AND OTHER BUILDING MATERIALS DEALERS Organizations: HOME DEPOT #223, KEITH ROSENBLUM (CONTACT/OWNER)
Alternative names: HOME DEPOT #223
ATLANTIC TECHNICAL HIGH SCHOOL (4700 COCONUT CREEK PARKWAY in COCONUT CREEK, FL)
(Geographic Names Information System) (National Center for Education Statistics) - STATE ID-2221 (Resource Conservation and Recovery Act (tracking hazardous waste)) Organizations: MARK COMMISKEY, CHEM MGR (CONTACT/OWNER)
, BROWARD COUNTY SCHOOL DISTRICT (SCHOOL DISTRICT)
Alternative names: ATLANTIC TECHNICAL CENTER, BROWARD CO ATLANTIC VOCATIONAL CNTR
ATLANTIC WEST ELEMENTARY SCHOOL (301 NW 69TH TERRACE in MARGATE, FL)
(Geographic Names Information System) (National Center for Education Statistics) - STATE ID-2511 Organizations: BROWARD COUNTY SCHOOL DISTRICT (SCHOOL DISTRICT)
AMERADA HESS STATION #09216 (150 N SR #7 in MARGATE, FL)
National Pollutant Discharge Elimination System NON-MAJOR (Tracking pollutant discharge elimination systems) - permit (Resource Conservation and Recovery Act (tracking hazardous waste)) Business SIC classification: GASOLINE SERVICE STATIONS Organizations: THOMAS WHITAKER, ENV COORD (CONTACT/OWNER)
, DAVID LEE (CONTACT/OWNER)
Alternative names: HESS STATION #09216 IN MARGATE, TEMPLE CREEK DAIRY
ONE PRICE MARKETING INC (5060 COCONUT CREEK PKWY in MARGATE, FL)
AIR MINOR (AIRS/AFS) Small Quantity Generators, between 100 kg and 1000 kg of hazardous waste/month (Resource Conservation and Recovery Act (tracking hazardous waste)) - notification Business SIC classification: DRYCLEANING PLANTS, EXCEPT RUG CLEANING Organizations: DORNSTEIN MEL MGR (CONTACT/OWNER)
Alternative names: 1 PRICE DRY CLEANING
LIBERTY ELEMENTARY SCHOOL (2450 BANKS ROAD in MARGATE, FL)
(National Center for Education Statistics) - STATE ID-3821 Organizations: BROWARD COUNTY SCHOOL DISTRICT (SCHOOL DISTRICT)
ARCA INVESTMENTS INC (1045 N SR 7 in MARGATE, FL)
AIR MINOR (AIRS/AFS) (Resource Conservation and Recovery Act (tracking hazardous waste)) Business SIC classification: DRYCLEANING PLANTS, EXCEPT RUG CLEANING Organizations: ARTURO CARDONA, PRESIDENT (CONTACT/OWNER)
Alternative names: CARGO INVESTMENTS INCORPORATED, SCOTCH CLEANERS
MATTHEWS D L POOLS INC (262 N SR 7 in MARGATE, FL)
(Integrated Compliance Information System) - ICIS-04-1988-0107, FORMAL ENFORCEMENT ACTION Business SIC classification: MISCELLANEOUS RETAIL STORES; BUSINESS SERVICES
PRIME CLEANERS INC (7252 WEST ATLANTIC BLVD in MARGATE, FL)
AIR MINOR (AIRS/AFS) (Resource Conservation and Recovery Act (tracking hazardous waste)) Business SIC classification: DRYCLEANING PLANTS, EXCEPT RUG CLEANING
SAWGRASS AUTOBODY (4900 NORTHWEST 15TH STREET in MARGATE, FL)
COMPLIANCE ACTIVITY (Tracking inspections of insecticide, fungicide, and rodenticide, and toxic substances) Small Quantity Generators, between 100 kg and 1000 kg of hazardous waste/month (Resource Conservation and Recovery Act (tracking hazardous waste)) - notification Organizations: JOHNSCHUR JEFF OWNER (CONTACT/OWNER)
Alternative names: ASTRO-PURE, INC.
RJR INC (5731 MARGATE BLVD in MARGATE, FL)
AIR MINOR (AIRS/AFS) (Resource Conservation and Recovery Act (tracking hazardous waste)) Business SIC classification: DRYCLEANING PLANTS, EXCEPT RUG CLEANING Organizations: FRANK CAMPAGNA, PRES (CONTACT/OWNER)
Alternative names: 1 HOUR CLEANERS OF MARGATE
DEE LUX (2402 N SR 7 in MARGATE, FL)
Small Quantity Generators, between 100 kg and 1000 kg of hazardous waste/month (Resource Conservation and Recovery Act (tracking hazardous waste)) - notification (Resource Conservation and Recovery Act (tracking hazardous waste)) Organizations: RMC REALTY TOWN SHOPPES OF MARGATE (CONTACT/OWNER)
, RICK KELM, PRES (CONTACT/OWNER)
Alternative names: DELUX ONE HOUR LOTUS FINE DRY CLEANER
HASSETT AUTO SERVICE, INC. (5415 NW 15TH STREET in MARGATE, FL)
AIR MINOR (AIRS/AFS) Business SIC classification: NONCLASSIFIABLE ESTABLISHMENTS Alternative names: BW AUTO CENTER
Housing units lacking complete plumbing facilities: 0.3% Housing units lacking complete kitchen facilities: 0.6%
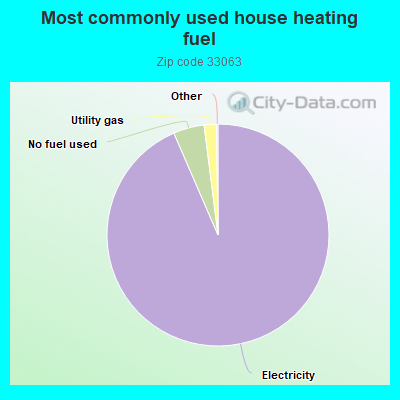
93.5%Electricity
4.5%No fuel used
1.8%Utility gas
Population in 1990: 37,607. Population change in the 1990s: +13,386 (+35.6%).
Place of birth for U.S.-born residents:
This state: 16,175
Northeast: 12,965
Midwest: 2,548
South: 2,289
West: 817
51% of the 33063 zip code residents lived in the same house 5 years ago. Out of people who lived in different houses, 64% lived in this county. Out of people who lived in different counties, 50% lived in Florida.
90% of the 33063 zip code residents lived in the same house 1 year ago. Out of people who lived in different houses, 64% moved from this county. Out of people who lived in different houses, 12% moved from different county within same state. Out of people who lived in different houses, 13% moved from different state. Out of people who lived in different houses, 6% moved from abroad.
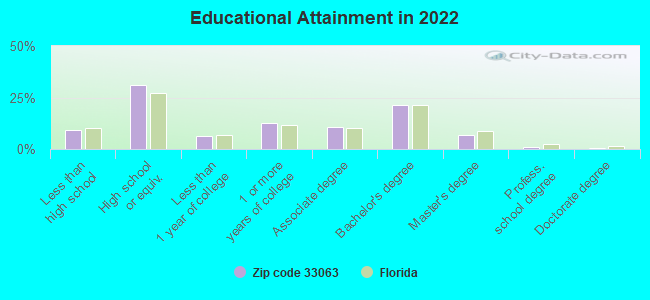
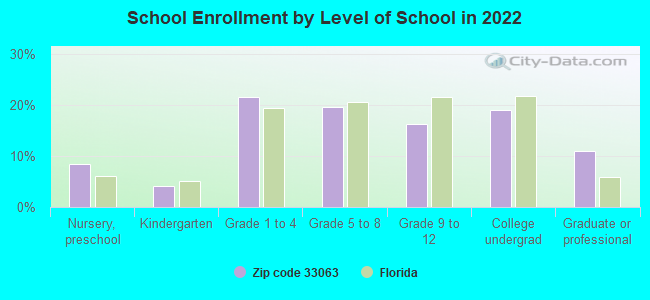
Private vs. public school enrollment:
Students in private schools in grades 1 to 8 (elementary and middle school): 1,146
Here:
26.4%
Florida:
15.8%
Students in private schools in grades 9 to 12 (high school): 304
Here:
17.9%
Florida:
12.9%
Students in private undergraduate colleges: 189
Here:
9.7%
Florida:
23.6%
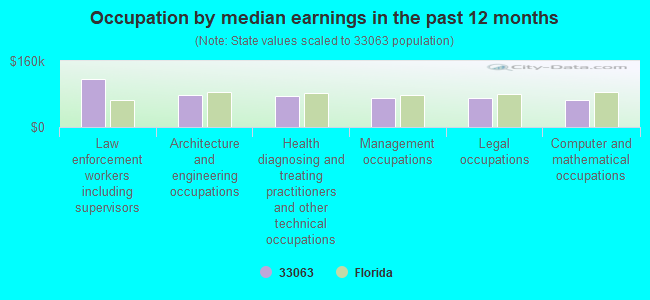
Occupation by median earnings in the past 12 months ($)
116,613Law enforcement workers including supervisors
77,361Architecture and engineering occupations
74,262Health diagnosing and treating practitioners and other technical occupations
71,073Management occupations
69,981Legal occupations
66,172Computer and mathematical occupations
Companies with federal contracts located in this zip code:
TGC ENTERPRISES, INC (1479 BANKS ROAD in MARGATE, FL; small business) : $3,314,550 in 225 contractsfrom 1999 to 2006
Contracts for Plate, Sheet, Strip, Foil; and Leaf, Airframe Structural Components, Plate, Sheet, Strip, and Foil; Nonferrous Base Metal, Bars and Rods, and moreby Army, Defense Logistics Agency, Air Force, Navy, and others Signed by year:2000: $59,088; 2001: $171,528; 2002: $106,395; 2003: $578,823; 2004: $1,282,100; 2005: $737,060; 2006: $351,596.
Biggest contracts:
$469,580 with Army for Plate, Sheet, Strip, Foil; and Leaf. Taking place in OR. Signed on 2003-11-14. Completion date: 2003-12-20.
$156,316 with Defense Logistics Agency for Airframe Structural Components. Taking place in KS. Signed on 2004-12-16. Completion date: 2005-06-16.
$128,940, same as above.Signed on 2004-01-29. Completion date: 2004-05-28.
$109,674 with Army for Plate, Sheet, Strip, and Foil; Nonferrous Base Metal. Signed on 2004-11-16. Completion date: 2004-11-19.
C P I ENTERPRISES, INC (5415 N W 15TH STREET, BAY in MARGATE, FL; small business) : $156,342 in 6 contractsfrom 2001 to 2004
Contracts for Aircraft Landing Equipment, Bearings, Plain, Unmounted, Gas Turbines and Jet Engines, Aircraft; Prime Moving, and Components by Navy, Defense Logistics Agency Signed by year:2000: $0; 2001: $89,717; 2002: $0; 2003: $86,559; 2004: -$19,934; 2005: $0; 2006: $0.
Biggest contracts:
$86,559 with Navy for Aircraft Landing Equipment. Signed on 2003-03-14. Completion date: 2003-09-10.
$55,125, same as above.Signed on 2004-01-09. Completion date: 2004-10-15.
$47,717 with Defense Logistics Agency for Bearings, Plain, Unmounted. Signed on 2001-07-13. Completion date: 2001-09-01.
$42,000 with Defense Logistics Agency for Gas Turbines and Jet Engines, Aircraft; Prime Moving, and Components. Signed on 2001-01-22. Completion date: 2001-05-22.
MINOTECH TECHNOLOGIES, INC (6303 NAVAJO TERR in MARGATE, FL; small business)
$60,590 with Defense Logistics Agency for Connectors, Electrical. Signed on 2003-10-21. Completion date: 2003-12-25.
APPLIED MANUFACTURING SYSTEMS (3037 WOODLANDS DRIVE in POMPANO BEACH, FL; small business)
$36,005 with Air Force for Grinding Machines. Taking place in NE. Signed on 2002-09-04. Completion date: 2002-09-25.
STRIDER AVIATION, INC (5445 N W 24TH STREET in MARGATE, FL; small business) 50 employees, $0 revenue
$108 with Navy for Hardware, Commercial. Signed on 2004-12-16. Completion date: 2004-12-23.
Top industries in this zip code by the number of employees in 2005:
Management of Companies and Enterprises: Corporate, Subsidiary, and Regional Managing Offices (500-999 employees: 1 establishment, 50-99 employees: 1 establishment, 20-49 employees: 1 establishment)
Health Care and Social Assistance: Child Day Care Services (250-499: 1, 100-249: 1, 20-49: 3, 10-19: 8, 5-9: 2, 1-4: 6)
Health Care and Social Assistance: General Medical and Surgical Hospitals (500-999: 1)
Administrative and Support and Waste Management and Remediation Services: Telephone Answering Services (500-999: 1)
Health Care and Social Assistance: Offices of Physicians (except Mental Health Specialists) (50-99: 1, 20-49: 4, 10-19: 6, 5-9: 20, 1-4: 37)
2002 - 2018 National Fire Incident Reporting System (NFIRS) incidents
Based on the data from the years 2002 - 2018 the average number of fire incidents per year is 105. The highest number of fire incidents - 166 took place in 2005, and the least - 62 in 2002. The data has a growing trend.
When looking into fire subcategories, the most incidents belonged to: Structure Fires (42.0%), and Outside Fires (33.5%).
Fire incident types reported to NFIRS in Zip Code 33063


 Nearest zip codes: 33068, 33066, 33073, 33069, 33065, 33067.


 Based on the data from the years 2002 - 2018 the average number of fire incidents per year is 105. The highest number of fire incidents - 166 took place in 2005, and the least - 62 in 2002. The data has a growing trend.
 When looking into fire subcategories, the most incidents belonged to: Structure Fires (42.0%), and Outside Fires (33.5%).