Estimated zip code population in 2022: 54,281 Zip code population in 2010: 49,824 Zip code population in 2000: 47,696
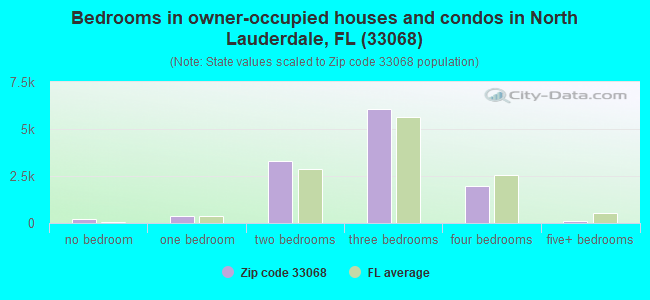
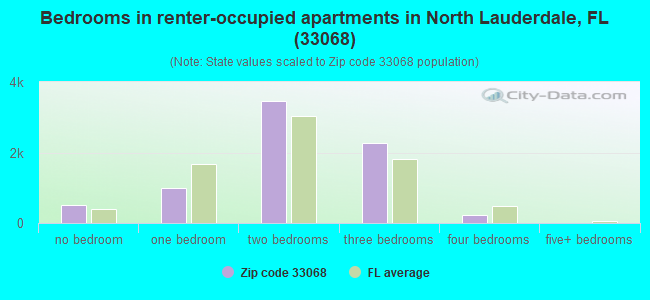
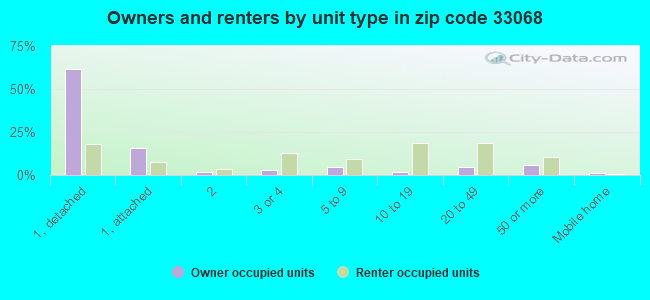
Houses and condos: 20,451 Renter-occupied apartments: 7,491
% of renters here:
38%
State:
33%
March 2022 cost of living index in zip code 33068: 108.6 (more than average, U.S. average is 100)
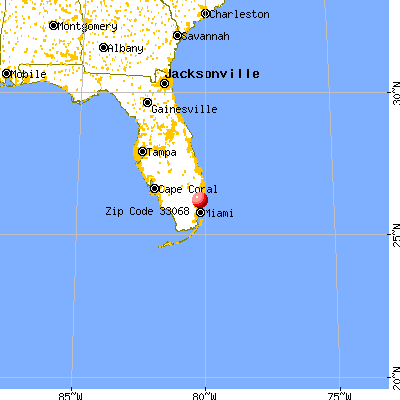
Land area: 6.0 sq. mi. Water area: 0.0 sq. mi.
Population density: 9,109 people per square mile
(high).
OSM Map
General Map
Google Map
MSN Map
OSM Map
General Map
Google Map
MSN Map
OSM Map
General Map
Google Map
MSN Map
OSM Map
General Map
Google Map
MSN Map
Please wait while loading the map...
Real estate property taxes paid for housing units in 2022:
This zip code:
0.7% ($2,168)
Florida:
0.7% ($2,529)
Median real estate property taxes paid for housing units with mortgages in 2022: $2,521 (0.8%) Median real estate property taxes paid for housing units with no mortgage in 2022: $1,561 (0.6%)
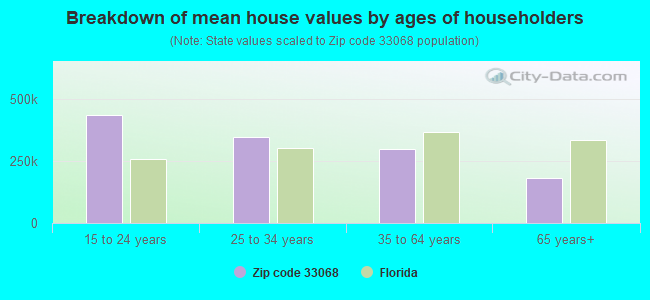
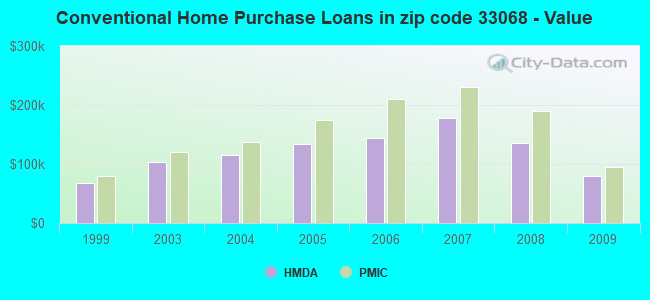
Estimated median house/condo value in 2022: $301,143
33068:
$301,143
Florida:
$354,100
According to our research of Florida and other state lists, there were 25 registered sex offenders living in 33068 zip code as of April 27, 2024. The ratio of all residents to sex offenders in zip code 33068 is 2,088 to 1. The ratio of registered sex offenders to all residents in this zip code is much lower than the state average.
Median resident age:
This zip code:
38.0 years
Florida median age:
42.7 years
Average household size:
This zip code:
2.8 people
Florida:
2.5 people
Averages for the 2020 tax year for zip code 33068, filed in 2021:
Average Adjusted Gross Income (AGI) in 2020: $34,120 (Individual Income Tax Returns)
Here:
$34,120
State:
$82,200
Salary/wage: $34,843 (reported on 84.8% of returns)
Here:
$34,843
State:
$58,347
(% of AGI for various income ranges: 1339.1% for AGIs below $25k, 3860.7% for AGIs $25k-50k, 7109.8% for AGIs $50k-75k, 10192.5% for AGIs $75k-100k, 16662.8% for AGIs $100k-200k, 47660.0% for AGIs over 200k)
Taxable interest for individuals: $459 (reported on 8.4% of returns)
This zip code:
$459
Florida:
$4,272
(% of AGI for various income ranges: 2.4% for AGIs below $25k, 3.2% for AGIs $25k-50k, 5.8% for AGIs $50k-75k, 16.0% for AGIs $75k-100k, 38.1% for AGIs $100k-200k, 213.3% for AGIs over 200k)
Ordinary dividends: $1,565 (reported on 5.1% of returns)
Here:
$1,565
State:
$15,863
(% of AGI for various income ranges: 2.9% for AGIs below $25k, 5.1% for AGIs $25k-50k, 10.0% for AGIs $50k-75k, 38.0% for AGIs $75k-100k, 134.7% for AGIs $100k-200k, 420.0% for AGIs over 200k)
Net capital gain/loss in AGI: +$2,676 (reported on 6.1% of returns)
Here:
+$2,676
State:
+$62,983
(% of AGI for various income ranges: 2.9% for AGIs $25k-50k, 26.3% for AGIs $50k-75k, 54.9% for AGIs $75k-100k, 378.2% for AGIs $100k-200k, 3153.3% for AGIs over 200k)
Profit/loss from business: +$2,278 (reported on 33.8% of returns)
Here:
+$2,278
State:
+$9,719
(% of AGI for various income ranges: 178.9% for AGIs below $25k, 115.2% for AGIs $50k-75k, 108.0% for AGIs $75k-100k, 274.0% for AGIs $100k-200k)
Taxable individual retirement arrangement distribution: $12,394 (reported on 1.9% of returns)
33068:
$12,394
Florida:
$24,823
(% of AGI for various income ranges: 8.6% for AGIs below $25k, 19.0% for AGIs $25k-50k, 45.8% for AGIs $50k-75k, 107.3% for AGIs $75k-100k, 341.4% for AGIs $100k-200k)
Total itemized deductions: $25,799 (reported on 5.5% of returns)
Here:
$25,799
State:
$45,393
(% of AGI for various income ranges: 29.5% for AGIs below $25k, 169.6% for AGIs $25k-50k, 470.6% for AGIs $50k-75k, 617.8% for AGIs $75k-100k, 811.2% for AGIs $100k-200k, 3730.0% for AGIs over 200k)
Charity contributions: $6,561 (reported on 4.1% of returns)
Here:
$6,561
State:
$20,178
(% of AGI for various income ranges: 2.4% for AGIs below $25k, 26.7% for AGIs $25k-50k, 90.1% for AGIs $50k-75k, 130.1% for AGIs $75k-100k, 258.8% for AGIs $100k-200k, 823.3% for AGIs over 200k)
Taxes paid: $5,503 (reported on 5.3% of returns)
33068:
$5,503
State:
$6,967
(% of AGI for various income ranges: 5.8% for AGIs below $25k, 38.0% for AGIs $25k-50k, 88.3% for AGIs $50k-75k, 122.9% for AGIs $75k-100k, 178.6% for AGIs $100k-200k, 620.0% for AGIs over 200k)
Earned income credit: $2,657 (reported on 36.0% of returns)
Here:
$2,657
State:
$2,306
(% of AGI for various income ranges: 178.2% for AGIs below $25k, 103.7% for AGIs $25k-50k, 1.4% for AGIs $50k-75k)
Percentage of individuals using paid preparers for their 2020 taxes: 92.9%
Here:
93%
State:
92%
(% for various income ranges: 92.1% for AGIs below $25k, 94.5% for AGIs $25k-50k, 92.5% for AGIs $50k-75k, 92.4% for AGIs $75k-100k, 92.5% for AGIs $100k-200k, 87.5% for AGIs over 200k)
Averages for the 2012 tax year for zip code 33068, filed in 2013:
Average Adjusted Gross Income (AGI) in 2012: $28,183 (Individual Income Tax Returns)
Here:
$28,183
State:
$60,316
Salary/wage: $28,367 (reported on 87.4% of returns)
Here:
$28,367
State:
$45,277
(% of AGI for various income ranges: 84.2% for AGIs below $25k, 94.5% for AGIs $25k-50k, 90.6% for AGIs $50k-75k, 87.9% for AGIs $75k-100k, 86.0% for AGIs $100k-200k)
Taxable interest for individuals: $874 (reported on 9.4% of returns)
This zip code:
$874
Florida:
$3,587
(% of AGI for various income ranges: 0.3% for AGIs below $25k, 0.3% for AGIs $25k-50k, 0.3% for AGIs $50k-75k, 0.2% for AGIs $75k-100k, 0.3% for AGIs $100k-200k)
Ordinary dividends: $2,957 (reported on 4.8% of returns)
Here:
$2,957
State:
$12,831
(% of AGI for various income ranges: 0.5% for AGIs below $25k, 0.6% for AGIs $25k-50k, 0.3% for AGIs $50k-75k, 0.6% for AGIs $75k-100k, 0.6% for AGIs $100k-200k)
Net capital gain/loss in AGI: +$3,520 (reported on 3.3% of returns)
Here:
+$3,520
State:
+$33,493
(% of AGI for various income ranges: 5.2% for AGIs $100k-200k)
Profit/loss from business: +$3,635 (reported on 25.3% of returns)
Here:
+$3,635
State:
+$10,012
(% of AGI for various income ranges: 10.0% for AGIs below $25k, 0.3% for AGIs $25k-50k, 0.6% for AGIs $50k-75k, 0.8% for AGIs $75k-100k, 2.2% for AGIs $100k-200k)
Taxable individual retirement arrangement distribution: $10,540 (reported on 2.5% of returns)
33068:
$10,540
Florida:
$21,544
(% of AGI for various income ranges: 0.6% for AGIs below $25k, 0.6% for AGIs $25k-50k, 0.9% for AGIs $50k-75k, 1.6% for AGIs $75k-100k, 2.8% for AGIs $100k-200k)
Total itemized deductions: $16,489 (33% of AGI, reported on 18.9% of returns)
Here:
$16,489
State:
$25,533
Here:
33.5% of AGI
State:
18.0% of AGI
(% of AGI for various income ranges: 5.9% for AGIs below $25k, 13.4% for AGIs $25k-50k, 14.4% for AGIs $50k-75k, 12.4% for AGIs $75k-100k, 12.4% for AGIs $100k-200k)
Charity contributions: $2,960 (reported on 14.9% of returns)
Here:
$2,960
State:
$5,698
(% of AGI for various income ranges: 0.6% for AGIs below $25k, 1.7% for AGIs $25k-50k, 2.2% for AGIs $50k-75k, 2.3% for AGIs $75k-100k, 2.3% for AGIs $100k-200k)
Taxes paid: $2,520 (reported on 17.8% of returns)
33068:
$2,520
State:
$6,203
(% of AGI for various income ranges: 0.7% for AGIs below $25k, 1.9% for AGIs $25k-50k, 2.2% for AGIs $50k-75k, 1.8% for AGIs $75k-100k, 2.3% for AGIs $100k-200k)
Earned income credit: $2,665 (reported on 42.6% of returns)
Here:
$2,665
State:
$2,372
(% of AGI for various income ranges: 12.1% for AGIs below $25k, 1.8% for AGIs $25k-50k)
Percentage of individuals using paid preparers for their 2012 taxes: 73.2%
Here:
73%
State:
54%
(% for various income ranges: 76.3% for AGIs below $25k, 70.1% for AGIs $25k-50k, 66.7% for AGIs $50k-75k, 64.6% for AGIs $75k-100k, 66.0% for AGIs $100k-200k)
Averages for the 2004 tax year for zip code 33068, filed in 2005:
Average Adjusted Gross Income (AGI) in 2004: $27,550 (Individual Income Tax Returns)
Here:
$27,550
State:
$50,523
Salary/wage: $28,198 (reported on 88.0% of returns)
Here:
$28,198
State:
$39,563
(% of AGI for various income ranges: 81.1% for AGIs below $10k, 86.6% for AGIs $10k-25k, 93.9% for AGIs $25k-50k, 92.2% for AGIs $50k-75k, 91.5% for AGIs $75k-100k, 74.6% for AGIs over 100k)
Taxable interest for individuals: $808 (reported on 18.4% of returns)
This zip code:
$808
Florida:
$3,211
(% of AGI for various income ranges: 1.4% for AGIs below $10k, 0.7% for AGIs $10k-25k, 0.3% for AGIs $25k-50k, 0.4% for AGIs $50k-75k, 0.4% for AGIs $75k-100k, 1.5% for AGIs over 100k)
Taxable dividends: $1,049 (reported on 6.9% of returns)
Here:
$1,049
State:
$6,129
(% of AGI for various income ranges: 0.9% for AGIs below $10k, 0.4% for AGIs $10k-25k, 0.1% for AGIs $25k-50k, 0.2% for AGIs $50k-75k, 0.3% for AGIs $75k-100k, 0.5% for AGIs over 100k)
Net capital gain/loss: +$3,263 (reported on 5.3% of returns)
Here:
+$3,263
State:
+$27,205
(% of AGI for various income ranges: -0.7% for AGIs below $10k, 0.1% for AGIs $10k-25k, 0.2% for AGIs $25k-50k, 0.6% for AGIs $50k-75k, 0.7% for AGIs $75k-100k, 5.8% for AGIs over 100k)
Profit/loss from business: +$6,003 (reported on 19.0% of returns)
Here:
+$6,003
State:
+$10,634
(% of AGI for various income ranges: 27.4% for AGIs below $10k, 9.1% for AGIs $10k-25k, 2.0% for AGIs $25k-50k, 1.3% for AGIs $50k-75k, 0.7% for AGIs $75k-100k, 0.6% for AGIs over 100k)
IRA payment deduction: $2,175 (reported on 1.2% of returns)
33068:
$2,175
Florida:
$3,082
(% of AGI for various income ranges: 0.1% for AGIs $10k-25k, 0.1% for AGIs $25k-50k, 0.1% for AGIs $50k-75k, 0.2% for AGIs $75k-100k)
Total itemized deductions: $15,326 (36% of AGI, reported on 30.2% of returns)
Here:
$15,326
State:
$20,370
Here:
36.2% of AGI
State:
20.7% of AGI
(% of AGI for various income ranges: 9.1% for AGIs below $10k, 14.4% for AGIs $10k-25k, 20.0% for AGIs $25k-50k, 17.5% for AGIs $50k-75k, 14.2% for AGIs $75k-100k, 12.3% for AGIs over 100k)
Charity contributions deductions: $2,436 (5% of AGI, reported on 25.2% of returns)
Here:
$2,436
State:
$4,064
Here:
5.5% of AGI
State:
3.8% of AGI
(% of AGI for various income ranges: 0.5% for AGIs below $10k, 1.5% for AGIs $10k-25k, 2.5% for AGIs $25k-50k, 2.6% for AGIs $50k-75k, 2.5% for AGIs $75k-100k, 2.3% for AGIs over 100k)
Total tax: $2,747 (reported on 64.9% of returns)
33068:
$2,747
State:
$9,431
(% of AGI for various income ranges: 5.0% for AGIs below $10k, 3.5% for AGIs $10k-25k, 5.1% for AGIs $25k-50k, 8.0% for AGIs $50k-75k, 10.2% for AGIs $75k-100k, 14.9% for AGIs over 100k)
Earned income credit: $1,909 (reported on 32.7% of returns)
Here:
$1,909
State:
$1,808
Percentage of individuals using paid preparers for their 2004 taxes: 65.9%
Here:
66%
State:
60%
(% for various income ranges: 64.0% for AGIs below $10k, 69.8% for AGIs $10k-25k, 64.8% for AGIs $25k-50k, 62.1% for AGIs $50k-75k, 60.0% for AGIs $75k-100k, 60.7% for AGIs over 100k)
Likely homosexual households (counted as self-reported same-sex unmarried-partner households)
Lesbian couples: 0.0% of all households
Gay men: 0.1% of all households
Household received Food Stamps/SNAP in the past 12 months: 3,903 Household did not receive Food Stamps/SNAP in the past 12 months: 15,576
Women who had a birth in the past 12 months: 801 (368 now married, 412 unmarried) Women who did not have a birth in the past 12 months: 14,583 (5,643 now married, 8,938 unmarried)
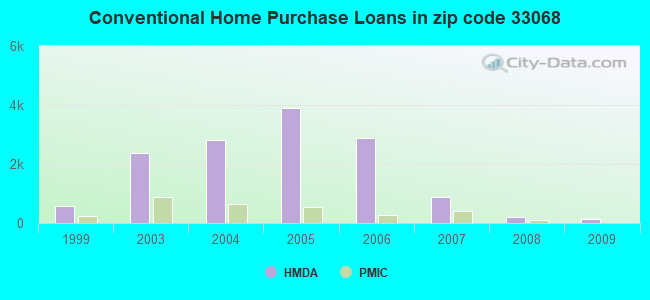
Housing units in zip code 33068 with a mortgage: 8,406 (501 second mortgage, 69 home equity loan, 186 both second mortgage and home equity loan) Houses without a mortgage: 65
Median monthly owner costs for units with a mortgage: $1,779 Median monthly owner costs for units without a mortgage: $542
Residents with income below the poverty level in 2022:
This zip code:
14.2%
Whole state:
12.7%
Residents with income below 50% of the poverty level in 2022:
This zip code:
7.4%
Whole state:
6.6%
Median number of rooms in houses and condos:
Here:
5.4
State:
5.9
Median number of rooms in apartments:
Here:
4.2
State:
4.2
Notable locations in this zip code not listed on our city pages
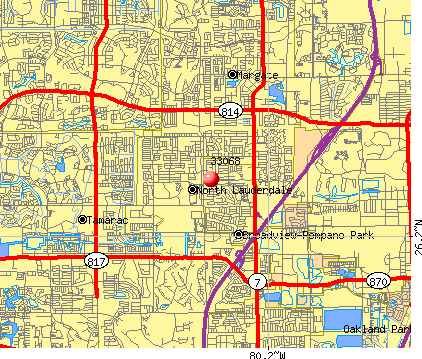
Notable locations in zip code 33068: North Lauderdale Market Place (A), North Lauderdale Square (B), Kimberly Plaza (C), Presidential Plaza (D), North Lauderdale Branch Library (E), North Lauderdale City Hall (F), North Lauderdale Fire Station (G), North Lauderdale Police Station (H), North Lauderdale Fire Rescue Station 44 (I), North Lauderdale Fire Rescue Station 34 (J). Display/hide their locations on the map
Shopping Centers: Coral Lakes Plaza Shopping Center (1), Kimberly Square Shopping Center (2), Kimberly Village Shoppes Shopping Center (3), Presidential Palace Shopping Center (4), Southgate Merchandise Mart Shopping Center (5), Candlewood Square Shopping Center (6). Display/hide their locations on the map
Churches in zip code 33068 include: Grace Brethren Church of North Lauderdale (A), Broadview Baptist Church (B), Cypress Creek Baptist Church (C), Our Lady Queen of Heaven (D), First Baptist Church of North Lauderdale (E). Display/hide their locations on the map
In group quarters: 102 (-1 institutionalized population)
Size of family households: 4,718 2-persons, 3,572 3-persons, 2,593 4-persons, 1,460 5-persons, 522 6-persons, 400 7-or-more-persons
Size of nonfamily households: 5,510 1-person, 676 2-persons, 79 3-persons
5,536 married couples with children.
5,074 single-parent households (749 men, 4,325 women).
59.2% of residents of 33068 zip code speak English at home.
20.1% of residents speak Spanish at home (57% very well, 23% well, 14% not well, 7% not at all).
18.7% of residents speak other Indo-European language at home (56% very well, 22% well, 14% not well, 9% not at all).
1.0% of residents speak Asian or Pacific Island language at home (60% very well, 18% well, 22% not well).
1.2% of residents speak other language at home (94% very well, 1% well, 5% not well).
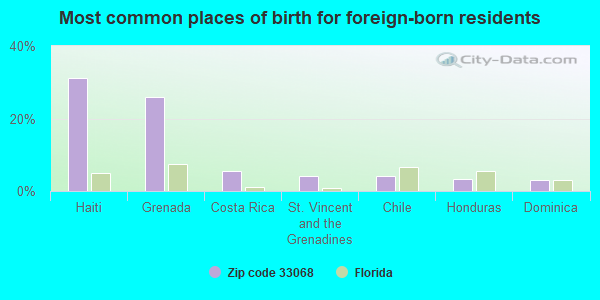
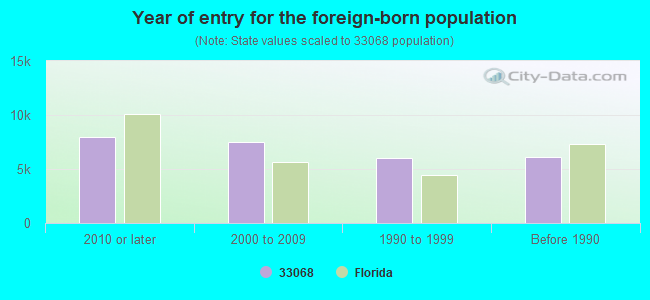
Foreign born population: 26,283 (48.4%) (63.4% of them are naturalized citizens)
Major facilities with environmental interests located in this zip code:
MORROW ELEMENTARY SCHOOL (408 SW 76TH TER in NORTH LAUDERDALE, FL)
(Geographic Names Information System) (National Center for Education Statistics) - STATE ID-2691 Organizations: BROWARD COUNTY SCHOOL DISTRICT (SCHOOL DISTRICT)
NORTH LAUDERDALE ELEMENTARY SCHOOL (7500 KIMBERLY BLVD in NORTH LAUDERDALE, FL)
(Geographic Names Information System) (National Center for Education Statistics) - STATE ID-2231 Organizations: BROWARD COUNTY SCHOOL DISTRICT (SCHOOL DISTRICT)
ALPHABET LAND (7540 SOUTHGATE BOULEVARD in NORTH LAUDERDALE, FL)
(National Center for Education Statistics) - STATE ID-5581 Organizations: BROWARD COUNTY SCHOOL DISTRICT (SCHOOL DISTRICT)
NORTH BROWARD ACADEMY OF EXCELLENCE (955 SW 71ST AVENUE in NORTH LAUDERDALE, FL)
(National Center for Education Statistics) - STATE ID-5161 Organizations: BROWARD COUNTY SCHOOL DISTRICT (SCHOOL DISTRICT)
NORTH LAUDERDALE ACADEMY CHARTER SCHOOL (7201 KIMBERLY BOULEVARD in NORTH LAUDERDALE, FL)
(National Center for Education Statistics) - STATE ID-5061 Organizations: BROWARD COUNTY SCHOOL DISTRICT (SCHOOL DISTRICT)
PINEWOOD ELEMENTARY SCHOOL (1600 SW 83RD AVE in NORTH LAUDERDALE, FL)
(National Center for Education Statistics) - STATE ID-2811 Organizations: BROWARD COUNTY SCHOOL DISTRICT (SCHOOL DISTRICT)
CONDER & ASSOCIATES INC (7224 WEST MCNAB ROAD in NORTH LAUDERDALE, FL)
AIR MINOR (AIRS/AFS) (Resource Conservation and Recovery Act (tracking hazardous waste)) Business SIC classification: DRYCLEANING PLANTS, EXCEPT RUG CLEANING Organizations: KATRADE INC (CONTACT/OWNER)
Alternative names: CONDER QUALITY DRY CLEANER
SAI-S-INC (7220 SOUTHGATE BOULEVARD in NORTH LAUDERDALE, FL)
AIR MINOR (AIRS/AFS) Small Quantity Generators, between 100 kg and 1000 kg of hazardous waste/month (Resource Conservation and Recovery Act (tracking hazardous waste)) - notification Business SIC classification: DRYCLEANING PLANTS, EXCEPT RUG CLEANING Organizations: SATISH CHAUHAN (CONTACT/OWNER)
Alternative names: DRY CLEAN USA
SAN REMO TOWNHOMES (NORTHWEST CORNER OF SR 7 AND B in NORTH LAUDERDALE, FL)
National Pollutant Discharge Elimination System NON-MAJOR (Tracking pollutant discharge elimination systems) - permit Organizations: GERALD VALENT (CONTACT/OWNER)
SANCTUARY COVE (CYPRESS CREEK WEST & FLORIDA T in N. LAUDERDALE, FL)
National Pollutant Discharge Elimination System NON-MAJOR (Tracking pollutant discharge elimination systems) - permit Organizations: GERALD VALENT (CONTACT/OWNER)
KIMBERLY PLAZA CLEANERS & TAILORS (947 S W 71 AVENUE in NORTH LAUDERDALE, FL)
(Resource Conservation and Recovery Act (tracking hazardous waste)) Organizations: CHARLES BON, MANAGER (CONTACT/OWNER)
LOT 42 @ LANDMARK RANCH ESTATE (16720 BERSHIRE CT in UNINCORPORATED, FL)
National Pollutant Discharge Elimination System NON-MAJOR (Tracking pollutant discharge elimination systems) - permit Organizations: MIKE BELLET (CONTACT/OWNER)
MEDITERANIA (8101 SW 17TH ST in NORTH LAUDERDALE, FL)
National Pollutant Discharge Elimination System NON-MAJOR (Tracking pollutant discharge elimination systems) - permit Organizations: SILVIO CARDOSO (CONTACT/OWNER)
Housing units lacking complete plumbing facilities: 0.8% Housing units lacking complete kitchen facilities: 1.0%
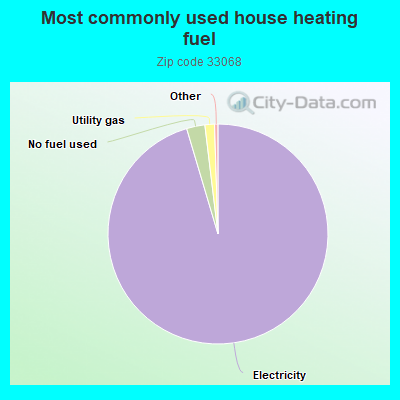
95.5%Electricity
2.7%No fuel used
1.4%Utility gas
Population in 1990: 41,835. Population change in the 1990s: +5,861 (+14.0%).
Place of birth for U.S.-born residents:
This state: 18,174
Northeast: 5,519
Midwest: 1,136
South: 1,089
West: 538
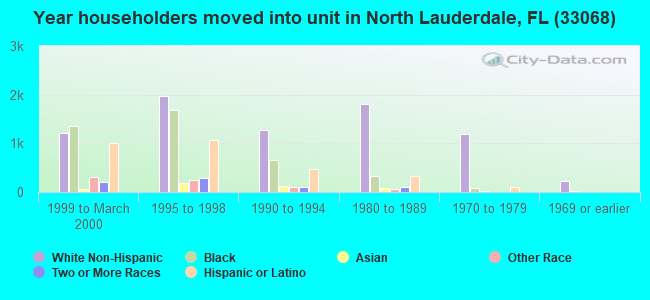
52% of the 33068 zip code residents lived in the same house 5 years ago. Out of people who lived in different houses, 68% lived in this county. Out of people who lived in different counties, 50% lived in Florida.
92% of the 33068 zip code residents lived in the same house 1 year ago. Out of people who lived in different houses, 59% moved from this county. Out of people who lived in different houses, 13% moved from different county within same state. Out of people who lived in different houses, 10% moved from different state. Out of people who lived in different houses, 18% moved from abroad.
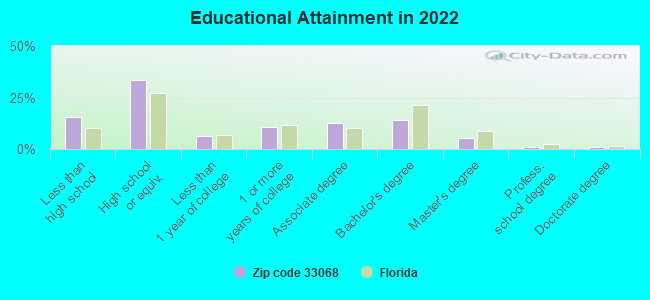
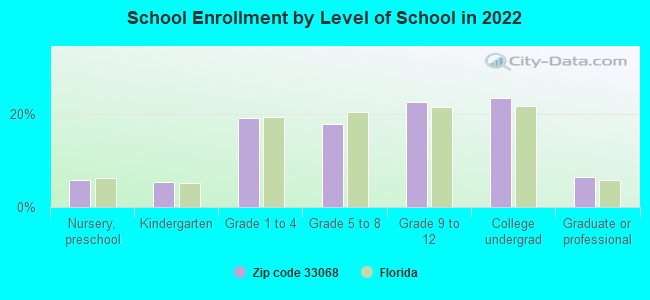
Private vs. public school enrollment:
Students in private schools in grades 1 to 8 (elementary and middle school): 500
Here:
8.9%
Florida:
15.8%
Students in private schools in grades 9 to 12 (high school): 277
Here:
8.0%
Florida:
12.9%
Students in private undergraduate colleges: 480
Here:
13.6%
Florida:
23.6%
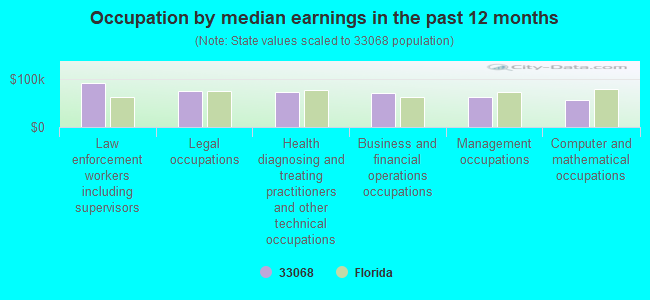
Occupation by median earnings in the past 12 months ($)
91,130Law enforcement workers including supervisors
75,017Legal occupations
73,511Health diagnosing and treating practitioners and other technical occupations
70,215Business and financial operations occupations
61,740Management occupations
56,712Computer and mathematical occupations
Companies with federal contracts located in this zip code:
BOYZ -N- THE HOOD (621 SW 50TH TERRACE in MARGATE, FL; small business) : $37,255 in 4 contractsfrom 2001 to 2004
$17,105 with Navy for Water Quality Studies. Signed on 2001-11-20. Completion date: 2002-11-30.
$13,260, same as above.Signed on 2003-02-06. Completion date: 2002-09-30.
$6,630 with Navy for Maintenance, Repair or Alteration of Real Property -- Other Non-Building Facilities. Signed on 2004-12-08. Completion date: 2005-03-31.
$260 with Navy for Water Quality Studies. Signed on 2002-07-30. Completion date: 2002-09-30.
SENTINAL AMERICAN RESEARCH CEN (7544 W MCNAB RD STE C3 in POMPANO BEACH, FL; small business) : $25,245 in 3 contractsfrom 2005 to 2006
$9,873 with Defense Logistics Agency for Gasoline Reciprocating Engines, Except Aircraft; and Components. Signed on 2005-06-06. Completion date: 2005-09-10.
$9,237 with Defense Logistics Agency for Torque Converters and Speed Changers. Signed on 2006-03-31. Completion date: 2006-05-25.
$6,135, same as above.Signed on 2005-02-22. Completion date: 2005-03-27.
Top industries in this zip code by the number of employees in 2005:
Administrative and Support and Waste Management and Remediation Services: Telemarketing Bureaus (over 1000 employees: 1 establishment, 250-499 employees: 1 establishment, 1-4 employees: 1 establishment)
Health Care and Social Assistance: Child and Youth Services (250-499: 1)
2002 - 2018 National Fire Incident Reporting System (NFIRS) incidents
Based on the data from the years 2002 - 2018 the average number of fire incidents per year is 98. The highest number of fire incidents - 128 took place in 2012, and the least - 14 in 2002. The data has a growing trend.
When looking into fire subcategories, the most incidents belonged to: Structure Fires (50.9%), and Outside Fires (23.1%).
Fire incident types reported to NFIRS in Zip Code 33068


 Nearest zip codes: 33319, 33063, 33321, 33309, 33071, 33066.


 Based on the data from the years 2002 - 2018 the average number of fire incidents per year is 98. The highest number of fire incidents - 128 took place in 2012, and the least - 14 in 2002. The data has a growing trend.
 When looking into fire subcategories, the most incidents belonged to: Structure Fires (50.9%), and Outside Fires (23.1%).