Estimated zip code population in 2022: 32,581 Zip code population in 2010: 31,407 Zip code population in 2000: 29,788
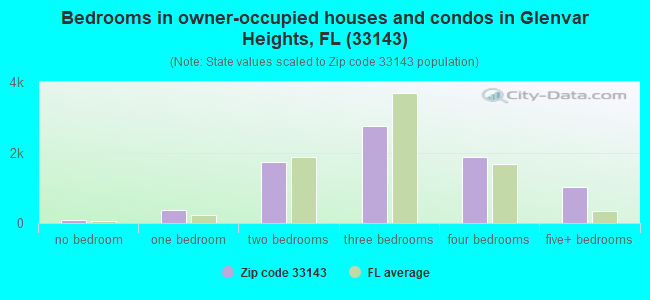
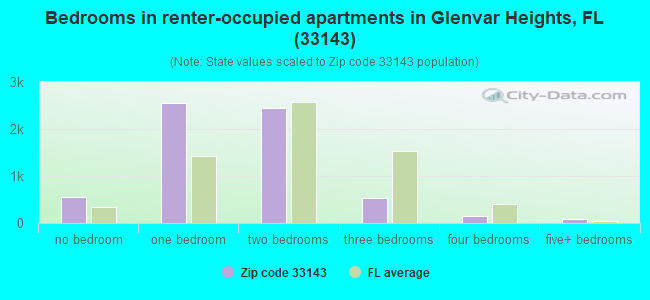
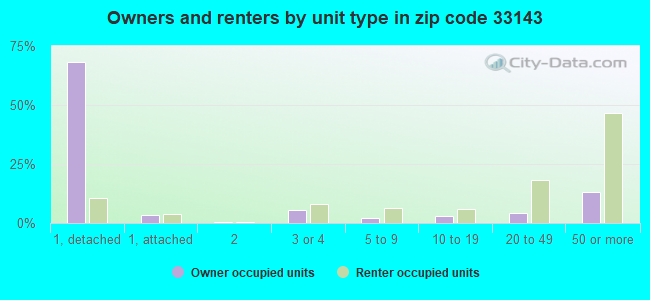
Houses and condos: 15,315 Renter-occupied apartments: 6,259
% of renters here:
44%
State:
33%
March 2022 cost of living index in zip code 33143: 109.9 (more than average, U.S. average is 100)
Land area: 7.9 sq. mi. Water area: 0.2 sq. mi.
Population density: 4,127 people per square mile
(average).
OSM Map
General Map
Google Map
MSN Map
OSM Map
General Map
Google Map
MSN Map
OSM Map
General Map
Google Map
MSN Map
OSM Map
General Map
Google Map
MSN Map
Please wait while loading the map...
Real estate property taxes paid for housing units in 2022:
This zip code:
0.6% ($5,218)
Florida:
0.7% ($2,529)
Median real estate property taxes paid for housing units with mortgages in 2022: $5,624 (0.6%) Median real estate property taxes paid for housing units with no mortgage in 2022: $4,730 (0.7%)
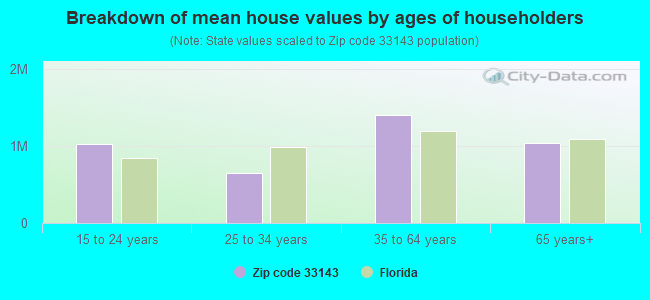
Estimated median house/condo value in 2022: $862,589
33143:
$862,589
Florida:
$354,100
According to our research of Florida and other state lists, there were 11 registered sex offenders living in 33143 zip code as of April 27, 2024. The ratio of all residents to sex offenders in zip code 33143 is 2,997 to 1. The ratio of registered sex offenders to all residents in this zip code is much lower than the state average.
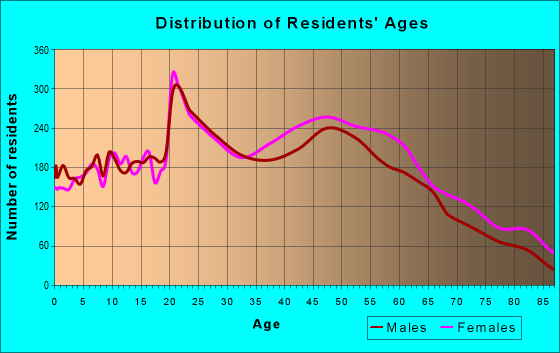
Median resident age:
This zip code:
41.1 years
Florida median age:
42.7 years
Average household size:
This zip code:
2.3 people
Florida:
2.5 people
Averages for the 2020 tax year for zip code 33143, filed in 2021:
Average Adjusted Gross Income (AGI) in 2020: $229,560 (Individual Income Tax Returns)
Here:
$229,560
State:
$82,200
Salary/wage: $123,912 (reported on 76.3% of returns)
Here:
$123,912
State:
$58,347
(% of AGI for various income ranges: 1224.3% for AGIs below $25k, 3914.4% for AGIs $25k-50k, 6721.9% for AGIs $50k-75k, 10682.6% for AGIs $75k-100k, 19938.6% for AGIs $100k-200k, 159634.6% for AGIs over 200k)
Taxable interest for individuals: $14,648 (reported on 35.6% of returns)
This zip code:
$14,648
Florida:
$4,272
(% of AGI for various income ranges: 40.2% for AGIs below $25k, 51.4% for AGIs $25k-50k, 87.6% for AGIs $50k-75k, 151.2% for AGIs $75k-100k, 551.1% for AGIs $100k-200k, 11426.3% for AGIs over 200k)
Ordinary dividends: $40,959 (reported on 28.9% of returns)
Here:
$40,959
State:
$15,863
(% of AGI for various income ranges: 58.8% for AGIs below $25k, 74.2% for AGIs $25k-50k, 192.7% for AGIs $50k-75k, 353.5% for AGIs $75k-100k, 875.5% for AGIs $100k-200k, 26903.8% for AGIs over 200k)
Net capital gain/loss in AGI: +$171,026 (reported on 29.5% of returns)
Here:
+$171,026
State:
+$62,983
(% of AGI for various income ranges: 34.6% for AGIs below $25k, 72.2% for AGIs $25k-50k, 181.3% for AGIs $50k-75k, 411.9% for AGIs $75k-100k, 1473.6% for AGIs $100k-200k, 122487.1% for AGIs over 200k)
Profit/loss from business: +$17,983 (reported on 28.4% of returns)
Here:
+$17,983
State:
+$9,719
(% of AGI for various income ranges: 258.7% for AGIs below $25k, 204.1% for AGIs $25k-50k, 233.7% for AGIs $50k-75k, 449.0% for AGIs $75k-100k, 847.4% for AGIs $100k-200k, 8403.3% for AGIs over 200k)
Taxable individual retirement arrangement distribution: $31,274 (reported on 7.1% of returns)
33143:
$31,274
Florida:
$24,823
(% of AGI for various income ranges: 37.4% for AGIs below $25k, 70.0% for AGIs $25k-50k, 169.6% for AGIs $50k-75k, 407.4% for AGIs $75k-100k, 960.7% for AGIs $100k-200k, 2873.0% for AGIs over 200k)
Self-employed (Keogh) retirement plans: $37,980 (reported on 1.0% of returns)
33143:
$37,980
Florida:
$29,694
(% of AGI for various income ranges: 74.6% for AGIs $75k-100k, 822.5% for AGIs over 200k)
Total itemized deductions: $52,983 (reported on 15.7% of returns)
Here:
$52,983
State:
$45,393
(% of AGI for various income ranges: 81.1% for AGIs below $25k, 197.9% for AGIs $25k-50k, 390.8% for AGIs $50k-75k, 733.9% for AGIs $75k-100k, 1699.1% for AGIs $100k-200k, 15468.9% for AGIs over 200k)
Charity contributions: $18,934 (reported on 13.2% of returns)
Here:
$18,934
State:
$20,178
(% of AGI for various income ranges: 3.8% for AGIs below $25k, 25.4% for AGIs $25k-50k, 61.3% for AGIs $50k-75k, 89.4% for AGIs $75k-100k, 283.0% for AGIs $100k-200k, 5460.6% for AGIs over 200k)
Taxes paid: $8,761 (reported on 15.6% of returns)
33143:
$8,761
State:
$6,967
(% of AGI for various income ranges: 15.7% for AGIs below $25k, 49.5% for AGIs $25k-50k, 99.2% for AGIs $50k-75k, 202.6% for AGIs $75k-100k, 413.5% for AGIs $100k-200k, 2098.3% for AGIs over 200k)
Earned income credit: $1,788 (reported on 14.2% of returns)
Here:
$1,788
State:
$2,306
(% of AGI for various income ranges: 91.4% for AGIs below $25k, 41.8% for AGIs $25k-50k)
Percentage of individuals using paid preparers for their 2020 taxes: 90.1%
Here:
90%
State:
92%
(% for various income ranges: 89.3% for AGIs below $25k, 90.2% for AGIs $25k-50k, 91.9% for AGIs $50k-75k, 90.5% for AGIs $75k-100k, 88.8% for AGIs $100k-200k, 91.3% for AGIs over 200k)
Averages for the 2012 tax year for zip code 33143, filed in 2013:
Average Adjusted Gross Income (AGI) in 2012: $153,247 (Individual Income Tax Returns)
Here:
$153,247
State:
$60,316
Salary/wage: $86,564 (reported on 79.3% of returns)
Here:
$86,564
State:
$45,277
(% of AGI for various income ranges: 76.4% for AGIs below $25k, 84.0% for AGIs $25k-50k, 74.9% for AGIs $50k-75k, 70.1% for AGIs $75k-100k, 67.8% for AGIs $100k-200k, 34.5% for AGIs over 200k)
Taxable interest for individuals: $17,939 (reported on 36.6% of returns)
This zip code:
$17,939
Florida:
$3,587
(% of AGI for various income ranges: 2.1% for AGIs below $25k, 1.2% for AGIs $25k-50k, 1.4% for AGIs $50k-75k, 1.6% for AGIs $75k-100k, 2.0% for AGIs $100k-200k, 5.2% for AGIs over 200k)
Ordinary dividends: $44,661 (reported on 25.7% of returns)
Here:
$44,661
State:
$12,831
(% of AGI for various income ranges: 3.0% for AGIs below $25k, 1.8% for AGIs $25k-50k, 2.5% for AGIs $50k-75k, 3.1% for AGIs $75k-100k, 3.2% for AGIs $100k-200k, 9.2% for AGIs over 200k)
Net capital gain/loss in AGI: +$133,851 (reported on 23.6% of returns)
Here:
+$133,851
State:
+$33,493
(% of AGI for various income ranges: 0.4% for AGIs $25k-50k, 0.7% for AGIs $50k-75k, 1.5% for AGIs $75k-100k, 2.2% for AGIs $100k-200k, 27.5% for AGIs over 200k)
Profit/loss from business: +$21,618 (reported on 24.0% of returns)
Here:
+$21,618
State:
+$10,012
(% of AGI for various income ranges: 13.9% for AGIs below $25k, 4.4% for AGIs $25k-50k, 3.7% for AGIs $50k-75k, 4.4% for AGIs $75k-100k, 4.4% for AGIs $100k-200k, 2.7% for AGIs over 200k)
Taxable individual retirement arrangement distribution: $32,164 (reported on 8.1% of returns)
33143:
$32,164
Florida:
$21,544
(% of AGI for various income ranges: 1.7% for AGIs below $25k, 1.9% for AGIs $25k-50k, 2.2% for AGIs $50k-75k, 2.6% for AGIs $75k-100k, 3.3% for AGIs $100k-200k, 1.4% for AGIs over 200k)
Self-employment retirement plans: $27,459 (reported on 1.2% of returns)
33143:
$27,459
Florida:
$20,611
(% of AGI for various income ranges: 0.3% for AGIs $25k-50k, 0.2% for AGIs $100k-200k, 0.2% for AGIs over 200k)
Total itemized deductions: $41,960 (12% of AGI, reported on 36.1% of returns)
Here:
$41,960
State:
$25,533
Here:
11.8% of AGI
State:
18.0% of AGI
(% of AGI for various income ranges: 11.5% for AGIs below $25k, 12.9% for AGIs $25k-50k, 16.3% for AGIs $50k-75k, 16.3% for AGIs $75k-100k, 14.2% for AGIs $100k-200k, 8.3% for AGIs over 200k)
Charity contributions: $7,631 (reported on 30.2% of returns)
Here:
$7,631
State:
$5,698
(% of AGI for various income ranges: 0.7% for AGIs below $25k, 1.2% for AGIs $25k-50k, 1.6% for AGIs $50k-75k, 1.3% for AGIs $75k-100k, 1.6% for AGIs $100k-200k, 1.5% for AGIs over 200k)
Taxes paid: $11,755 (reported on 34.7% of returns)
33143:
$11,755
State:
$6,203
(% of AGI for various income ranges: 2.6% for AGIs below $25k, 2.6% for AGIs $25k-50k, 3.4% for AGIs $50k-75k, 3.7% for AGIs $75k-100k, 4.5% for AGIs $100k-200k, 2.3% for AGIs over 200k)
Earned income credit: $1,931 (reported on 15.4% of returns)
Here:
$1,931
State:
$2,372
(% of AGI for various income ranges: 5.6% for AGIs below $25k, 0.6% for AGIs $25k-50k)
Percentage of individuals using paid preparers for their 2012 taxes: 65.8%
Here:
66%
State:
54%
(% for various income ranges: 60.5% for AGIs below $25k, 60.1% for AGIs $25k-50k, 62.5% for AGIs $50k-75k, 66.7% for AGIs $75k-100k, 73.8% for AGIs $100k-200k, 87.7% for AGIs over 200k)
Averages for the 2004 tax year for zip code 33143, filed in 2005:
Average Adjusted Gross Income (AGI) in 2004: $122,026 (Individual Income Tax Returns)
Here:
$122,026
State:
$50,523
Salary/wage: $76,752 (reported on 79.6% of returns)
Here:
$76,752
State:
$39,563
(% of AGI for various income ranges: 77.1% for AGIs $10k-25k, 82.7% for AGIs $25k-50k, 76.8% for AGIs $50k-75k, 71.9% for AGIs $75k-100k, 42.4% for AGIs over 100k)
Taxable interest for individuals: $5,843 (reported on 48.9% of returns)
This zip code:
$5,843
Florida:
$3,211
(% of AGI for various income ranges: 2.9% for AGIs $10k-25k, 2.2% for AGIs $25k-50k, 2.2% for AGIs $50k-75k, 2.4% for AGIs $75k-100k, 2.2% for AGIs over 100k)
Taxable dividends: $8,641 (reported on 31.5% of returns)
Here:
$8,641
State:
$6,129
(% of AGI for various income ranges: 2.5% for AGIs $10k-25k, 1.9% for AGIs $25k-50k, 2.3% for AGIs $50k-75k, 2.3% for AGIs $75k-100k, 2.2% for AGIs over 100k)
Net capital gain/loss: +$70,082 (reported on 28.7% of returns)
Here:
+$70,082
State:
+$27,205
(% of AGI for various income ranges: 0.4% for AGIs $10k-25k, 0.5% for AGIs $25k-50k, 1.2% for AGIs $50k-75k, 2.6% for AGIs $75k-100k, 19.9% for AGIs over 100k)
Profit/loss from business: +$20,975 (reported on 21.0% of returns)
Here:
+$20,975
State:
+$10,634
(% of AGI for various income ranges: 9.6% for AGIs $10k-25k, 4.3% for AGIs $25k-50k, 4.0% for AGIs $50k-75k, 4.5% for AGIs $75k-100k, 3.2% for AGIs over 100k)
Profit/loss from farming: +$6,059 (reported on 0.1% of returns)
Here:
+$6,059
State:
-$6,005
IRA payment deduction: $3,674 (reported on 3.8% of returns)
33143:
$3,674
Florida:
$3,082
(% of AGI for various income ranges: 0.3% for AGIs $10k-25k, 0.3% for AGIs $25k-50k, 0.2% for AGIs $50k-75k, 0.3% for AGIs $75k-100k, 0.1% for AGIs over 100k)
Self-employed pension: $21,125 (reported on 1.4% of returns)
Here:
$21,125
Florida:
$15,857
Total itemized deductions: $28,890 (12% of AGI, reported on 40.9% of returns)
Here:
$28,890
State:
$20,370
Here:
12.0% of AGI
State:
20.7% of AGI
(% of AGI for various income ranges: 14.5% for AGIs $10k-25k, 16.6% for AGIs $25k-50k, 18.7% for AGIs $50k-75k, 17.5% for AGIs $75k-100k, 7.8% for AGIs over 100k)
Charity contributions deductions: $7,605 (3% of AGI, reported on 36.1% of returns)
Here:
$7,605
State:
$4,064
Here:
3.0% of AGI
State:
3.8% of AGI
(% of AGI for various income ranges: 1.2% for AGIs $10k-25k, 1.7% for AGIs $25k-50k, 2.1% for AGIs $50k-75k, 1.8% for AGIs $75k-100k, 2.3% for AGIs over 100k)
Total tax: $33,584 (reported on 78.3% of returns)
33143:
$33,584
State:
$9,431
(% of AGI for various income ranges: 4.6% for AGIs $10k-25k, 7.8% for AGIs $25k-50k, 10.5% for AGIs $50k-75k, 11.9% for AGIs $75k-100k, 24.3% for AGIs over 100k)
Earned income credit: $1,636 (reported on 13.2% of returns)
Here:
$1,636
State:
$1,808
Percentage of individuals using paid preparers for their 2004 taxes: 67.3%
Here:
67%
State:
60%
(% for various income ranges: 63.8% for AGIs below $10k, 64.5% for AGIs $10k-25k, 62.1% for AGIs $25k-50k, 64.4% for AGIs $50k-75k, 69.2% for AGIs $75k-100k, 80.8% for AGIs over 100k)
Likely homosexual households (counted as self-reported same-sex unmarried-partner households)
Lesbian couples: 0.1% of all households
Gay men: 0.3% of all households
Household received Food Stamps/SNAP in the past 12 months: 967 Household did not receive Food Stamps/SNAP in the past 12 months: 13,176
Women who had a birth in the past 12 months: 335 (269 now married, 72 unmarried) Women who did not have a birth in the past 12 months: 6,970 (3,060 now married, 3,910 unmarried)
Housing units in zip code 33143 with a mortgage: 3,880 (643 second mortgage, 590 both second mortgage and home equity loan) Houses without a mortgage: 85
Median monthly owner costs for units with a mortgage: $3,301 Median monthly owner costs for units without a mortgage: $811
Residents with income below the poverty level in 2022:
This zip code:
11.7%
Whole state:
12.7%
Residents with income below 50% of the poverty level in 2022:
This zip code:
4.9%
Whole state:
6.6%
Median number of rooms in houses and condos:
Here:
6.3
State:
5.9
Median number of rooms in apartments:
Here:
3.4
State:
4.2
Notable locations in this zip code not listed on our city pages
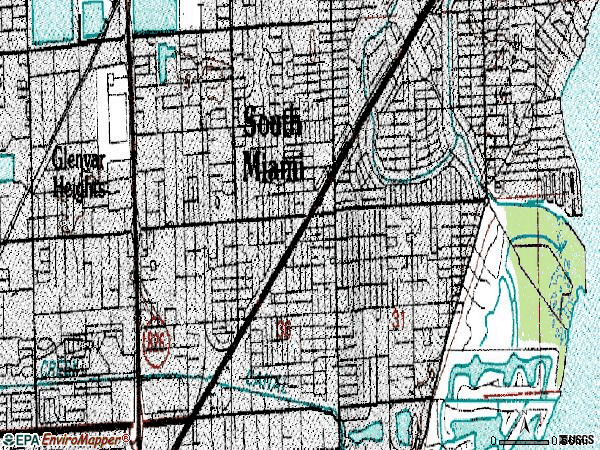
Notable locations in zip code 33143: Cocoplum Plaza (A), Isla Marina (B), Dadeland North Station (C), Village Square Plaza (D), Shops at Sunset Place (E), South Miami Station (F), University Christian Children's Center (G), The Children's House Day Care Center (H), Sunset Blossom F Michel Child Development Center (I), South Miami Hospital Child Care Center (J), South Miami Library (K), South Miami Police Station (L), Southside Field Unit (M), Rosie Lee Wesley Center (N), New Riviera Health Resort (O), Mount Nebo Community Day Care Center (P), Evelyn Richardson Family Day Care Center (Q), Child Care Center (R), Children's Paradise Child Care Center (S), Christain Day Care Center (T). Display/hide their locations on the map
Churches in zip code 33143 include: Unity Center of Practical Christianity (A), Evangelism for Christ Church (B), Cathedral del Pueblo (C), Saint Andrew Greek Orthodox Church of Kendall (D), Kendall United Methodist Church (E). Display/hide their locations on the map
Parks in zip code 33143 include: Marshall Williams Park (1), Dante B Fassell Park (2), Cartagena Plaza (3), Fuchs Park (4), Murray Park (5), Brewer Park (6), South Miami Recreation Area (7), Sunkist Estates Park (8), Trinity Pineland County Park (9). Display/hide their locations on the map
4,495 married couples with children.
1,431 single-parent households (345 men, 1,086 women).
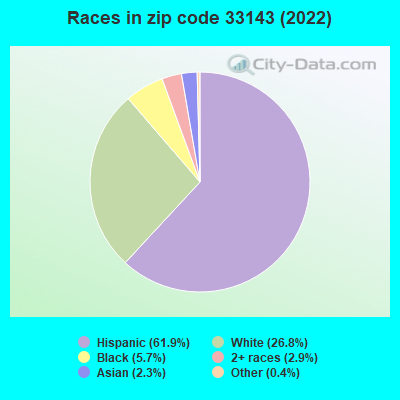
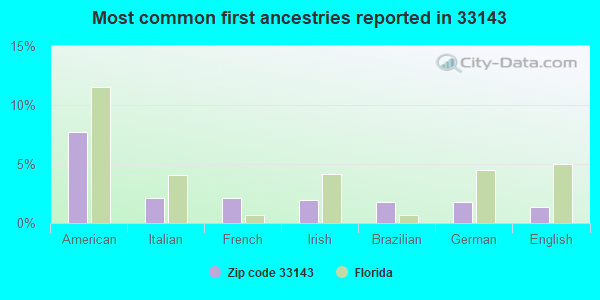
33.4% of residents of 33143 zip code speak English at home.
58.0% of residents speak Spanish at home (70% very well, 14% well, 14% not well, 3% not at all).
5.9% of residents speak other Indo-European language at home (74% very well, 12% well, 12% not well, 2% not at all).
2.2% of residents speak Asian or Pacific Island language at home (56% very well, 42% well, 2% not well).
0.2% of residents speak other language at home (78% very well, 22% well).
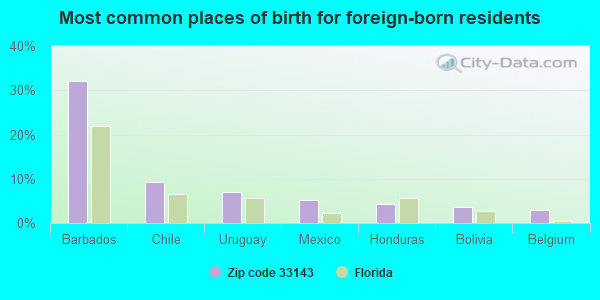
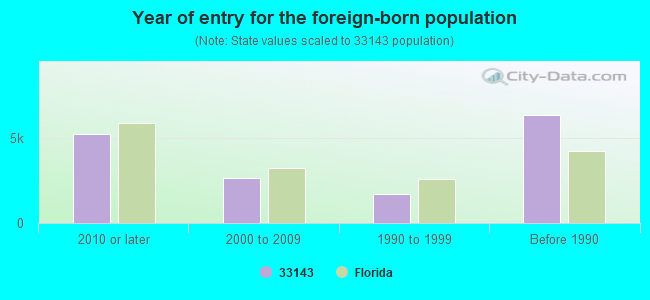
Foreign born population: 14,947 (45.9%) (69.7% of them are naturalized citizens)
Major facilities with environmental interests located in this zip code:
LUDLAM ELEMENTARY SCHOOL (6639 S.W. 74TH STREET in SOUTH MIAMI, FL)
(Geographic Names Information System) (National Center for Education Statistics) - STATE ID-3061 Small Quantity Generators, between 100 kg and 1000 kg of hazardous waste/month (Resource Conservation and Recovery Act (tracking hazardous waste)) - notification Organizations: DONALD SCHWARTZ, PRINCIPAL (CONTACT/OWNER)
, DADE COUNTY SCHOOL DISTRICT (SCHOOL DISTRICT)
Alternative names: DADE CO LUDLAM ELEMENTARY
SOUTH MIAMI ELEMENTARY SCHOOL (6800 S.W. 60TH STREET in SOUTH MIAMI, FL)
(Geographic Names Information System) (National Center for Education Statistics) - STATE ID-5241 Organizations: DADE COUNTY SCHOOL DISTRICT (SCHOOL DISTRICT)
J.R.E. OPPORTUNITY SCHOOL ALTERNATIVE EDUCATION (6521 S.W. 62ND AVENUE in SOUTH MIAMI, FL)
(National Center for Education Statistics) - STATE ID-2861 Organizations: DADE COUNTY SCHOOL DISTRICT (SCHOOL DISTRICT)
SOUTH MIAMI MIDDLE SCHOOL (6750 S.W. 60TH STREET in SOUTH MIAMI, FL)
(National Center for Education Statistics) - STATE ID-6881 Organizations: DADE COUNTY SCHOOL DISTRICT (SCHOOL DISTRICT)
MARINE LIFE RESEARCH LABORATORIES, INC. (7801 SW 71 AVE in MIAMI, FL)
(Integrated Compliance Information System) - ICIS-04-1996-0607, FORMAL ENFORCEMENT ACTION Business SIC classification: COMMERCIAL PHYSICAL AND BIOLOGICAL RESEARCH
MARIO'S DRY CLEANING (5828 SOUTH WEST 71 STREET in SOUTH MIAMI, FL)
AIR MINOR (AIRS/AFS) SUPERFUND (Superfund database) Small Quantity Generators, between 100 kg and 1000 kg of hazardous waste/month (Resource Conservation and Recovery Act (tracking hazardous waste)) - notification Business SIC classification: DRYCLEANING PLANTS, EXCEPT RUG CLEANING Organizations: MARIO CAPONE, PRES (CONTACT/OWNER)
Alternative names: MARIO CUSTOM TAILOR SITE
MARIO'S DRY CLEANERS (12117 SOUTH DIXIE HIGHWAY in MIAMI, FL)
SUPERFUND (Superfund database) (Resource Conservation and Recovery Act (tracking hazardous waste)) Organizations: MARIO CAPONE, PRES (CONTACT/OWNER)
Alternative names: MARIOS FINEST CLEANERS, SUNILAND CLEANERS SOUTH
AUGUSTA GREENS (E OF SW 157TH AVE. & N. OF SW in MIAMI, FL)
National Pollutant Discharge Elimination System NON-MAJOR (Tracking pollutant discharge elimination systems) - permit Organizations: KENNETH MACFARLANE (CONTACT/OWNER)
SHERWIN WILLIAMS CO (6232 SO DIXIE HIGHWAY in SOUTH MIAMI, FL)
(Resource Conservation and Recovery Act (tracking hazardous waste)) Organizations: A A ARTERS, DIR REG POLICY (CONTACT/OWNER)
COORDINATED CARIBBEAN TRANSPORT INC (1533 SUNSET DRIVE in MIAMI, FL)
(Resource Conservation and Recovery Act (tracking hazardous waste)) Organizations: JOHN KARABASZ, OP MGR (CONTACT/OWNER)
GENERAL QUICK COPY (6010 S DIXIE HWY in SOUTH MIAMI, FL)
(Resource Conservation and Recovery Act (tracking hazardous waste)) Organizations: PETER THEAKSTON, MGR (CONTACT/OWNER)
AIR MINOR (AIRS/AFS) Business SIC classification: DRYCLEANING PLANTS, EXCEPT RUG CLEANING
Housing units lacking complete plumbing facilities: 0.3% Housing units lacking complete kitchen facilities: 0.6%
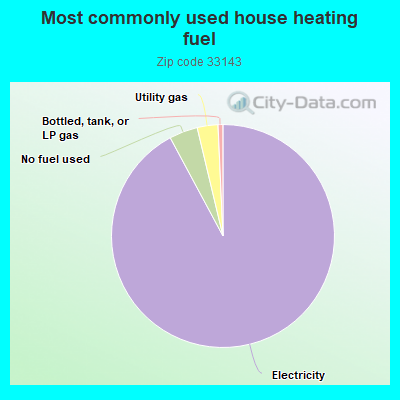
91.8%Electricity
4.1%No fuel used
3.0%Utility gas
0.7%Bottled, tank, or LP gas
Population in 1990: 28,410. Population change in the 1990s: +1,378 (+4.9%).
Place of birth for U.S.-born residents:
This state: 10,905
Northeast: 2,558
Midwest: 1,237
South: 1,255
West: 561
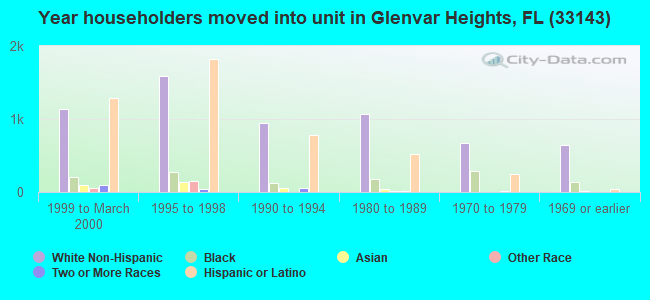
57% of the 33143 zip code residents lived in the same house 5 years ago. Out of people who lived in different houses, 81% lived in this county. Out of people who lived in different counties, 50% lived in Florida.
90% of the 33143 zip code residents lived in the same house 1 year ago. Out of people who lived in different houses, 45% moved from this county. Out of people who lived in different houses, 8% moved from different county within same state. Out of people who lived in different houses, 22% moved from different state. Out of people who lived in different houses, 31% moved from abroad.
Private vs. public school enrollment:
Students in private schools in grades 1 to 8 (elementary and middle school): 1,077
Here:
34.9%
Florida:
15.8%
Students in private schools in grades 9 to 12 (high school): 438
Here:
54.5%
Florida:
12.9%
Students in private undergraduate colleges: 1,222
Here:
60.9%
Florida:
23.6%
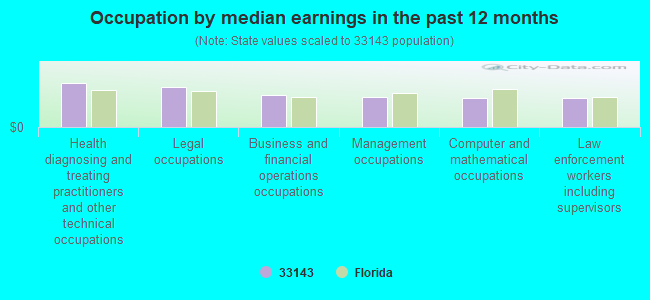
Occupation by median earnings in the past 12 months ($)
112,517Health diagnosing and treating practitioners and other technical occupations
103,038Legal occupations
81,825Business and financial operations occupations
76,709Management occupations
74,985Computer and mathematical occupations
73,693Law enforcement workers including supervisors
Companies with federal contracts located in this zip code:
BRAIM IMAGE TECH, INC (600 PUERTA AVE in CORAL GABLES, FL; small business)
$92,052 with Army for Other Defense -- Applied Research and Exploratory Development (R&D). Signed on 2004-03-01. Completion date: 2004-10-22.
Robert E. Pickard (6280 Sunset Drive in South Miami, FL; small business) : $61,152 in 2 contractsin 2005
$31,152 with Offices, Boards and Divisions (includes Attorney General, Deputy Attorney General, etc.) for Expert Witness. Taking place in TX. Signed on 2005-02-18. Completion date: 2005-12-31.
$30,000 with Offices, Boards and Divisions (includes Attorney General, Deputy Attorney General, etc.) for Expert Witness. Signed on 2005-02-25. Completion date: 2006-02-25.
PJ TECHNOLOGIES INC (7621 SW 54TH AVE in MIAMI, FL; small business) : $15,159 in 2 contractsfrom 2004 to 2005
$11,142 with Navy for ADP Software. Signed on 2005-12-22. Completion date: 2005-12-30.
$4,017 with Army for ADP Software. Taking place in VA. Signed on 2004-09-07. Completion date: 2004-10-07.
MIAMI MENS SENIOR BASEBALL LEA (5681 SW 59 PLACE in MIAMI, FL; small business)
$5,460 with Army for Photographic Projection Equipment. Signed on 2004-02-24. Completion date: 2004-05-28.
abdul agha, md (6701 SUNSET DRIVE in MIAMI, FL)
$614 with Bureau of Prisoners/Federal Prison System for Other Medical Services. Signed on 2005-09-23. Completion date: 2005-09-30.
cedars pathology associates (5901 S.W. 74TH STREET in MIAMI, FL)
$562 with Bureau of Prisoners/Federal Prison System for Pathology Services. Signed on 2005-09-22. Completion date: 2005-09-30.
Top industries in this zip code by the number of employees in 2005:
Health Care and Social Assistance: General Medical and Surgical Hospitals (over 1000 employees: 1 establishment, 500-999 employees: 2 establishments)
Management of Companies and Enterprises: Corporate, Subsidiary, and Regional Managing Offices (over 1000: 1)
Health Care and Social Assistance: Offices of Physicians (except Mental Health Specialists) (20-49: 7, 10-19: 16, 5-9: 30, 1-4: 71)
Administrative and Support and Waste Management and Remediation Services: All Other Travel Arrangement and Reservation Services (250-499: 1, 10-19: 1, 1-4: 1)
Health Care and Social Assistance: HMO Medical Centers (250-499: 1)
2008 - 2018 National Fire Incident Reporting System (NFIRS) incidents
Based on the data from the years 2008 - 2018 the average number of fire incidents per year is 58. The highest number of reported fire incidents - 80 took place in 2009, and the least - 27 in 2016. The data has a decreasing trend.
When looking into fire subcategories, the most incidents belonged to: Outside Fires (46.9%), and Structure Fires (32.2%).
Fire incident types reported to NFIRS in Zip Code 33143


+$6,059
-$6,005
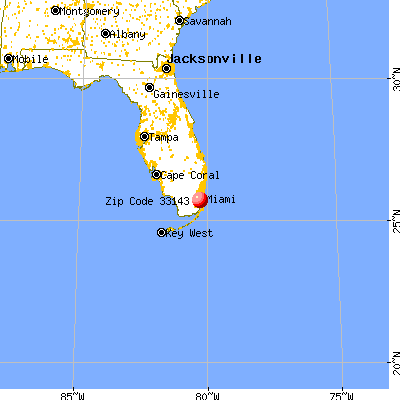
 Nearest zip codes: 33146, 33156, 33155, 33134, 33173, 33144.


 Based on the data from the years 2008 - 2018 the average number of fire incidents per year is 58. The highest number of reported fire incidents - 80 took place in 2009, and the least - 27 in 2016. The data has a decreasing trend.
 When looking into fire subcategories, the most incidents belonged to: Outside Fires (46.9%), and Structure Fires (32.2%).